


Abstract
Motivation: The cell nucleus is a highly organized cellular organelle that contains the genetic material. The study of nuclear architecture has become an important field of cellular biology. Extracting quantitative data from 3D fluorescence imaging helps understand the functions of different nuclear compartments. However, such approaches are limited by the requirement for processing and analyzing large sets of images.
Results: Here, we describe Tools for Analysis of Nuclear Genome Organization (TANGO), an image analysis tool dedicated to the study of nuclear architecture. TANGO is a coherent framework allowing biologists to perform the complete analysis process of 3D fluorescence images by combining two environments: ImageJ (http://imagej.nih.gov/ij/) for image processing and quantitative analysis and R (http://cran.r-project.org) for statistical processing of measurement results. It includes an intuitive user interface providing the means to precisely build a segmentation procedure and set-up analyses, without possessing programming skills. TANGO is a versatile tool able to process large sets of images, allowing quantitative study of nuclear organization.
Availability: TANGO is composed of two programs: (i) an ImageJ plug-in and (ii) a package (rtango) for R. They are both free and open source, available (http://biophysique.mnhn.fr/tango) for Linux, Microsoft Windows and Macintosh OSX. Distribution is under the GPL v.2 licence.
Contact: thomas.boudier@snv.jussieu.fr
Supplementary information: Supplementary data are available at Bioinformatics online.
1 INTRODUCTION
The nucleus is a heterogeneous and compartmentalized organelle. The spatial localization of genes and nuclear compartments within the nucleus affects cellular functions, such as regulation of gene expression, DNA replication and repair (Austin et al., 2010). The underlying mechanisms are still a matter of extensive investigation.
Nuclear organization can be studied using several imaging techniques. For example, immunocytochemistry and fluorescence in situ hybridization (FISH) allow the selective fluorescent labeling of protein-enriched compartments and chromosomal domains, respectively. Though recent microscopes facilitate the acquisition of large sets of 3D images, the automatic processing and analysis of those images remains a difficult task.
Several software programs have already been developed. CellProfiler (Kamentsky et al., 2011), which is one of the most popular, only performs 2D analysis. FishFinder (Shirley et al., 2011) and NEMO (Iannuccelli et al., 2010) perform 3D analysis but have limited image processing and analysis capabilities.
To overcome these limitations, we have developed Tools for Analysis of Nuclear Genome Organization (TANGO), an image analysis framework, which permits biologists to perform the complete analysis process of 3D fluorescence images: image processing, quantitative analysis and statistical processing. A potential application is the study of radial position variations of various structures (such as genes or centromeres) with respect to the nuclear membrane or to nucleoli, throughout the cell cycle.
2 IMAGE PROCESSING
2.1 Data organization and general workflow
The input data of TANGO consists of multichannel Z-stack images of microscopy fields, containing one or several nuclei. Each channel corresponds to a fluorescent marker and can be associated with a biological compartment of interest (further termed structure). All image files compatible with Bio-formats (http://loci.wisc.edu/software/bio-formats) (>100 formats) can be imported to TANGO. The processing workflow is composed of two successive steps (Supplementary Fig. S1): segmentation of nuclei, followed by segmentation of structures within each nucleus (when needed). This results in an hierarchical organization of data: fields contain nuclei, which contain structures, which can contain segmented objects. This pre-defined workflow simplifies the workload: TANGO only requires specification of the number of channels, then the definition of associated structures. For performance and usability, all images and parameters are stored in a MongoDB database, a highly powerful document-oriented system (http://mongodb.org).
2.2 Segmentation/Processing chains
Segmentation, i.e. detection of nuclei and nuclear structures, is achieved by applying a processing chain to the associated image. A processing chain is composed of three steps: pre-processing, segmentation and post-processing, as detailed in Supplementary Figure S2. Each step is a combination of one or several processing operations. TANGO contains rapid 3D implementations of >30 commonly used filters (such as top-hat, Laplacian of Gaussian or morphological filters) and several segmentation algorithms (such as seeded watershed or hysteresis thresholding) including those we have developed (listed in Supplementary Table S1). Moreover, programmers can easily add their own processing operations as ImageJ plug-ins. By taking advantage of this large collection, processing chains can be precisely adapted to the variety of structures to be analyzed, including the nucleus itself and structures composed of spot-like or larger objects. Although one must have a minimal knowledge in image processing to define a processing chain, no programming skills are required: for each step, users choose specific plug-ins and adjust their parameters (Supplementary Fig. S2). Robustness over field-to-field or cell-to-cell intensity variations can be increased by using methods to automatically compute thresholds instead of constant values, which is essential for automation of segmentation procedures in a high-throughput context. Once defined, processing chains that have been validated for a specific type of structure can be re-used in different experiments as templates.
2.3 Manual intervention
When automatic processing fails to correctly segment objects, a manual intervention is possible. Segmented objects can be merged, split, erased or created with semi-automatic procedures.
3 DATA ANALYSIS
3.1 Data browsing
Figure 1 shows the data browsing tab that allows one to rapidly access the data (images and measurement results) related to each object or structure contained in each nuclei. Raw and segmented images can be visualized as grayscale stacks, overlay stacks or 3D representations (Supplementary Fig. S3). Nuclei and objects can be annotated to define different sub-populations.
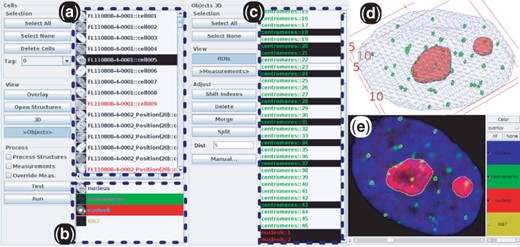
The data browsing tab of the user interface provides access to the different levels of objects: (a) nuclei, (b) structures contained in the selected nuclei (in the present case: centromeres and nucleoli), (c) segmented objects contained in the selected structures. Different visualizations of a nucleus: (d) 3D, (e) overlay. Contours of selected objects in (c) can be interactively displayed on (e), which is useful to assess quality of segmentation
3.2 Quantitative image analysis
Quantitative image analysis is the process of computing numerical information describing each structure and the relationships between them. Voxel-based measurements quantify the staining pattern of a fluorescence signal within a segmented structure (e.g. mean intensity inside or outside objects, radial autocorrelation, layer measurements) or the co-localization of two signals. Segmentation-based measurements provide morphological descriptors of objects (e.g. volume, elongation) or descriptors of spatial relations between several objects, including overlap, border-to-border distance between pairs of objects or radial localization within the nucleus. TANGO includes a large collection of 3D measurements, some of which are rarely encountered in image analysis software (listed in Supplementary Table S2), and programmers can easily add their own plug-ins. Analysis results are stored in the database and can be exported to formatted text files compatible with statistical processing software.
3.3 Statistical processing with R
A part of TANGO is implemented as an R-package. Measurement results can be directly imported from the TANGO database to R as indexed dataframe objects and thus can be processed using the wide panel of functions provided by R. When analyzing data, it can be useful to visualize the images associated to a subset of the studied population. To do so, sub-populations of nuclei and objects can be defined in R and will be highlighted in TANGO. This can be accomplished through the use of interactive plots (Supplementary Fig. S4). Finally, rtango is compatible with a flow-cytometry r-package (flowcore) that implements specific data visualization and analysis tools, thereby providing a complete solution for image cytometry.
4 CONCLUSION
TANGO is a versatile software, which, owing to a large collection of 3D processing operations and measurements as well as a convenient data visualization and analysis system, allows biologists to obtain quantitative information regarding the organization of the nucleus. We have successfully detected and analyzed various types of FISH (e.g. BAC probes or chromosome territories) and immunocytochemistry (e.g. centromeres or nucleoli) signals. TANGO is integrated into ImageJ and R, both of which are modular open-source software widely used in the scientific community, allowing one to benefit from the rich potential of the two environments when using TANGO (Supplementary Fig. S5).
ACKNOWLEDGEMENT
The authors thank Dr Philippe Andrey for his helpful and valuable discussions on image processing, and advice on TANGO.
Conflict of Interest: none declared.
REFERENCES
Author notes
Associate Editor: Jonathan Wren

