


Abstract
A continuous isoelectric electroencephalogram reflects an interruption of endogenously-generated activity in cortical networks and systematically results in a complete dissolution of conscious processes. This electro-cerebral inactivity occurs during various brain disorders, including hypothermia, drug intoxication, long-lasting anoxia and brain trauma. It can also be induced in a therapeutic context, following the administration of high doses of barbiturate-derived compounds, to interrupt a hyper-refractory status epilepticus. Although altered sensory responses can be occasionally observed on an isoelectric electroencephalogram, the electrical membrane properties and synaptic responses of individual neurons during this cerebral state remain largely unknown. The aim of the present study was to characterize the intracellular correlates of a barbiturate-induced isoelectric electroencephalogram and to analyse the sensory-evoked synaptic responses that can emerge from a brain deprived of spontaneous electrical activity. We first examined the sensory responsiveness from patients suffering from intractable status epilepticus and treated by administration of thiopental. Multimodal sensory responses could be evoked on the flat electroencephalogram, including visually-evoked potentials that were significantly amplified and delayed, with a high trial-to-trial reproducibility compared to awake healthy subjects. Using an analogous pharmacological procedure to induce prolonged electro-cerebral inactivity in the rat, we could describe its cortical and subcortical intracellular counterparts. Neocortical, hippocampal and thalamo-cortical neurons were all silent during the isoelectric state and displayed a flat membrane potential significantly hyperpolarized compared with spontaneously active control states. Nonetheless, all recorded neurons could fire action potentials in response to intracellularly injected depolarizing current pulses and their specific intrinsic electrophysiological features were preserved. Manipulations of the membrane potential and intracellular injection of chloride in neocortical neurons failed to reveal an augmented synaptic inhibition during the isoelectric condition. Consistent with the sensory responses recorded from comatose patients, large and highly reproducible somatosensory-evoked potentials could be generated on the inactive electrocorticogram in rats. Intracellular recordings revealed that the underlying neocortical pyramidal cells responded to sensory stimuli by complex synaptic potentials able to trigger action potentials. As in patients, sensory responses in the isoelectric state were delayed compared to control responses and exhibited an elevated reliability during repeated stimuli. Our findings demonstrate that during prolonged isoelectric brain state neurons and synaptic networks are dormant rather than excessively inhibited, conserving their intrinsic properties and their ability to integrate and propagate environmental stimuli.
Introduction
The EEG provides valuable information during the electroclinical investigation of patients with signs of acute or chronic cerebral suffering, including epileptic seizures, altered states of consciousness, toxic-metabolic encephalopathy, comas and suspected brain death (Laureys et al., 2004; Noachtar and Rémi, 2009; Andraus and Alves-Leon, 2011; Lehembre et al., 2012). The most critical brain state, systematically correlated with a complete dissolution of consciousness in all its dimensions, is manifested by a prolonged isoelectric, or nearly flat (<10 µV), EEG profile (Young, 2000; Husain, 2006; André-Obadia et al., 2014). This apparent electro-cerebral inactivity is commonly regarded as the result of a total cessation of endogenously-generated synaptic activity (Kroeger and Amzica, 2007; Ferron et al., 2009; Kroeger et al., 2013; Altwegg-Boussac et al., 2014, 2016). An isoelectric EEG profile is usually irreversible when due to ischaemic encephalopathy, traumatic head injury, tumour or long-lasting anoxia (Trojaborg and Jorgensen, 1973; Husain, 2006), while it can be temporally or totally reversed when caused by profound hypothermia (Stecker et al., 2001) or administration of elevated doses of CNS depressant medications, such as barbiturate-derived drugs (Bird and Plum, 1968; Ganes and Lundar, 1983; Chatrian et al., 1996; Laureys, 2005). Drug-induced isoelectric EEG can be intentionally obtained in patients suffering from hyper-refractory status epilepticus in order to stop persistent seizure activity and protect the brain from its deleterious consequences (Orlowski et al., 1984; Claassen et al., 2002; Rosenow and Knake, 2008).
Despite the lack of detectable spontaneous electrical activity at the surface of the brain, sensory responses are occasionally observed, although generally altered in amplitude or latency, during flat EEG periods. In patients and animals responding to the electroclinical criteria of brain death, including loss of brainstem reflexes and isoelectric EEG, the early (subcortical) components of multimodal sensory-evoked potentials can be preserved, whereas the later ones (cortical) are consistently absent (Nau et al., 1987; Ruiz-Lopez et al., 1999; Facco et al., 2002; Laureys, 2005). During therapeutic or experimental hypothermia, induced to protect the brain from hypoxic–ischaemic injury, sensory responses progressively disappear with cooling (Stecker et al., 2001; Wu et al., 2012), paralleling the slowing down of spontaneous EEG waves, with a complete abolition of spontaneous and induced activities at ∼17°C in humans (Stecker et al., 2001; Westover et al., 2015). The impact of anaesthetic-induced EEG suppression on brain responsiveness to sensory inputs depends on species and the type of anaesthesia. In the cat, barbiturate-induced isoelectric EEG results in a delay of the late components of somatosensory-evoked potentials (SEPs) and brainstem auditory-evoked potentials (AEPs), and in an abolition of the late waves of the visually-evoked potentials (VEPs) (Sutton et al., 1982). In contrast, a complete failure of sensory responses is reported when the cerebral inactivity is caused by deep isoflurane anaesthesia (Kroeger and Amzica, 2007). In patients with refractory status epilepticus, treated with barbiturate derivative drugs, mild sensory stimuli can produce exacerbated responses on flat EEG periods (Jäntti et al., 1994; Baxter et al., 2003; Dan and Boyd, 2006).
There is thus a discrepancy between the common view of an isoelectric EEG being the hallmark of the deepest inactivated brain state, with a collapse of neuronal excitability (Dec and Sarna, 1983; Ferron et al., 2009), and the clinical and experimental observations that sensory responses can persist in such a condition. In addition, we have recently shown that rat neocortical neurons can still fire action potentials in response to direct stimulation after administration of elevated doses of barbiturate causing continuous flatline EEG (Altwegg-Boussac et al., 2014, 2016).
Crucial issues have yet to be addressed concerning the neurophysiological status of prolonged isoelectric brain state, notably its intracellular counterparts and the neuronal mechanisms underlying potential persistent sensory responses. Here, we first confirmed in patients with hyper-refractory status epilepticus the possibility to generate multimodal sensory-evoked potentials during thiopental treatment resulting in isoelectric EEG profile. We then used an analogous pharmacological procedure to induce electro-cerebral inactivity in the rat and combined electrocorticogram (ECoG) and intracellular recordings to study its neuronal correlates in different brain regions, including primary somatosensory cortex (S1), hippocampus and thalamus. We next investigated the origin of the prolonged neuronal silence, challenging the two main hypotheses: a sustained synaptic inhibition or a disfacilitation, i.e. a quiescent state deprived of any synaptic activity. We finally explored the whisker-evoked sensory responses generated on the flat ECoG in rats and identified their neuronal mechanisms. This interspecies and multi-scale electrophysiological investigation unveils a dormant brain state with persisting neuronal and network functionality, allowing the endogenously-inactive brain to reliably respond to sensory stimuli.
Materials and methods
Human experiments
EEG recordings and multimodal sensory stimulations were obtained from patients admitted to the neurological intensive care unit of the Hôpital Pitié-Salpêtrière (Paris). This electrophysiological monitoring was part of the clinical care procedure and the use of the data was approved by the French data protection authority (CNIL).
EEG recordings
All patients recorded in this study (three females and one male, aged from 17 to 68 years old) suffered from hyper-refractory status epilepticus due to meningo-encephalitis of putative auto-immune (n = 3) or mitochondrial disease origin (n = 1). Since a combination of sedative and antiepileptic drugs (valproate, fosphenytoin, levetiracetam, midazolam, clonazepam, propofol) failed to interrupt seizures, patients were continuously perfused with sodium thiopental (from 40 to 400 mg/h), resulting in a continuous isoelectric EEG. Control EEG recordings were obtained from a cohort of five healthy human subjects (three females and two males, aged from 24 to 72 years).
EEG recordings were performed using needle or cup electrodes of low impedance (<20 kΩ) placed in the fronto-polar (Fp1, Fp2), temporal (T3, T4), central (C3, C4) and occipital (O1, O2) regions of the scalp according to the international 10-20 system (Fig. 1E, inset). A reference electrode was affixed to the central region of the midline (Cz). EEG signals were amplified (SD amplifier, Micromed S.p.a), band-passed filtered between 0.53 and 70 Hz, notch-filtered (to remove power-line frequency noise) and digitized at 256 Hz. Peak-to-peak amplitude of EEG signals was measured from recording periods of 78.3 ± 10.9 s (n = 9 subjects) after removal of the DC (direct current) component.
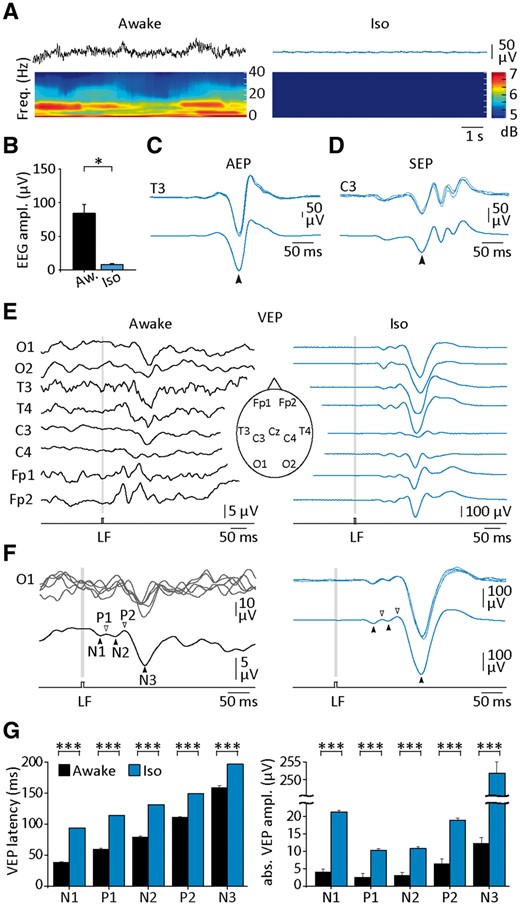
Comparison of sensory-evoked potentials recorded in human subjects during waking and isoelectric EEG. (A) Background EEG activity in a healthy awake subject (left) and in a patient with intractable status epilepticus who received high doses of sodium thiopental (right). The corresponding time-frequency maps, obtained using the Morlet wavelet, are depicted below the recordings. (B) Histogram of EEG amplitudes measured from awake subjects (Aw, n = 5) and patients with drug-induced isoelectric EEG (Iso, n = 4). (C and D) Representative AEPs (C) and SEPs (D) recorded from a patient with an isoelectric EEG. Five individual responses (top recordings) are superimposed above the corresponding averaged (n = 30 successive trials) potentials (bottom). The arrowheads indicate the maximum amplitude of the responses. (E and F) VEPs in response to repeated light flashes (LF) (8-ms duration) recorded using scalp EEG electrodes (eight electrodes positioned as illustrated in the inset in E) in a waking subject (E, Awake) and in a patient in isoelectric state (E, isoelectric). Here and in the following figures, the stimulation period is indicated by the grey boxes. (F) Superimposition of individual VEPs (top traces, n = 5) recorded from the O1 electrode in the waking and comatose subject and corresponding averaged responses (bottom traces, n = 50 successive trials). The arrowheads indicate the different components typically composing the flash-induced VEP. (G) Summary data of the mean latency and absolute amplitude of the different VEP components computed from the two subjects illustrated in E and F. *P < 0.05; ***P < 0.001.
In comatose patients, after a period of baseline recording in isoelectric state, multimodal sensory stimuli were repeatedly applied to test for the presence of SEPs, AEPs and VEPs. We first tested ordinary auditory (hand claps, call the patient’s name, closing the room door) and somatosensory (light touch on arms, feet or face, moving the body) stimuli, which provide the everyday background sensory environment of patients staying in intensive care. Controlled visual stimulations (8 ms duration, 0.2 to 0.3 J) were delivered in healthy and comatose subjects using a xenon light (Flash 10S, Micromed S.p.a) placed ∼50 cm from the nasion (Odom et al., 2010; Chipaux et al., 2013). Light flashes were chosen instead of the classical reversal stimuli pattern because of the impossibility of unconscious patients to understand the required instructions (Walsh et al., 2005). Only trials exhibiting all the classically described components of the VEP (Odom et al., 2010) were considered for analysis. The latency of each component of the VEP was measured as the time interval between the onset of the stimulus and the peak potential of the wave. Their amplitude was measured from the baseline EEG, averaged over a 10 ms time window preceding the stimulus onset, to the peak potentials. The trial-to-trial variability in the amplitude of sensory-evoked responses was assessed by measuring their coefficient of variation (CV) during a series of repeated stimulations. Time-frequency maps were obtained by applying Morlet wavelet transforms to the EEG signal (Altwegg-Boussac et al., 2014).
Animal experiments
Experiments were carried out in accordance with the European Union guidelines (directive 2010/63/EU) and approved by the Charles Darwin Ethical Committee on Animal Experimentation (C2EA-05). Every precaution was taken to minimize stress and the number of animals used in each series of experiments. The general experimental procedures have been described in details in previous studies (Altwegg-Boussac et al., 2014, 2016).
Surgery and preparation for in vivo recordings
Adult male Sprague Dawley rats (n = 40) were initially anaesthetized by intraperitoneal injection of sodium pentobarbital (40 mg/kg) and ketamine (50 mg/kg). Animals were intubated, placed in a stereotaxic frame and a small craniotomy was made above the regions of interest (see below). Animals were then immobilized by intramuscular injection of gallamine triethiodide (40 mg/2 h) and artificially ventilated (76–105 breaths/min). After completing surgery, we switched to different anaesthetic regimes to generate, in control conditions, two distinct patterns of cortical activity. As previously reported, sodium pentobarbital anaesthesia [10–15 mg/kg/h, intraperitoneal (i.p.); n = 23 rats] induced large rhythmic biphasic EEG waves at 5–7 Hz while fentanyl narcosis (3 µg/kg/h, i.p.; n = 17 rats) led to small amplitude and apparently desynchronized EEG activity reminiscent of the waking state (Mahon et al., 2001; Steriade et al., 2001; Bruno and Sakmann, 2006; Altwegg-Boussac et al., 2014, 2016; Depaulis et al., 2016). To replicate the electro-cerebral silence induced in human patients, high doses of sodium pentobarbital were then intraperitoneally administrated (n = 40 rats; see ‘Results’ section for specific dosages), leading to a continuous isoelectric ECoG pattern (Fig. 2A; Altwegg-Boussac et al., 2014, 2016). The physiological constants, i.e. the heart rate, end-tidal carbon dioxide concentration (EtCO2), oxygen saturation (SpO2), respiratory rate and core temperature, were continuously monitored throughout the experiments (Fig. 2A and Supplementary Table 1). Core temperature was maintained (36.5–37.5°C) using a feedback-controlled heating blanket.
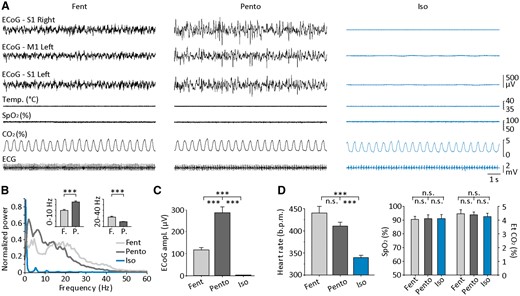
ECoG patterns and corresponding physiological parameters in rats during control and isoelectric brain states. (A) Simultaneous ECoG recordings (top traces) from the two primary somatosensory cortices (S1) and primary motor cortex (M1), together with the monitoring of core temperature (Temp.), oxygen saturation (SpO2), carbon dioxide concentration (CO2) and electrocardiogram (ECG), under fentanyl (Fent) and pentobarbital (Pento) control periods and after induction of the isoelectric state (Iso). (B and C) Quantitative comparison of ECoG activities. (B) Averaged spectral power densities of S1 ECoG in the three conditions (fentanyl, n = 17 rats, pentobarbital, n = 23 rats, isoelectric, n = 32 rats). The inset shows the averaged normalized cortical power (scale: 0–0.5) in the 0–10 and 20–40 Hz bands calculated during fentanyl (F.) and pentobarbital (P.) control states. (C) Summary data comparing the full amplitude of ECoG signals (from representative periods of 30 s) during the three states. (D) Comparison of physiological parameters associated with the three brain states (fentanyl, n = 4 rats; pentobarbital, n = 6 rats, isoelectric, n = 5 rats). The heart rate (left) was significantly slowed down during the isoelectric state, whereas oxygen saturation (SpO2) and end-tidal carbon dioxide concentration (EtCO2) remained stable. The three recordings in A are from the same experiment. ***P < 0.001; n.s. = non-significant.
Electrophysiological recordings and sensory stimulations
In all experiments (n = 40 rats), ECoG activity was recorded using a monopolar silver electrode placed on the dura over the whisker-related primary somatosensory cortex (S1) (7–8 mm anterior to the interaural line, 4.5–5.5 mm lateral to the midline) (Paxinos and Watson, 1986), with the reference electrode placed on a muscle at the opposite side of the head. In six rats, multi-ECoG recordings were obtained simultaneously from both ipsi- and contralateral S1 and primary motor cortices (M1, 10–11 mm anterior to the interaural line, 2.5 mm lateral to the midline). ECoG recordings were amplified with a differential AC (alternating current) amplifier (Model 1700; A-M Systems), filtered at 1 Hz–1 kHz and digitized at 2–3 kHz (CED 1401plus; Cambridge Electronic Design). In conjunction with S1 ECoG, current-clamp intracellular recordings were obtained, using glass micropipettes filled with 2 M potassium acetate or 3 M potassium chloride (50–90 MΩ), amplified using an Axoclamp 2B or 900 A amplifier (Molecular Devices) operating in bridge mode, filtered at 3 kHz and digitized at 10–20 kHz. Pyramidal cortical neurons, recorded in the layers 5/6 of S1 (894–2274 µm below the cortical surface, n = 25), were identified on the basis of their morphological and electrophysiological properties (Supplementary material) (Feldman, 1984; Steriade, 2004). In specific sets of experiments (n = 11), the monitoring of S1 ECoG was coupled with thalamic or hippocampal recordings. Local field potentials, recorded with a bipolar concentric electrode (NE-100; Rhodes Medical Instruments), and intracellular recordings of thalamic neurons (4113–6791 µm below the cortical surface, n = 7 neurons) were obtained from the ventroposteromedial (n = 3) and posteromedial thalamus (n = 4) (5.2–5.9 mm anterior to the interaural line, 2–2.7 mm lateral to the midline). Intracellularly recorded hippocampal neurons (n = 4 neurons) were located at the following coordinates: 4.1–5.2 mm anterior to the interaural line, 1.1–2.8 mm lateral to the midline, 2734–2936 µm below the cortical surface. Whisker stimulations consisted of air puffs (50 ms, 10–40 psi) delivered every 2.25 s to the contralateral mystacial pad. The orientation and intensity of the air puff were adjusted during control periods to generate the SEP of maximal amplitude in the S1 ECoG (Mahon and Charpier, 2012).
Data analysis
All data were analysed using Spike2 (version 7; Cambridge electronic Design) and Origin (version 8.1; OrginLab Corporation). Average membrane potential (Vm) values were calculated as the mean of the distribution of spontaneous intracellular subthreshold activity recorded for 10–60 s and the amplitude of Vm fluctuations corresponded to the standard deviation of the distribution (σVm). Apparent membrane resistance (Rm) was measured from the peak of the averaged (n ≥ 20) voltage response to injection of small negative current pulses (−0.4 nA, 100–200 ms duration, applied every 0.5–2.25 s) or as the slope of the linear portion of voltage-current relationships as previously described (Altwegg-Boussac et al., 2014; Marsan et al., 2016). The membrane time constant (τm) was derived from an exponential decay fit applied to the initial phase of the current-induced hyperpolarization. The voltage threshold for action potential generation was defined as the Vm at which dV/dt exceeded 10 V/s (Mahon and Charpier, 2012). Action potential amplitude was measured as the potential difference between the voltage threshold and the peak from averages of 10 waveforms. Spontaneous firing rate of cortical neurons was measured from representative periods of 10 to 60 s. The spectral contents of intracellular and ECoG signals, depicted by time-frequency maps, were obtained using wavelet transform analyses performed with custom-written functions in Matlab (MathWorks).
The peak latency and amplitude of the SEP’s first component were measured as described for human sensory responses. To assess the amount of evoked cortical synaptic activity, we calculated the area of the SEP’s first component from the onset of the negative response to the return to the same potential (Fig. 6D). Latency of the whisker-evoked intracellular responses was calculated as the time between the onset of the stimulus and the peak of the depolarizing postsynaptic potentials (dPSPs). The amplitude of dPSPs was measured from their foot to the peak depolarization, and their rising slope was determined by approximating the initial depolarization phase as a straight line. The variability of SEP and dPSP amplitude was assessed by measuring the standard deviation (σ) or CV values across successive trials. Firing probability on sensory responses was calculated as the ratio between the number of suprathreshold responses and the total number of stimulations applied. Latency of sensory-evoked action potentials was defined as the time between the onset of the air puff and the peak of the action potential. The analysis of action potential properties was restricted to cells with sufficient number of suprathreshold responses (n ≥ 5) to allow a reliable comparison between control and isoelectric conditions.
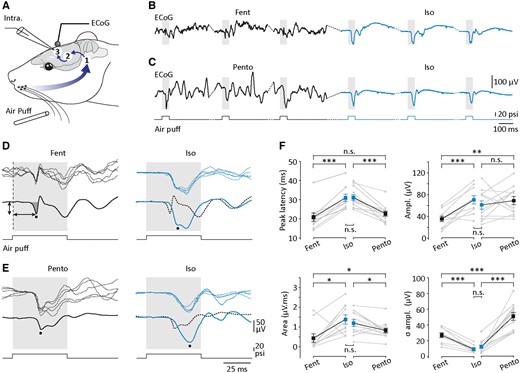
Comparison of ECoG potentials evoked by whisker stimulation during active and isoelectric brain states in the rat. (A) Experimental arrangement for recording of sensory responses in the rat cortex. Simultaneous ECoG and intracellular (Intra; see Fig. 7) recordings were made from S1. Short air puffs were delivered on whiskers, activating a polysynaptic network sequentially composed by the ipsilateral trigeminal brainstem complex (1), the contralateral somatosensory thalamic nuclei (2) and the contralateral S1 networks (3). (B and C) Typical surface cortical responses (n = 3 trials) evoked by contralateral whisker stimulation (air puffs of 50-ms duration, 20 psi) applied under fentanyl (Fent, B) and pentobarbital (Pento, C) anaesthesia, and during the subsequent isoelectric state (Iso, right). (D and E) Superimposition of five ECoG potentials (top recordings) evoked by air puffs, under fentanyl (D), pentobarbital (E) and during the isoelectric state (right panels). The bottom traces are the corresponding averaged responses (n ≥ 49 successive trials). The dashed traces in D and E (right) represent the corresponding averaged control records. As indicated in D, the peak latency of sensory responses was measured from the onset of the stimulus (vertical dashed line) to the peak deflection (horizontal arrow) and their amplitude from the baseline value preceding the stimulation to the peak (vertical arrow). The area of cortical responses was computed from their onset to the return to the baseline potential (dark grey area in D). (F) Summary data of the peak latency, amplitude (Ampl.), trial-to-trial amplitude variation (σ amplitude), and area of the sensory-evoked responses, obtained under fentanyl (Fent, n = 10 experiments), pentobarbital (Pento, n = 12 experiments) and after the suppressive injection (isoelectric, Iso). *P < 0.05; **P < 0.01; ***P < 0.001; n.s. = non-significant. B and D, and C and E are from two different experiments. Grey lines indicate individual experiments and black lines connect the corresponding mean values (±SEM).
Statistical analysis
Numerical values are given as mean ± SEM, unless stated otherwise. Differences between groups were assessed using paired and unpaired two-tailed Student’s t-tests, one-way ANOVA, or the non-parametric Wilcoxon signed rank test and the Mann-Whitney rank sum test when appropriate (SigmaStat version 3.5, Systat Software). Differences were considered as statistically significant if P < 0.05.
Results
Sensory-evoked potentials in patients with isoelectric EEG
Scalp EEG recordings were obtained from five awake healthy human subjects and from four patients suffering from hyper-refractory status epilepticus, who received high doses of sodium thiopental to suppress paroxysmal activities. This pharmacological procedure resulted in prolonged attenuated cortical signals at each EEG electrodes. Compared to the activated patterns recorded from awake subjects (Fig. 1A, left), the background EEG activity of comatose patients did not show any detectable fluctuations (Fig. 1A, right) and its full amplitude was considerably reduced (awake EEG, 84.3 ± 12.8 µV, n = 5 subjects versus silent EEG, 7.6 ± 1.8 µV, n = 4 patients; P < 0.05) (Fig. 1A and B). This apparently flat cortical signal corresponded to the classical definition of an isoelectric EEG, commonly interpreted as a generalized suppression of ongoing cortical activity (Young, 2000).
Three patients with continuous isoelectric EEG were submitted to various ordinary auditory and somatosensory stimuli (see ‘Materials and methods’ section). The evoked responses had abnormally elevated amplitude, >300 µV and 50 µV for the largest components of AEPs and SEPs, respectively (arrowheads in Fig. 1C and D). Both types of evoked potentials, despite the absence of calibrated stimuli, were also highly reproducible in shape and amplitude from one test to another as attested by their low CV values (AEPs, CV amplitude = 8.4%, n = 30 trials; SEPs, CV amplitude = 15.2%, n = 26 trials) (Fig. 1C and D, top traces). To further quantify the changes in the sensory responses during flatline-EEG, we applied controlled visual stimulations and compared occipital VEPs between a control awake subject and a patient with persistent isoelectric EEG (Fig. 1E), using the same recording device and stimulation parameters. The visual responses in the awake condition were classically composed of an early negative component followed by a succession of positive and negative components (Harding et al., 1996; Odom et al., 2004, 2010) (Fig. 1F, left). The averaged VEPs recorded from the patient with isoelectric EEG displayed the same sequence of waves (Fig. 1F, right), however, with drastic changes in the latency and amplitude of individual components. The mean peak delay of the first negative component (N1) was 38.4 ± 1.5 ms (n = 25 trials) in the awake subject and 94.2 ± 0.3 ms (n = 49 trials; P < 0.001) in isoelectric condition, a temporal shift that persisted for the later components, while becoming gradually shorter (Fig. 1G, left). This was accompanied by a considerable augmentation in the absolute magnitude of all components, notably the third negative wave (N3) that was increased by >20-fold (awake, 12.3 ± 1.5 µV, n = 25 trials versus isoelectric, 252.0 ± 4.9 µV, n = 49 trials, P < 0.001) (Fig. 1G, right). These differences were confirmed in three more control subjects, which similarly exhibited sensory responses with shorter latency (from 27 to 39 ms for N1 component, n = 3 subjects) and lower amplitude (from 5.2 to 8.3 µV for N3 component, n = 3 subjects) in response to the transient visual stimuli. Large amplitude VEPs were recorded from all cortical areas in the comatose patient, suggesting that cortical visual responses were propagated and amplified without regional specificity. Again, the amplitude variability of visual responses was largely reduced in the isoelectric state, with a corresponding CV being on average ∼2.5 times lower than in control condition (awake, VEPs CV amplitude = 92.2%, n = 25 trials versus isoelectric, VEPs CV amplitude = 27.0%, n = 49 trials) (Fig. 1F, top traces). Altogether, these findings further demonstrate that sensory-evoked cortical responses can persist in human patients after interruption of spontaneous electrical activity. Moreover, the brain responses in the thiopental-induced isoelectric condition were increased in amplitude and displayed a high time-to-time reproducibility.
Induction of isoelectric ECoG in the rat
To investigate the neuronal correlates and the functional properties of the electrically-silent brain, we induced continuous isoelectric ECoG in the rat using large doses of a barbiturate-derived drug, as in patients. To determine whether the state of electro-cerebral inactivity depended upon the prior active brain state, flatline ECoG was generated from two distinct, pharmacologically-induced, control ECoG patterns exhibiting either sleep-like oscillatory waves (pentobarbital) or desynchronized waking-like background activity (fentanyl). ECoG recordings were obtained either from S1 alone (n = 34 rats) or from ipsi- and contralateral S1 together with M1 (n = 6 rats) (Fig. 2A). The statistical comparison of ECoG frequency contents in the two control states (Fig. 2B) indicated that low frequency waves (0–10 Hz) predominated under pentobarbital condition (n = 23 rats, P < 0.001, Fig. 2B, inset), whereas low gamma-range activities (20–40 Hz) were more present in the fentanyl condition (n = 17 rats, P < 0.001) (Fig. 2B, inset). As expected from the inverse relation between the power density and the frequency of cortical waves (Freeman, 2000), ECoG signals recorded under fentanyl had a relatively lower amplitude (fentanyl, 116.8 ± 11.5 µV, n = 17 rats; pentobarbital, 288.9 ± 26.9 µV, n = 23 rats; P < 0.001, Fig. 2A and C).
After control periods (11–78 min duration) with active ECoG, isoelectric brain state was induced by systemic injection of a bolus of sodium pentobarbital. Larger dosages were required after control periods using fentanyl (fentanyl → isoelectric, 122.5 ± 5.8 mg/kg, n = 17 rats; pentobarbital → isoelectric, 74.7 ± 3.7 mg/kg, n = 23 rats; P < 0.001), whereas the time needed to reach a continuous flatline ECoG was similar (fentanyl → isoelectric, 34.2 ± 3.4 min, n = 17 rats; pentobarbital → isoelectric, 25.7 ± 3.3 min, n = 23 rats; P > 0.05). The pentobarbital bolus injection first induced a period of spindle oscillations (Steriade et al., 1993), rapidly replaced by a burst-suppression profile that was characterized by transient periods of high-voltage waves (‘burst’) alternating with flatline-ECoG epochs (‘suppression’) (Steriade et al., 1994; Kroeger and Amzica, 2007; Ferron et al., 2009). The recurrence of burst events progressively slowed down, until reaching a persistent isoelectric line occurring simultaneously at the different cortical recording sites (Fig. 2A). The amplitude of the silent ECoGs was similar regardless of the preceding control state (fentanyl → isoelectric, 2.8 ± 0.4 µV, n = 17 rats; pentobarbital → isoelectric, 3.1 ± 0.4 µV, n = 23 rats, P > 0.4) (Fig. 2A and C) and consistent with the classical criteria for electro-cerebral inactivity in humans (Young, 2000; André-Obadia et al., 2014). Flat ECoG signals could be occasionally contaminated by small amplitude events unambiguously identified as heartbeat electrical artefacts (Figs 3B, 5B and 7A). Most physiological variables (i.e. the O2 saturation, end-tidal CO2 concentration, core temperature and respiratory rate) were kept stable during the induction of the isoelectric state as referred to control period (P > 0.05 for all parameters) (Fig. 2A and D) and laid in the range of normal rodent values (Supplementary Table 1) (Wolfensohn and Lloyd, 1998). The cardiac frequency was the only parameter to be substantially decreased compared to control active periods (P < 0.001; Fig. 2A and D, left), likely due to the depressing effect of sodium pentobarbital on heart rate (Merin, 1975; Sapru and Krieger, 1979).
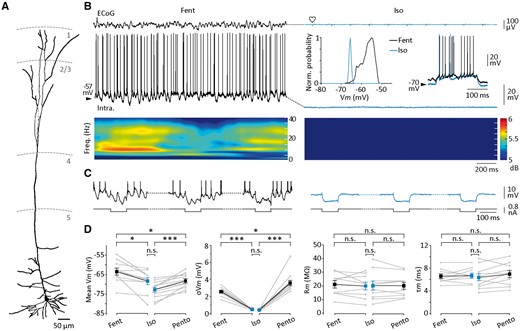
Neocortical neuronal correlates of isoelectric state in the rat. (A–C) Morphological and electrophysiological properties of an S1 layer 5 pyramidal neuron intracellularly recorded during active and subsequent isoelectric state. (A) Reconstruction of a S1 pyramidal neuron filled with neurobiotin (from 50-μm thick whole mounts). The cortical layers are delimited by the dashed lines. (B) Simultaneous recordings of ECoG (top recordings) and intracellular activities (bottom recordings) during active period (fentanyl) and after induction of flatline ECoG (isoelectric). Time-frequency maps of the intracellular signals are temporally aligned with the corresponding records. The insets depict the normalized probability density of Vm values (bin size 0.5 mV) and the current-evoked firing in control (black recording) and during ECoG suppression (blue recording). Here and in the following figures, the mean value of Vm is indicated at the left of intracellular records. (C) Neuronal voltage responses (top recordings) to a series of intracellularly injected negative current pulses (100 ms, −0.4 nA, every 500 ms) (bottom traces) during the brain states indicated in (B). Action potentials are truncated. (D) Population data of the mean Vm, Vm fluctuations (σVm), membrane input resistance (Rm) and time constant (τm) of neocortical neurons recorded under fentanyl (Fent, n = 10 neurons), light pentobarbital (Pent, n = 12 neurons) and during the following isoelectric state (Iso). *P < 0.05; ***P < 0.001; n.s. = non-significant. Grey lines indicate individual experiments and black lines connect the corresponding mean values (±SEM). Heart symbols indicate the cardiac artefacts visible in the ECoG signal. A–C are from the same neuron.
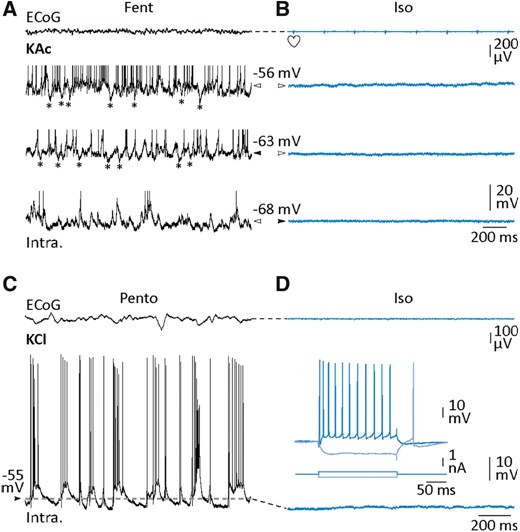
Lack of overwhelming Cl−-dependent inputs in neocortical neurons during isoelectric state. (A and B) Combined ECoG and intracellular recordings (using KAc electrode) from S1, in control (fentanyl, A) and during suspension of cortical activity (isoelectric, B). Intracellular records were made from a pyramidal cell, at rest in the two conditions (black arrowheads) and during DC displacement of Vm, as indicated by the white arrowheads. During active periods, presumed hyperpolarizing IPSPs (asterisks) could be detected in absence of holding current and during DC depolarization. DC current in control: +0.05 (top trace) and −0.2 nA (bottom trace). DC current in isoelectric condition: +0.2 (middle trace) and +0.4 nA (top trace). (C and D) S1 ECoG monitoring and simultaneous intracellular activity of a pyramidal cortical neuron recorded using an intracellular pipette filled with KCl in control (pentobarbital, C) and after induction of the isoelectric state (isoelectric, D). Note the absence of depolarizing Cl−-dependent IPSPs during ECoG suppression. The voltage responses of the cortical neuron to depolarizing and hyperpolarizing current pulses are shown in the inset. Heart symbols indicate the cardiac artefacts visible in the ECoG signal.
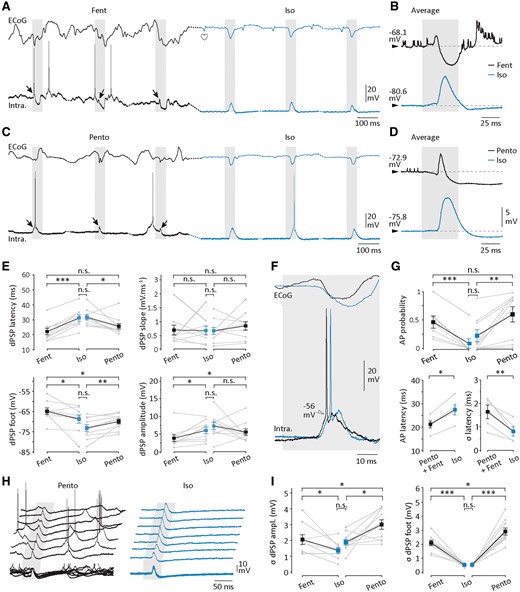
Intracellular sensory responses during continuous isoelectric state. (A and C) Simultaneous recordings of ECoG (top traces) and intracellular (Intra., bottom traces) responses to three successive whisker stimulations (20 psi, grey boxes) obtained during fentanyl (A) and pentobarbital (C) control conditions, and following induction of isoelectric state (Iso, blue recordings). Arrows indicate the dPSPs induced by the sensory stimuli applied during active control periods. B and D are expansions of the corresponding averaged intracellular sensory responses obtained in control (black traces) (fentanyl, n = 25 successive trials; pentobarbital, n = 124 successive trials) and during the subsequent isoelectric condition (blue traces) (B, n = 46 successive trials; D, n = 126 successive trials). The horizontal dashed lines indicate the mean Vm just preceding the stimulus. (E) Population data illustrating the peak latency of dPSPs (dPSP latency), the Vm value at their onset (dPSP foot), their mean amplitude (dPSP amplitude) and the slope of their rising phase (dPSP slope), in the indicated conditions. (F and G) Properties of the sensory-evoked suprathreshold responses in the three conditions of brain activity. (F) Simultaneous recording of ECoG and intracellular suprathreshold responses to whisker stimulations applied under pentobarbital (black traces) and after suppression of the spontaneous synaptic activity (blue traces). Note that the voltage threshold (arrowhead) and the amplitude of action potentials (AP) were not affected during the isoelectric state. (G) Population data of action potential probability, latency and latency jitter (σ latency), in the indicated cortical states. Values of action potential latencies recorded under fentanyl and pentobarbital were pooled for statistical purpose (fentanyl, n = 1 neuron; pentobarbital, n = 4 neurons). (H and I) Trial-to-trial variability of sensory-evoked dPSPs. (H) Seven intracellular synaptic responses induced by iterative whisker stimuli (grey boxes, 40 psi) applied under pentobarbital (Pento) and during the subsequent isoelectric period (Iso). Ten successive responses obtained in the same recording sessions are superimposed below the individual responses. (I) Population data showing the trial-to-trial variability of the prestimulus Vm (σdPSP foot) and dPSP amplitude (σdPSP amplitude) in the indicated states. *P < 0.05; **P < 0.01; ***P < 0.001; n.s. = non-significant. Grey lines indicate individual experiments and black lines connect the corresponding mean values (±SEM).
Neuronal correlates of isoelectric ECoG
EEG and ECoG recordings sample electrical activity, mainly of synaptic origin, occurring in the superficial layers of the cortex (Buzsáki et al., 2012). However, they do not provide information on the intrinsic electrophysiological features of neurons generating the cortical signals and are unable to probe cellular activities in deep brain structures. Thus, to investigate the cortical and subcortical neuronal mechanisms that underlie the continuous isoelectric state, we coupled ECoG (or local field potentials) and intracellular recordings from neocortex, thalamus and hippocampus during active brain states and after suppression of spontaneous activity.
Layer 5/6 S1 neurons, intracellularly recorded with KAc filled microelectrodes under control activity (fentanyl or pentobarbital) and after induction of isoelectric ECoG (n = 22 paired recordings) (Fig. 3A–C), had the typical morphology of pyramidal cells (Fig. 3A) and, consistent with their cellular typology, exhibited either regular spiking (n = 9 neurons) or intrinsic bursting (n = 13 neurons) firing pattern in response to suprathreshold current pulses (Supplementary Fig. 1A) (Steriade, 2004). Vm values of neocortical neurons recorded under fentanyl had a unimodal distribution (Fig. 3B, inset), with a mean of −63.5 ± 1.8 mV (n = 10 neurons) (Fig. 3D), and displayed low spontaneous fluctuations (σVm = 2.6 ± 0.2 mV, n = 10 neurons) (Fig. 3D) due to a barrage of synaptic events occurring in the alpha and low-gamma frequency range (Fig. 3B, bottom). This waking-like background synaptic activity was responsible for a sustained spontaneous firing (9.1 ± 3.5 Hz, n = 10 neurons) (Fig. 3B). In contrast, low control doses of pentobarbital caused oscillatory activity in neocortical cells, resulting in a more hyperpolarized mean Vm (−68.3 ± 1.1 mV, n = 12 neurons, P < 0.05), larger Vm fluctuations (σVm = 3.6 ± 0.3 mV, n = 12 neurons, P < 0.01) (Fig. 3D) and comparable firing rate (7.3 ± 2.7 Hz, n = 12 neurons, P > 0.8).
The pharmacological procedure used to suppress ECoG activity led to a progressive, and finally complete, disappearance of spontaneous synaptic potentials (fentanyl → isoelectric, σVm = 0.40 ± 0.02 mV, n = 10 neurons, P < 0.001; pentobarbital → isoelectric, σVm = 0.40 ± 0.03 mV, n = 12 neurons, P < 0.001) and firing activity in neocortical neurons (Fig. 3B and D). The loss of background synaptic drive also caused a significant hyperpolarization of cortical neurons (Vm fentanyl → isoelectric, −68.4 ± 1.8 mV, n = 10 neurons, P < 0.05; pentobarbital → isoelectric, Vm = −73.0 ± 1.3 mV, n = 12 neurons, P < 0.001) (Fig. 3B and D). Challenging previous experimental and theoretical findings (Bernander et al., 1991; Destexhe and Paré, 1999; Rudolph et al., 2005), suggesting that a high rate of synaptic activity increases the global membrane conductance of cortical neurons, the isoelectric intracellular profile, deprived of detectable synaptic events, was not associated with a significant change in Rm and τm (Fig. 3C and D) (Supplementary Table 2; see also Zou et al., 2005). This lack of change in the resting integrative properties of cortical neurons was also associated with an overall constancy of action potential properties (Supplementary Table 2). However, we found that the transfer function of neocortical cells (Supplementary material) was altered in the isoelectric condition. This was expressed as a significant increase in the minimal input current required to evoke an action potential, leading to a rightward shift in the F–I curves (Supplementary Fig. 1). This change in threshold current, mainly caused by the membrane hyperpolarization accompanying the silencing of cortical neurons (Altwegg-Boussac et al., 2014), was associated with a reduction of the F–I curve slope when the preceding control ECoG pattern was of waking-like type (Supplementary Fig. 1B).
The absence of spontaneous synaptic potentials in neocortical neurons during flat ECoG epochs is consistent with previous findings obtained during continuous isoelectric state (Kroeger and Amzica, 2007; Altwegg-Boussac et al., 2014, 2016) and inactive periods of the burst-suppression pattern (Steriade et al., 1994; Ferron et al., 2009). However, the pattern of spontaneous activity in subcortical structures remained uncertain since rhythmic neuronal activity has been previously described in the hippocampus (Kroeger et al., 2013) and diverse thalamic nuclei (Steriade et al., 1994) during ECoG suppression. Hence, we examined how the induction of a continuously flat ECoG affected the spontaneous activity and intrinsic excitability of hippocampal neurons (n = 4) and somatosensory thalamo-cortical cells (n = 7) (Fig. 4). Hippocampal neurons were identified by their morphology (Fig. 4B, inset) and characteristic firing behaviours during active cortical periods (Fig. 4A; Kowalski et al., 2016). Induction of isoelectric ECoG resulted in a complete abolition of firing activity in hippocampal neurons and a considerable reduction in Vm fluctuations (pentobarbital, σVm = 4.2 ± 0.4 mV, n = 3 neurons versus pentobarbital → isoelectric, σVm = 0.8 ± 0.1 mV, n = 4 neurons; P < 0.001) (Fig. 4A and B), which were accompanied by a significant membrane hyperpolarization (pentobarbital, Vm = −64.4 ± 2.4 mV, n = 3 neurons versus pentobarbital → isoelectric, Vm = −73.5 ± 2.2 mV, n = 4 neurons; P < 0.05) (Fig. 4A and B). As for neocortical neurons, Rm, τm and action potential properties were not affected by ECoG suppression (Fig. 4A, B and Supplementary Table 2), while the threshold current to elicit cell firing was significantly increased (Supplementary Table 2).
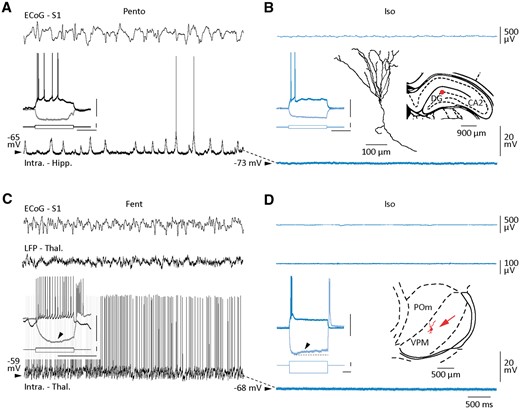
Intracellular correlates of isoelectric ECoG in subcortical structures. (A–D) Simultaneous recordings of S1 ECoG (top recordings) and corresponding intracellular activity from a dentate gyrus (A and B) and a thalamic (C and D) neuron, during active control period (A, pentobarbital; C, fentanyl) and after suppression of spontaneous cortical activity (B and D, isoelectric). Local field potentials (LFP - Thal) were also captured in the somatosensory thalamic nuclei (C, middle recording). The voltage responses of the two neurons to depolarizing and hyperpolarizing current pulses in control (black recordings) and during ECoG suppression (blue recordings) are shown in insets (scale bars = 30 mV, 1 nA, 100 ms). Note the hyperpolarization-activated depolarizing sag (arrowhead) in the thalamic neuron. A reconstruction of the somato-dendritic field of the neurobiotin-loaded dendate gyrus (DG) neuron and the location of the recorded neurons in the DG and in the ventroposteromedial (VPM) thalamic nucleus (B, red dot; D, red arrow) are also illustrated. POm = posteromedial thalamus.
Similar findings were obtained from thalamic neurons (fentanyl, n = 5; pentobarbital, n = 2) located in the ventroposteromedial (Fig. 4D, inset) and posteromedial nuclei, which are interconnected with S1 (Feldmeyer et al., 2013). These cells displayed the typical electrophysiological features of thalamo-cortical cells (Jahnsen and Llinàs, 1984), including a steady train of action potentials in response to suprathreshold current pulses and a rebound burst firing on termination of hyperpolarizing current pulses (Fig. 4C and D, inset). Their spontaneous tonic firing during control epochs (Fig. 4C), supported by small Vm variations (fentanyl + pentobarbital, σVm = 3.0 ± 0.9 mV, n = 7 neurons), was abolished at the establishment of the flat ECoG, leaving place to a silent intracellular activity without detectable synaptic events (fentanyl + pentobarbital → isoelectric, σVm = 0.5 ± 0.1 mV, n = 7 neurons, P < 0.01) (Fig. 4D). Consistently, the local thalamic local field potentials became also isoelectric (Fig. 4D), indicating the silencing of thalamic synaptic networks. As for neocortical and hippocampal neurons, the interruption of spontaneous activity caused a sustained hyperpolarization of thalamic cells (fentanyl + pentobarbital, Vm = −62.6 ± 2.2 mV versus fentanyl + pentobarbital → isoelectric, Vm = −69.7 ± 1.9 mV, n = 7 neurons; P < 0.05) (Fig. 4C and D). As a consequence of the de-inactivation of the low-threshold activated calcium current at hyperpolarized Vm (Cheong and Shin, 2013), depolarizing and hyperpolarizing current pulses applied during isoelectric state induced a direct or post-inhibitory burst discharge, respectively (Fig. 4D, inset), demonstrating that the voltage-gated membrane properties of thalamo-cortical neurons were preserved during ECoG suppression. Again, the threshold current generating firing was considerably augmented compared to control active periods, whereas the other electrophysiological parameters of thalamic cells remained unchanged (Supplementary Table 2). Our findings demonstrate that pentobarbital-induced suppression of ECoG spontaneous activity was not caused by, or responsible for, an extinction of the intrinsic excitability of central neurons, which retained their distinctive membrane properties, including voltage-gated behaviours.
Seeking synaptic inhibition
Barbiturate-derived compounds exert allosteric potentiating or direct agonistic action on GABAA channels depending on dose (Muroi et al. 2009). Thus, injection of high doses of pentobarbital could result in an overwhelming Cl−-dependent synaptic conductance in neuronal membrane, clamping the Vm at a potential close to the equilibrium potential of this anion (∼−65 mV). Such a process could be responsible for both the dampening of Vm and the silencing of neurons, finally leading to the interruption of network activity. To unveil a possible increase in inhibitory post-synaptic inputs during the isoelectric state, we manipulated the Vm of S1 neurons (n = 11 pyramidal cells) via intracellular injection of DC depolarizing (0.05 to 0.7 nA) or hyperpolarizing (−0.2 to −0.7 nA) current.
Neocortical cells recorded with KAc-filled electrodes exhibited, during control fentanyl sedation (Vm = −63.5 ± 1.5 mV, n = 6 neurons), transient spontaneous hyperpolarizations recurring at ∼1–6 Hz that closely resembled GABAA inhibitory postsynaptic potentials (IPSPs) (Fig. 5A, middle). As expected for IPSPs, DC depolarization (Vm depolarization = −57.4 ± 2.5 mV, n = 6 neurons) increased their amplitude (Fig. 5A, top), whereas DC hyperpolarization below reversal potential of Cl− (Vm hyperpolarization = −77.7 ± 2.2 mV, n = 6 neurons) resulted in the exclusive occurrence of depolarizing synaptic events (Fig. 5A, bottom). After induction of isoelectric ECoG (Fig. 5B, bottom), the steady hyperpolarized Vm (≤69.5 ± 1.2 mV, n = 11 neurons) was artificially displaced to reach a level of polarization (Vm = −60.4 ± 2.0 mV, up to −49 mV, n = 11 neurons) expected to unmask IPSPs. Regardless of the control condition (fentanyl, n = 6 neurons; pentobarbital, n = 5 neurons), no synaptic events could be detected (Fig. 5B, top). Consistently, DC hyperpolarization of the same neurons (Vm hyperpolarization = −78.7 ± 2.6 mV, n = 11 neurons) was unable to disclose depolarizing IPSPs.
To further explore a putative elevated Cl−-dependent synaptic conductance during the isoelectric state, we made intracellular recordings (n = 3 S1 neurons) with KCl-filled microelectrodes to increase the intracellular concentration of Cl−. This procedure, known to shift the reversal potential of Cl− in the positive direction, is expected to result in large depolarizing IPSPs when GABAA receptors are activated (Eccles, 1964; Chipaux et al., 2011). In control conditions, background intracellular activity in Cl−-loaded neurons was composed of a mixture of excitatory synaptic events and depolarizing IPSPs, leading to a slight, but not significant (P > 0.2), increase in the spontaneous firing rate (10.2 ± 2.3 Hz, n = 3 neurons) (Fig. 5C). As for recordings with KAc electrodes, the subsequent transition to isoelectric state led to a significant membrane hyperpolarization (Vm pentobarbital, −60.2 ± 2.4 mV versus pentobarbital → isoelectric, Vm = −64.2 ± 2.6 mV, n = 3 neurons, P < 0.05), arguing against an overwhelming inhibition clamping the neurons to the reversal potential of Cl−, and no depolarizing IPSPs were observed (Fig. 5D). This lack of activity was not caused by a defect in the cell excitability, as attested by the current-induced voltage and firing responses of Cl−-filled neurons (Fig. 5D, inset).
These converging results indicate that the silencing of neurons during continuous flatline ECoG is not due to an over synaptic inhibition of cortical neurons caused by the putative potentiation of GABAA conductance. Rather, it likely reflects a complete suppression of any spontaneous synaptic activity (see ‘Discussion’ section).
Somatosensory-evoked potentials in the isoelectric ECoG of the rat
Our recordings from comatose patients with flat EEG show that multimodal sensory stimuli are still able to produce scalp evoked potentials, which are delayed and amplified compared to awake healthy subjects. To test whether sensory events can be processed in the isoelectric rat brain, we used a sensory channel essential for tactile perception and discrimination in rodents, the vibrissae system (Fox, 2008). Square air-puff stimuli were thus repeatedly applied on whiskers during active brain states and after the establishment of a continuous isoelectric ECoG (Fig. 6A).
During control states, the averaged cortical responses displayed the typical complex waveform of whisker-evoked potential (Syed et al., 2011; Mahon et al., 2012; Chipaux et al., 2013), including a short latency (fentanyl, 20.9 ± 2.2 ms, n = 10 rats; pentobarbital, 22.8 ± 1.3 ms, n = 12 rats) negative component followed by two to three deflections with variable amplitude and polarity (Fig. 6B–E). The first component of the SEPs, which was significantly larger when recorded under light pentobarbital compared to fentanyl sedation (fentanyl, 35.5 ± 5.0 µV, n = 10 rats versus pentobarbital, 69.0 ± 7.7 µV, n = 12 rats; P < 0.01) (Fig. 6F), exhibited a high trial-to-trial variability (fentanyl, CV amplitude = 67.0 ± 6.4%, n = 10 rats; pentobarbital, CV amplitude = 56.0 ± 3.8%, n = 12 rats) (Fig. 6). This increase in amplitude observed under pentobarbital was associated with a slightly enhanced duration of the first component compared to fentanyl condition (fentanyl, 21.7 ± 6.3 ms, n = 10 rats versus pentobarbital, 29.8 ± 3.5 ms, n = 12 rats; P > 0.05).
Substantial changes in the latency, amplitude and shape of cortical responses were observed after induction of the isoelectric ECoG. As in humans, the latency of the evoked potentials (fentanyl → isoelectric, 31.0 ± 1.9 ms, n = 10 rats; pentobarbital → isoelectric, 31.2 ± 1.5 ms, n = 12 rats) was found to be increased by 48% and 37% compared to fentanyl and pentobarbital control states, respectively (P < 0.001 for each comparison) (Fig. 6D–F). Following the waking-like control state, this was accompanied by a 2-fold increase in the amplitude of the SEP’s first component (fentanyl → isoelectric, 70.5 ± 7.6 µV, n = 10 rats, P < 0.001), whereas an increase or a decrease could be observed when the isoelectric state was preceded by a sleep-like cortical pattern (amplitude unchanged on average; P = 0.4) (Fig. 6E and F). Because the first negative wave was appreciably enlarged in duration after ECoG suppression (fentanyl → isoelectric, 50.2 ± 9.5 ms, n = 10 rats; pentobarbital → isoelectric, 44.6 ± 4.7 ms, n = 12 rats; P < 0.05) (Fig. 6D and E), we measured its area under the curve to estimate the amount of synaptic activation in the local cortical network (Fig. 6D). Regardless of the pre-isoelectric state, the time-voltage area was significantly augmented after interruption of spontaneous ECoG activity (fentanyl, 0.4 ± 0.2 µV.ms versus fentanyl → isoelectric, 1.4 ± 0.2 µV.ms, n = 10 rats, P < 0.05; pentobarbital, 0.8 ± 0.1 µV.ms versus pentobarbital → isoelectric, 1.2 ± 0.2 µV.ms, n = 12 rats, P < 0.05), corresponding to an increase of 50% and 250% after pentobarbital and fentanyl control conditions, respectively (Fig. 6D–F). Consistent with our findings in patients, the global amplification of the cortical responses was associated with a 3- to 5-fold decrease in the trial-to-trial amplitude variability of the SEP’s first component (fentanyl → isoelectric, CV amplitude = 12.0 ± 1.6%, n = 10 rats, P < 0.001; pentobarbital → isoelectric, CV amplitude = 18.0 ± 1.9%, n = 12 rats, P < 0.001) (Fig. 6B–F).
Intracellular sensory responses during isoelectric state
We next examined the intracellular correlates of the sensory-evoked responses recorded at the surface of S1 after induction of the isoelectric state in rats. During active ECoGs, whisker deflections induced in S1 pyramidal neurons (n = 22) synaptic responses composed of an initial dPSP immediately followed by a hyperpolarizing waveform (Fig. 7A–D). In eight neurons (fentanyl, n = 4; pentobarbital, n = 4), we investigated the nature of the different synaptic currents underlying this mixed response by displacing the Vm using DC injection (Supplementary Fig. 2A and B). As previously described for sensory responses in S1 neurons (Wilent and Contreras, 2004), the reversal potentials (Erev), estimated at three different times after the onset of sensory stimuli, indicated an early combination of excitatory and inhibitory currents (Erev1 = −39.3 ± 4.7 mV, n = 8 neurons), a subsequent response likely Cl −-dependent (Erev2 = −58.0 ± 1.0 mV, n = 8 neurons) and a late synaptic component mediated by a potassium current (Erev3 = −79.9 ± 3.8 mV, n = 8 neurons) (Supplementary Fig. 2A and B).
Whisker stimulations applied during the isoelectric state could induce synaptic responses in all tested neocortical neurons (n = 22) (Fig. 7A–D), indicating that suppressing spontaneous ECoG activity did not prohibit the flow of sensory information in cortical networks. Intracellular responses had a similar temporal profile as in control conditions, i.e. an initial depolarization followed by a prolonged hyperpolarization (Fig. 7B and D). Measuring the amplitude of the sensory response during flatline ECoG at different Vm levels (Supplementary Fig. 2C) revealed that Erevvalues of the first (Erev1 = −42.3 ± 3.6 mV, n = 3 neurons), second (Erev2 = −58.6 ± 3.6 mV, n = 3 neurons) and third (Erev3 = −81.6 ± 2.2 mV, n = 3 neurons) synaptic components were similar to those measured in control (P > 0.7) (Supplementary Fig. 2C). This strongly suggests that intracellular responses in the isoelectric state resulted from an analogous sequence of synaptic events and were likely underpinned by the same synaptic currents. However, intracellular sensory responses displayed a number of changes consistent with those observed at the network level in the corresponding SEPs. The peak latency of the early dPSPs was strongly delayed compared to control conditions (fentanyl, 22.1 ± 2.2 ms versus fentanyl → isoelectric, 31.3 ± 2.2 ms, n = 9 neurons, P < 0.001; pentobarbital, 25.7 ± 1.9 ms versus pentobarbital → isoelectric, 31.7 ± 1.7 ms, n = 10 neurons, P < 0.05) (Fig. 7B, D and E). The duration of sensory responses was increased (Fig. 7B and D), as well as their amplitude when the pre-isoelectric cortical state was of waking-like type (fentanyl, 3.9 ± 1.0 mV versus fentanyl → isoelectric, 6.0 ± 0.9 mV, n = 9 neurons, P < 0.05) (Fig. 7B and E). The rising slope of evoked synaptic potentials was on average not affected by the induction of isoelectric ECoG (Fig. 7B, D and E), further indicating that the sensory responses generated in pyramidal neurons during the isoelectric state likely resulted from the activation of the same presynaptic afferents (Eccles, 1964).
Sensory synaptic responses thus persisted in cortical neurons after induction of isoelectric state but their efficacy to trigger cell firing was significantly reduced. First, the proportion of neurons eliciting suprathreshold responses dropped from 73% in control conditions (16 of 22 neurons) to 27% after ECoG suppression (6 of 22 neurons). Second, the firing probability in individual neurons was also remarkably reduced (fentanyl, 0.46 ± 0.11 versus fentanyl → isoelectric, 0.01 ± 0.01, n = 7 neurons, P < 0.001; pentobarbital, 0.60 ± 0.13 versus pentobarbaital → isoelectric, 0.20 ± 0.10, n = 9 neurons, P < 0.01) (Fig. 7G). Finally, consistent with the delay of the dPSPs peak, the latency of action potential discharge was increased compared to control periods (pentobarbital + fentanyl, 21.2 ± 1.5 ms, n = 5 neurons versus isoelectric, 27.5 ± 2.2 ms, n = 5 neurons, P < 0.05) (Fig. 7F and G). The attenuated sensory-evoked activation of cortical neurons during the silent state was not due to changes in the action potential voltage threshold that remained stable after ECoG suppression (Fig. 7F) (Supplementary Table 2).
Suppression of ongoing cerebral activity also resulted in a considerable increase in the regularity of neuronal responses to repeated sensory stimuli of same intensity. The amplitude variability of control sensory responses (fentanyl, CV dPSP amplitude = 38.0 ± 3.0%, n = 9 neurons; pentobarbital, CV dPSP amplitude = 42.8 ± 3.3%, n = 10 neurons) was found noticeably reduced during the subsequent flat ECoG periods (fentanyl → isoelectric, CV dPSP amplitude = 21.5 ± 2.9%, n = 9 neurons, P < 0.01; pentobarbital → isoelectric, CV dPSP amplitude = 24.0 ± 2.6 mV, n = 10 neurons, P < 0.01) (Fig. 7H and I). As expected from the disappearance of background synaptic activity, this was correlated with a strong decrease in the variability of the prestimulus Vm (σ dPSP foot fentanyl, 2.10 ± 0.19 mV versus σ dPSP foot fentanyl → isoelectric, 0.52 ± 0.04 mV, n = 9 neurons, P < 0.001; σ dPSP foot pentobarbital, 2.90 ± 0.25 mV versus σ dPSP foot pentobarbital → isoelectric, 0.53 ± 0.03 mV, n = 10 neurons, P < 0.001) (Fig. 7H and I). Finally, the augmented stability of synaptic responses was also associated with an enhanced temporal precision of the evoked discharge in responsive neurons, as indicated by the decreased standard deviation of action potential latencies (σ latency pentobarbital + fentanyl, 1.6 ± 0.3 ms, n = 5 neurons versus σ action potential latency isoelectric, 0.8 ± 0.2 ms, n = 5 neurons, P < 0.01) (Fig. 7G).
These findings demonstrate that S1 pyramidal neurons still process sensory inputs during continuous isoelectric state and retain their capacity to propagate sensory information to distant cortical or subcortical areas. However, the integrated information seems affected by a reduced activation of individual neurons, a delayed latency of sensory responses and an increase in their time-to-time reliability.
Discussion
Unexpected neurophysiological status for continuous isoelectric EEG
Although the neurophysiological status underlying continuous isoelectric EEG has been poorly explored, it is commonly assumed that neuronal activity and functions are completely abolished during this brain state. This assumption was recently supported by a series of electrophysiological investigations in the isoflurane-anaesthetized cat where relatively weak stimuli, such as micromechanical stimulations (Kroeger and Amzica, 2007), remained ineffective in inducing cortical responses during a state of continuous isoelectric EEG. This lack of responsiveness was attributed to a slight increase in extracellular K+ concentration causing an impairment of the overall cell excitability (Kocsis et al., 1983; Kroeger and Amzica, 2007; Ferron et al., 2009). From a clinical point of view, this apparent defect in neuronal function is in accordance with the classification of persistent electro-cerebral silence as the most severe grade of coma (Synek, 1988; Lehembre et al., 2012), which is even considered, together with a lack of responsiveness to various stimuli, as the ultimate electrical sign of cerebral death (Laureys et al., 2004).
In the case of isoelectric EEG induced by barbiturate-derived drugs, it is expected that the collapse of neuronal activity and functions is achieved through an enhancement and/or prolongation of GABAA synaptic transmission, resulting in an overwhelming Cl−-dependent inhibition of neurons (Nicoll et al., 1975; Pocock and Richards, 1993; Richards, 2002). Challenging this view, our findings demonstrate that barbiturate-induced continuous isoelectric EEG reflects a quiescent—rather than over inhibited—brain state preserving the intrinsic excitability of neurons and their capacity to respond to direct and sensory stimulations. Confirming and extending our previous findings (Altwegg-Boussac et al., 2014), persistent isoelectric ECoG was systematically correlated with a hyperpolarized Vm in central neurons (at least in neocortical, hippocampal and thalamic cells) due to the complete disappearance of ongoing synaptic activity (Paré et al., 1998; Kroeger and Amzica, 2007; Altwegg-Boussac et al., 2014). This silencing of cortical and subcortical neurons contrasts with the large amplitude sharp EEG waves (Nu-complexes) observed in hippocampal and cortical local field potentials following prolonged periods of electro-cerebral inactivity induced by isoflurane (Kroeger et al., 2013) and with the bursting activity recorded in a limited population of thalamo-cortical neurons during the silent phases of the burst-suppression pattern in cats (Steriade et al., 1994). Further investigations will be required to determine if this discrepancy is drug-dependent or reflects species-specific brain mechanisms. Our results also demonstrate that the absence of spontaneous activity in central neurons was not accompanied by a suspension of their intrinsic excitability. All the neurons tested during continuous flatline-ECoG could fire action potentials in response to direct stimulations and their distinctive electrical properties, including specific endogenous firing patterns and intrinsic rebound properties, were retained. However, we found a consistently reduced cell excitability, mainly due to the membrane hyperpolarization (Sanchez-Vives et al., 2000; Graham and Schramm, 2009; Silver, 2010; Altwegg-Boussac et al., 2014), which was mainly expressed as a subtractive effect on the neuronal input–output relation. This indicates that the ease with which an action potential can be elicited by a given input is decreased and that neurons experiencing an isoelectric state require stronger stimulations to be activated.
The silencing of neurons and their reduced membrane excitability during ECoG suppression was not due to the presumed potentiating effect of barbiturate on GABAergic synaptic conductance. Indeed, artificial displacements of the isoelectric Vm in neocortical neurons were unable to unmask IPSPs and intracellular loading of neurons with Cl− was ineffective for eliciting depolarizing IPSPs, demonstrating an absence of massive Cl−-dependent synaptic conductance. The suspension of both inhibitory and excitatory synaptic drive would lead, in theory, to an increase in Rm, due to a global decrease in membrane conductance (Destexhe et al., 2003). Here, the stability of Rm after suppression of ECoG activity could result from a compensatory effect of pentobarbital-induced increase in voltage-gated potassium conductance (Wan et al., 2003), which may also participate to the membrane hyperpolarization and the reduced intrinsic excitability of neurons (O’Beirne et al., 1987).
As a diachronic scenario for establishing and maintaining barbiturate-induced continuous isoelectric brain state, we propose an initial and moderate increase in GABAergic synaptic transmission in the cortex and thalamus during the preceding burst-suppression pattern, as attested by the large and rhythmic spontaneous IPSPs in both structures during this transitory phase (data not shown). This is followed by a further enhancement in synaptic inhibition, together with a barbiturate-induced reduction in glutamatergic synaptic function (Lukatch and MacIver, 1996; Richards, 2002), and a possible increase in non-synaptic potassium conductance, making silent virtually all central neurons, including excitatory and inhibitory cells, while preserving their intrinsic excitability. As a consequence, the endogenous synaptic drive in central networks becomes continuously interrupted leading to an isoelectric neuronal Vm approximating the resting state and finally, based on the dipole theory of cortical electrogenesis (Lopes da Silva, 2010), to a flatline EEG.
Sensory-evoked responses from the isolectric brain
A key result of this study was the possibility to induce, in human patients and in our experimental model, multimodal sensory responses from a spontaneously inactive cortex. This finding demonstrates by itself that the peripheral sensory system remained functional and that the brainstem-thalamo-cortical pathway was still able to integrate and propagate sensory inputs. This is consistent with the persistence of neuronal excitability in both sensory relay thalamus and primary sensory cortices, and with the sensory-evoked synaptic responses in individual cortical neurons. Although the ionic origin of sensory-induced synaptic potentials in the rat cortical neurons remained unchanged after induction of the isoelectric state (Supplementary Fig. 2), the evoked responses displayed a number of changes in the two species after suspension of spontaneous electrical brain activity.
First, the latency of evoked-potentials was systematically increased compared to active brain states. This has been previously observed following somatosensory stimulations in patients with isoelectric EEG induced by thiopental or cardiac arrest (Ganes and Lundar, 1983) and in response to multimodal sensory stimuli in deeply-anaesthetized cats (Sutton et al., 1982). The delay of sensory-evoked potentials in the present study is consistent with the increased latency of synaptic and firing responses in cortical pyramidal neurons, which may result from the neuronal hyperpolarization and the disappearance of background network activity known to facilitate the sensory-induced responses and reduce their latency (Aertsen and Preissl, 1991; Azouz and Gray, 1999). Since barbiturate-derived drugs did not prevent or slow down the invasion of axonal branches by action potentials (Baudoux et al., 2003), the lateness of cortical responses in the isoelectric brain is likely due to the accumulation of temporal delays at each neuronal relay within the sensory pathway deprived of spontaneous activity (Wall, 1967).
Second, the cortical sensory responses were augmented in magnitude and/or duration. In previous reports, cortical evoked potentials are often found to be attenuated, or even suppressed, in the isoelectric human brain (Trojaborg and Jorgensen, 1973; Ganes and Lundar, 1983). Nevertheless, overly large responses can be triggered by mild sensory stimuli in patients perfused with high doses of barbiturate derivative drugs to treat a refractory status epilepticus (Jäntti et al., 1994; Baxter et al., 2003; Dan and Boyd, 2006). As suggested in the aforementioned studies, the exacerbated cortical responses we described could be due to the pathological propensity of the patients’ brain to generate paroxysmal activity, which could secondarily amplify the sensory-evoked potentials. However, enlarged responses were also observed in non-epileptic rats (present study) and in patients suffering from post-anoxic coma (Van Cott et al., 1996; Morris et al., 1998), demonstrating the lack of specificity between the increased cortical responses, the use of barbiturate-derived drugs and the underlying brain disorder. Three alternative and synergistic mechanisms can be mentioned. The sustained hyperpolarization of thalamo-cortical neurons, resulting in a de-inactivation of the low-threshold calcium current (Cheong and Shin, 2013), could promote burst firing in response to excitatory inputs (Fig. 4D; Rosanova and Timofeev, 2005; Urbain et al., 2015), leading to intensified synaptic inputs onto cortical cells. The increased driving force of sensory-evoked synaptic currents due to the polarization of cortical neurons could further enhance the amplitude of sensory responses. Moreover, the high temporal fidelity in firing responses may favour the synchrony between synaptically-connected neurons in thalamo-cortical networks, a process prone to amplify surface cortical signals.
Finally, the sensory-evoked responses in the human and rat isoelectric brain exhibited a high trial-to-trial stability in amplitude, shape and latency, which was retained at the three levels of the integration process, including surface evoked-potentials, sensory-induced dPSPs in individual neuron and cell firing. Again, this could be explained by the disappearance of the fluctuating background synaptic activity, known to introduce an extreme time-to-time instability in neuronal firing rate and pattern evoked during repetitive stimulations (Burns, 1968; McCormick et al., 2003; Altwegg-Boussac et al., 2014, 2016).
Is EEG a reliable marker of brain functions?
Continuous flatline EEG is generally considered as a clinical marker of the most critical cerebral states, associated with a complete dissolution of consciousness and an inability to process external inputs. Our results demonstrate that, during such an electro-cerebral inactivity, central neurons conserve nearly unchanged intrinsic properties and remain potent for integrating and propagating sensory information. The functional state of neurons and brain networks during uninterrupted isoelectric EEG is nonetheless likely to depend on the underlying aetiology in a complex manner. Indeed, deep hypothermia, which is associated with a considerable reduction in EEG activity, induces opposite effects on early and late components of SEPs (Stecker et al., 2001; Wu et al., 2012), whereas it substantially reduces the intrinsic excitability and synaptic responses of cortical neurons in vitro (Aihara and Okada, 2001).
The barbiturate-induced isoelectric brain resembles a dormant brain, in which the cerebral functions are kept at the lowest levels of awareness and wakefulness (Laureys, 2004; Di Perri et al., 2014). The cessation of endogenously-generated synaptic activity suspends the functional properties of neurons and networks, which, however, remain potentially reactivable. The discrepancy we described, between the abolishment of all brain electrical activity and the actual functional capabilities of central neurons and sensory networks, is in line with the lack of current EEG markers to accurately, and consistently, correlate brain activity and function (Boly et al., 2013). Further evidence of such dissociation has been reported in humans during propofol anaesthesia, where an increase in the EEG gamma power is associated with a decreased level of consciousness (Murphy et al., 2011).
Our study emphasizes that a more refined investigation of neural activity and functions is required to complement EEG examination in order to reliably assess the genuine neurophysiological status underlying different altered states of consciousness, including isoelectric comas with specific aetiologies.
Abbreviations
- AEP
auditory-evoked potential
- dPSP
depolarizing postsynaptic potential
- ECoG
electrocorticogram
- IPSP
inhibitory postsynaptic potential
- SEP
somatosensory-evoked potential
- VEP
visually-evoked potential
Acknowledgements
The authors thank all the technical staff from the Histomics platform, and Sonya Asset for her availability and help with EEG recordings in human patients.
Funding
This work was supported by grants from the ‘Investissements d’avenir’ ANR-10-IAIHU-06, the Institut National de la Santé et de la Recherche Médicale (INSERM), and the Université Pierre et Marie Curie (UPMC).
Supplementary material
Supplementary material is available at Brain online.
References
Author notes
*These authors contributed equally to this work.

