


Abstract
Platelet-derived growth factor receptor alpha (PDGFRα) and c-Kit are receptor tyrosine kinases. Both are targets of the tyrosine kinase inhibitor imatinib mesylate which is approved for treatment of some cancers. In order to assess the role of PDGFRα and c-Kit in malignant peripheral nerve sheath tumours (MPNST) we examined human tumours for structural alterations, protein and ligand expression. We investigated 34 MPNST, 6 corresponding plexiform neurofibromas (pNF) and 1 MPNST cell culture from 31 patients for mutations and polymorphisms in PDGFRA (exon 2–21) and KIT (exon 9, 11, 13, 17). PDGFRA was amplified in seven tumours from six patients and MPNST cell culture S462. KIT was amplified in five tumours from four patients and in the cell culture. Two MPNST carried somatic PDGFRA mutations in exons coding for the extracellular domain. In addition we detected several polymorphisms in PDGFRA . No point mutations or polymorphisms were detected in the four KIT exons analysed. PDGFRα expression was present in 21 of 28 MPNST patients (75%) and the MPNST cell culture. Expression analysis of PDGFRα ligands in MPNST and neurofibromas revealed that PDGF-A was more widely expressed than PDGF-B. Focal c-Kit expression was detected in 2 of 29 (7%) MPNST patients. Imatinib treatment of MPNST cell culture S462 exerted a growth inhibitory effect and prevented PDGF-AA induced PDGFRα phosphorylation. In summary, PDGFRA , PDGF and KIT dysregulation as well as growth inhibition of cell culture S462 by imatinib may suggest that MPNST patients benefit from treatment with imatinib.
Introduction
Malignant peripheral nerve sheath tumours (MPNST) are very aggressive tumours with poor prognosis. Approximately half of the MPNST occur in the setting of Neurofibromatosis type 1 (NF1), a hereditary tumour syndrome with an incidence of 1:3500 ( 1 ). MPNST in NF1 patients is the major cause for reduced life expectancy with only 21% of NF1 patients surviving longer than 5 years after diagnosis of MPNST ( 2 ).
The NF1 gene on chromosome 17q11.2 encodes the large protein neurofibromin, which acts as negative regulator of ras. Functional neurofibromin is lost in NF1 associated nerve sheath tumours. However, not much is known about additional molecular aberrations underlying transformation or malignant progression of nerve sheath tumours. However, TP53 and CDKN2A have been shown to harbour mutations in a subgroup of MPNST ( 3 – 5 ). In addition, gene amplification and increased transcription of EGFR have been detected in MPNST ( 6 , 7 ). MPNST in NF1 patients frequently arise from malignant progression of plexiform neurofibromas (pNF). Dermal neurofibromas (dNF), which develop in nearly all NF1 patients, virtually have no risk of malignant transformation. With the exception of NF1 loss, little is known about genetic aberrations in neurofibromas.
We have recently demonstrated higher expression of platelet-derived growth factor receptor alpha (PDGFRα) in MPNST than in benign nerve sheath tumours ( 8 ). Because ligands of PDGFRα are powerful mitogens for Schwann cells ( 9 ), the PDGF system might contribute to malignant progression of nerve sheath tumours. The PDGF system is complex with two receptor genes forming three receptor types (PDGFRα and PDGFRβ homodimers and PDGFRαβ heterodimers). These receptors may bind ligands encoded by four genes building at least five different dimers (PDGF-AA, PDGF-AB, PDGF-BB, PDGF-CC and PDGF-DD) with different receptor-binding specificities ( 10 ). Expression of c-Kit and its ligand stem cell factor was found in MPNST cell cultures ( 11 , 12 ) and c-Kit expression was documented in an MPNST ( 13 ).
PDGFRα and c-Kit belong to the type III subfamily of receptor tyrosine kinases. Both have been reported to be strongly expressed and/or mutated in gastrointestinal stromal tumours (GIST) and gliomas ( 14 , 15 ).
PDGFRA and KIT have attracted special attention since it became evident that their protein products were among the tyrosine kinases inhibited by imatinib mesylate (Glivec®, STI571). Imatinib treatment yields high response rates in patients with GIST and chronic myeloid leukemia (CML) ( 16 , 17 ). The major target of imatinib in GIST is mutant c-Kit, whereas the inhibited kinase in CML is the Bcr–Abl fusion protein. Successful treatment with imatinib has also been reported for patients with dermatofibrosarcoma protuberans. This disease is characterized by a chromosomal translocation leading to overexpression of PDGF-B, which is bound by all 3 PDGF receptor types ( 18 ).
Our previous findings of increased PDGFRα levels in MPNST led us to examine MPNST for activating mutations or amplifications. Activation of PDGFRα and c-Kit would render MPNST attractive candidates for imatinib treatment. Since there are only limited treatment options for MPNST patients new treatment possibilities are required.
Materials and methods
Tumour tissue, DNA and RNA extraction
Tumour samples were collected from University Hospital Eppendorf (Hamburg, Germany), Robert-Rössle-Hospital (Berlin, Germany), Otto-von-Guericke-University (Magdeburg, Germany) and Charité University Hospital (Berlin, Germany). The study contained 40 nerve sheath tumours (34 MPNST and 6 pNF) from 31 patients and MPNST cell culture S462, which was established from MPNST 24472 ( 19 ). Twenty-six patients were diagnosed with NF1. Following initial diagnosis in local neuropathologies, all tumour samples were reviewed by the same pathologist (A.F.O.). Histopathological examination was based on the modified FNCLCC system ( 20 ). Eleven tumour samples have already been analysed for gene expression profiles ( 6 ). Before extraction of DNA, RNA and protein tumour samples were examined by histology to exclude contaminating non-tumourous portions. In case of frozen material DNA and RNA was extracted using TRIzol reagent from Invitrogen (Karlsruhe, Germany). DNA extraction from paraffin embedded material was carried out according to the QIAamp DNA Mini Kit protocol (Qiagen, Hilden, Germany). Four MPNST (24626, 24772, 24776 and 24324) contained adjacent pNF tissue. DNA from pNF and MPNST areas were separately extracted. A c-Kit positive GIST was kindly provided by Prof. Gottschalk (Hamburg) and served as positive control for immunohistochemistry. Microdissection of skeletal muscle and vascular endothelial cells was performed with two cases (24748 and 24772) because blood was not available. The PALM Laser Microbeam System (Bernried, Germany) was employed to dissect ∼2000 cells from paraffin sections stained with toluidine blue as described previously ( 21 ). The investigations were carried out with the informed consent of the patients.
SSCP and sequencing
Electrophoresis of PCR products of PDGFRA exon 2–21 and KIT exon 9, 11, 13, 17 was performed on polyacrylamid gels applying 500 V and 6 mA for 18 h. All PCR products showing a mobility shift were confirmed by an independent PCR and compared with PCR products of corresponding normal tissue (blood or microdissected normal cells). Aberrantly migrating SSCP bands were excised and the DNA was extracted. After reamplification, PCR products were sequenced bidirectionally on a semiautomated sequencer (model 377; Applied Biosystems, Foster City, CA). Sequences were compared to PDGFRA NM_006206 and KIT X06182. Primer sequences are compiled in Table I . Amplification and gel conditions are available on request.
Primer sequences and product size
| Forward | Reverse | Product size in bp | ||||
|---|---|---|---|---|---|---|
| DNA primer | ||||||
| KIT exon 9a | TTTCCTAGAGTAAGCCAGGGC | GTTGTAAGCCTTACATTCAACCG | 180 | |||
| KIT exon 9b | AGTGCATTCAAGCACAATGG | GACAGAGCCTAAACATCCCC | 146 | |||
| KIT exon 11 | CTATTTTTCCCTTTCTCCCC | TACCCAAAAAGGTGACATGG | 193 | |||
| KIT exon 13 | TTTGCCAGTTGTGCTTTTTG | CAGCTTGGACACGGCTTTAC | 176 | |||
| KIT exon 17 | TGGTTTTCTTTTCTCCTCCAA | TGCAGGACTGTCAAGCAGAG | 185 | |||
| PDGFRA exon 2 | TCCAGGGTTGTTTCTATTTGC | GACACCCAAACAAGGAACTCA | 157 | |||
| PDGFRA exon 3/1 | CCTATTCAGAGCGTGCTTCC | AGGCCGCTGTTGTTTTCTT | 218 | |||
| PDGFRA exon 3/2 | GGGGAGAGTGAAGTGAGCTG | CCAACTCACCTGGCACATAG | 226 | |||
| PDGFRA exon 4/1 | TCTGGATTTATGTGTAAAGGTGAAA | TCCCATTAAAGCCCTGTCTG | 239 | |||
| PDGFRA exon 4/2 | TCCCGAGACTCCTGTAACCTT | CACGCACCTTATGATTTTGC | 229 | |||
| PDGFRA exon 5 | TGTGGATTTTTAGGCCCTTG | CATTGCACGTTTTGAGGGTA | 195 | |||
| PDGFRA exon 6 | GGTTTTCTTCCCCTTTTGCT | GCAGCATGGACAACTGACAT | 235 | |||
| PDGFRA exon 7 | CTCGGGATCCATATGTGGTAA | CGCCTCTGATGCACACTAAA | 295 | |||
| PDGFRA exon 8 | TGCTTGTTGAAACAAAATCCTTT | CACTCATCTACAGAGCTAGCATTATC | 194 | |||
| PDGFRA exon 9 | TCTGGGACACGAGCTATTCC | CTGACCACGAAAGAAGAAGACA | 212 | |||
| PDGFRA exon 10 | GGCCCTATACTTAGGCCCTTT | TCCTGACTGTTGAGGAACTCAC | 247 | |||
| PDGFRA exon 11 | GCATGTCTGCCAGGAAACTT | TGCTTGTTCTCATTGGCTTC | 197 | |||
| PDGFRA exon 12 | TCCAGTCACTGTGCTGCTTC | GCAAGGGAAAAGGGAGTCTT | 261 | |||
| PDGFRA exon 13 | CGTCTGGAGTTTTTGGGTGT | CCCCAGGAAGGAGCACTTAC | 167 | |||
| PDGFRA exon 14 | GCTCAGCTGGACTGATATGTGA | CCAGTGAAAATCCTCACTCCA | 185 | |||
| PDGFRA exon 15 | ACCCATCTCCTAACGGCTTT | CAGCAACATCTCTCTTTGCAC | 210 | |||
| PDGFRA exon 16 | GGCACCCTGGGTAAGATTTC | CACTGGAAAGTCCCAACACC | 248 | |||
| PDGFRA exon 17 | CCTGCCAGCACCAATACAT | GGGTCTAAAAAGGTCTGTGTTCC | 186 | |||
| PDGFRA exon 18 | ACCATGGATCAGCCAGTCTT | TGAAGGAGGATGAGCCTGACC | 252 | |||
| PDGFRA exon 19 | AACTGTCTCCCTCCTTCCTTG | GCCCAAATAAGCAGCAATGT | 167 | |||
| PDGFRA exon 20 | TGGTGTTTTATTGTTTGGCTTTT | CCCCCTAGACCCACAGACT | 180 | |||
| PDGFRA exon 21 | TCTTGAGTTCTGTCCCCACA | CACCCACAGATCCAAACACA | 148 | |||
| Desmin exon 8 | ACTCCCAGCCCCTGGTATAG | AGGGTAAGGAGCCCAGACAG | 180 | |||
| cDNA primer | ||||||
| PDGFRA fragment 1 | GACTTCCCATCCGGCGTTC | TTGACCTCCCTGGTAGCCT | 894 | |||
| PDGFRA fragment 2 | TGGAGATTACGAATGTGCTG | CCAAGCACTAGTCCATCTCT | 933 | |||
| PDGFRA fragment 3 | CTTATGACTCAAGATGGGAG | CAGACATCACTCAGTGTGGT | 954 | |||
| PDGFRA fragment 4 | CTCCTGAGAGCATCTTTGAC | AAGTGGAAGGAACCCCTCGA | 712 | |||
| PDGFA | ACACGAGCAGTGTCAAGTGC | GGCTCATCCTCACCTCACAT | 200 | |||
| PDGFB | GGCATGCAAGTGTGAGACAG | GTCTTGTCATGCGTGTGCTT | 171 | |||
| RPS3 | CTGGGCATCAAGGTGAAGAT | AGACCCTGTTATGCTGTGGG | 205 | |||
Gene amplification analysis by real-time PCR
Quantitative real-time PCR was performed with SYBR green I (1:5000 dilution, Molecular Probes, The Netherlands) using the ABI Prism 7700 Sequence Detection System (Applied Biosystems). PCR products of the target genes KIT (Exon 17, PCR product of 185 bp) and PDGFRA (Exon 21, PCR product of 148 bp) were compared to the reference gene DES (Exon 8, PCR product of 180 bp) on chromosome 2q35 encoding desmin. This region appears not to have gains of chromosomal material in MPNST ( 22 ). Primer sequences are given in Table I . PCR efficiency, determined by serial dilution of DNA, demonstrated similar results for target and reference genes. All samples were analysed in duplicate in 25 µl reaction mixes containing 1.25 U of Platinum Taq DNA Polymerase (Invitrogen). Amplification conditions are available on request. Evaluation of data were performed using the ΔΔCt method: ΔΔCt = ΔCt tumour DNA − ΔCt blood DNA. ΔCt (threshold cycles) is the Ct of the reference gene minus the Ct of the target gene. Fold increase of the target genes ( PDGFRA and KIT ) was calculated by 2 (ΔΔCt) and values of ≥1.7 were defined as gene amplification. Tumours conspicuous for gene amplification were verified in an independent PCR run. DNAs from glioblastomas with known PDGFRA amplification served as positive controls ( 15 ).
RT–PCR analysis
RT of 2 µg DNA free RNA was achieved with the SuperScript™ First-Strand Synthesis System (Invitrogen). PCR were performed in a volume of 20 µl containing cDNA transcripts equivalent to 45 ng RNA. For the detection of large deletions in PDGFRA 10 MPNST (21852, 24784, 26580, 26582, 26584, 26586, 26588, 26592, 24472, 21914) and the cell culture S462 were analysed using four overlapping primer pairs covering the whole coding region of PDGFRA . Primer sequences are given in Table I . PCR fragments were separated on 1.5% agarose gels allowing size differences of 50 bp to be visualized. For semi-quantitative ligand determination 35 PCR cycles were performed for PDGFA and PDGFB , and 32 cycles were performed for the reference gene RPS3 . Amplification conditions are available on request.
Immunohistochemistry and scoring
Immunohistochemistry was performed with a Ventana Benchmark™ automate (Ventana, Strasbourg, France). The antibodies against PDGFRα (C-20, dilution 1:100) and PDGF-A (N-30, dilution 1:50) were obtained from Santa Cruz Biotechnology (Heidelberg, Germany). The c-Kit antibody (A4502, dilution 1:400) was obtained from Dako (Hamburg, Germany). Antigen retrieval was enhanced by heating. Primary antibodies were incubated for 30 min at 40°C. Negative controls without primary antibodies were carried out and did not produce signals. Scoring was performed according to the percentage of positive cells: <5% was classified as negative (−), 6–100% was classified as positive. Positive cells (6–30%) were scored with +, 31–60% with ++, >60% with +++. A repeated test (blinded) gave similar results.
Immunocytochemistry
MPNST cells (2 × 10 4 ) per well were seeded on Permanox chamberslides (Nunc, Wiesbaden, Germany). Cells were fixed with acetone the following day. The same antibodies used for immunohistochemistry were applied in a 1:50 dilution. Incubation of primary antibodies was performed for 2 h at room temperature. Visualization was performed with Cy3- (Dianova, Hamburg, Germany) or Alexa488- (Invitrogen) conjugated anti-rabbit antibodies (dilution 1:100). Negative controls without primary antibodies were carried out and did not produce signals.
Western blot
Tumour lysates were heat denaturated and loaded on to 7.5% acrylamide gels for subsequent protein separation. After transfer of proteins to nitrocellulose membranes, the membranes were blocked in 3% non-fat dry milk with 0.05% Tween-TBS for 1 h and incubated overnight at 4°C with anti-PDGFRα antibody (C-20, dilution 1:200). After washing, the membranes were incubated for 1 h with biotin-conjugated second antibodies, washed and incubated 1 h with ExtrAvidin from Sigma (dilution 1:2000). Visualization was performed with ECL (Amersham Biosciences, Freiburg, Germany). Lysates were adjusted to β-actin expression levels which were determined with the anti-β-actin antibody AC-15 (dilution 1:6.000) from Sigma (Munich, Germany). Phosphorylation was detected with anti-p-Tyr (PY99, dilution 1:10.000) from Santa Cruz Biotechnology.
Cell culture assays
During imatinib inhibition the MPNST cell culture S462 (<18 passages) was maintained in DMEM Glutamax-I with 5% FBS from Invitrogen (Karlsruhe, Germany). Imatinib mesylate was kindly provided by Novartis Pharma AG (Basel, Switzerland) and dissolved in dimethyl sulphoxide (DMSO). Cells (2 × 10 3 ) were seeded in 300 µl medium into 24 well plates and were allowed to adhere. Imatinib was added in 100 µl to final concentrations of 2 µM and 10 µM with no more than 0.1% DMSO. Negative controls contained 0.1% DMSO only. The 300 µl of medium containing respective imatinib or DMSO concentrations were exchanged on day 3 and 5. Cell proliferation was evaluated on day 4 and 7 post-imatinib treatment with the CellTiter 96 AQueous One Solution Cell Proliferation Assay from Promega (Mannheim, Germany) by measurement of absorbance at 490 nm. The experiments were performed in duplicate and repeated thrice with comparable results.
Imatinib effect on PDGFRα phosphorylation was determined in 6 well plates in duplicates. Cells (5 × 10 5 ) were seeded per well in DMEM with 10% FBS. The next day medium was changed to serum-free DMEM. After 24 h imatinib or DMSO was added and cells were incubated for 30 min. Cells were then stimulated with PDGF-AA (50 ng/ml) for 10 min, washed with phosphate-buffered saline (PBS), scraped, centrifuged and resuspended in lysis buffer [1% Triton X-100, 100 mM NaCl, 50 mM Tris–HCl (pH 7.5) and 5 mM EDTA]. Protease inhibitor cocktail (Roche, Penzberg, Germany) and phosphatase inhibitor cocktail 2 (Sigma, Saint Louis, Missouri) were added.
Stimulation with PDGF-AA and PDGF-BB (Oncogene, San Diego, CA) was performed in 6 well plates with 50 ng PDGF per ml serum-free DMEM for 48 h. Each well contained 10 5 cells seeded in DMEM with 10% FBS. The next day medium was switched to serum-free DMEM. Cell line ST88-14 and DBTRG (kindly provided by A. Kurtz and E. Elstner) were cultured in DMEM Glutamax-I with 10% FBS.
Results
Mutations and polymorphisms
We investigated 34 MPNST, 6 pNF and 1 MPNST cell culture from 31 patients for PDGFRA mutations (exon 2–21) and KIT mutations (exon 9, 11, 13, 17). Because KIT mutations in GIST mostly occur in exon 9 and 11 but also in exon 13 and 17 we restricted our analysis to these four exons ( 23 ). We detected somatic PDGFRA mutations in 2 MPNST ( Figure 1A and B ). MPNST 24748 had a mutation in exon 4 (CCT>TCT, codon 130) leading to the non-conservative amino acid exchange from proline to serine. MPNST 24740 harboured a somatic mutation in exon 10 (GTC>GCC, codon 469) leading to an exchange from valine to alanine.
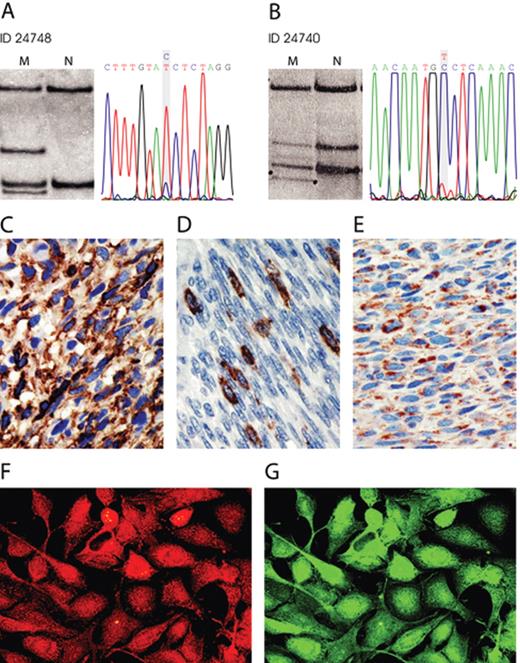
Mutation and expression in MPNST. ( A ) and ( B ) SSCP gels and sequences of the shifted PDGFRA bands. MPNST 24748 shows a T to the wild-type C exchange and MPNST 24740 a C to the wild-type T exchange. (C–E) Immunohistochemistry. PDGFRα expression in MPNST 21852 ( C ), c-Kit expression in MPNST 24694 ( D ), PDGF-A expression in MPNST 24748 ( E ). ( F ) and ( G ) shows cell culture S462 double stained with antibodies to PDGF-A red, (F) and PDGFRα green, (G). Original magnification: 400×.
Because a transforming PDGFRα deletion mutant (loss of exon 8 and 9) was reported in a glioblastoma ( 24 ) we examined PDGFRA cDNA in order to detect large deletions that would not be recognized by SSCP. Analysis of 10 MPNST and cell culture S462 did not reveal large deletions (data not shown).
We found six different single nucleotide polymorphisms in PDGFRA which are listed in Table II . Three of 31 MPNST from individual patients were heterozygous for the 478Pro allel and exhibited allel frequencies of f(Ser 478 ) = 0.950 and f(Pro 478 ) = 0.050. To determine the allel frequency in the general population we investigated 150 blood samples. The allel frequency was f(Ser 478 ) = 0.873 and f(Pro 478 ) = 0.127. Individuals with the 478Pro variant in exon 10 also carried the silent polymorphism in exon 7. Recently, we detected the 478Pro polymorphism in 14 of 103 gliomas (13 heterozygous and 1 homozygous) ( 25 ). The allel frequency in glioma was f(Ser 478 ) = 0.927 and f(Pro 478 ) = 0.073.
Allelic variants of PDGFRA in MPNST
| Exon | Codon | Triplett | Amino acid | Patient ID |
|---|---|---|---|---|
| 3 | 79 | GGC>GAC | G>N | 26592 |
| 7 | Del 348–353 | Del 18 bp | Deletion of SWLKNN | 24772 |
| 7 | 313 | GGT>GGG | Silent | 24308, 24624/24626, 26586, 27724 |
| 10 | 478 | TCC>CCC | S>P | 24308, 24624/24626, 26586 |
| 13 | 603 | GCG>GCA | Silent | 26586 |
| 16 | 764 | CGT>CAT | R>H | 24740 |
| 18 | 824 | GTC>GTT | Silent | 24308, 26586, 26588 |
The pNF 28572 and corresponding normal cells carried an allelic variant lacking 18 bp in exon 7. The 18 bp deletion variant seen in a single patient has not been reported before and we did not find it in 150 control individuals (data not shown). The four KIT exons analysed did not harbour mutations or polymorphisms.
Gene amplification of PDGFRA and KIT
PDGFRA and KIT amplification was investigated by real-time PCR. Eight samples (seven solid tumours and cell culture S462) from six patients showed PDGFRA amplification by a factor of 1.8 or more relative to the normal gene dose. KIT amplifications were detected in six samples (five tumours and cell culture S462) from four patients. Five samples (24472, 24784, 21914, 22318, cell culture S462) showed amplification of both, PDGFRA and KIT . Gene amplification results are summarized in Table III .
Mutation and protein expression of KIT and PDGFRA in peripheral nerve sheath tumors
| No. | Patient ID | Tumour entity | Grade | NF1 | PDGFRA mutation | PDGFRα IHC | PDGFRα WB | PDGF-A IHC | KIT mutation | c-Kit IHC |
|---|---|---|---|---|---|---|---|---|---|---|
| 1 | 24256¥ | MPNST | 3 | Yes | – | +++ | nd | ++ | – | – |
| 2 | 24740¥ | MPNST | 3 | Yes | Codon 469 GTC>GCC | + | nd | +++ | – | – |
| 3 | 24304 | MPNST | 1 | Yes | – | nd | nd | nd | – | – |
| 4 | 24326 | MPNST | 2 | Yes | – | ++ | nd | +++ | – | – |
| 5 | 24624 * | pNF | 1 | Yes | – | ++ | nd | + | – | – |
| 6 | 24626 * | MPNST | 2 | Yes | 2.8amp | +++ | nd | +++ | – | – |
| 7 | 28578 * | pNF | 1 | Yes | 2.4amp | – | nd | ++ | – | – |
| 8 | 24534 | MPNST | 3 | Yes | – | – | nd | +++ | – | – |
| 9 | 24668 | MPNST | 3 | Yes | – | ++ | nd | + | – | – |
| 10 | 24670 | MPNST | 3 | Yes | – | +++ | nd | + | – | – |
| 11 | 24748 | MPNST | 3 | Yes | Codon 130 CCT>TCT | ++ | nd | +++ | – | – |
| 12 | 24772+ | MPNST | 2 | Yes | – | +++ | nd | + | – | + focal |
| 13 | 28572+ | pNF | 1 | Yes | – | + | nd | – | – | – |
| 14 | 24776∼ | MPNST | 1 | Yes | – | +++ | nd | + | – | – |
| 15 | 28576∼ | pNF | 1 | Yes | – | nd | nd | nd | – | nd |
| 16 | 24472# | MPNST | 3 | Yes | 10.3amp | ++ | + | +++ | 5.5amp | – |
| 17 | S462# | Cell line | – | Yes | 5.1amp | +++ | + | +++ | 7.9amp | – |
| 18 | 24480 | MPNST | 2 | Yes | – | – | – | nd | – | – |
| 19 | 24484 | MPNST | 3 | Yes | 3.7amp | nd | nd | nd | – | nd |
| 20 | 24476 | MPNST | 2 | Yes | – | – | nd | +++ | – | – |
| 21 | 22476$ | pNF | 1 | Yes | – | + | nd | +++ | 9.3amp | – |
| 22 | 24784$ | MPNST | 1 | Yes | 2.7amp | + | – | +++ | 9.6amp | – |
| 23 | 21914 | MPNST | 2 | Yes | 5.9amp | ++ | + | + | 1.8amp | – |
| 24 | 21852§ | MPNST | 2 | Yes | – | +++ | + | +++ | – | – |
| 25 | 22318§ | MPNST | 3 | Yes | 2.0amp | + | nd | – | 3.3amp | – |
| 26 | 24308 | MPNST | 3 | Yes | – | + | nd | +++ | – | – |
| 27 | 24310 | MPNST | 2 | Yes | – | – | nd | nd | – | – |
| 28 | 24324% | MPNST | 1 | Yes | – | +++ | nd | +++ | – | – |
| 29 | 28580% | pNF | 1 | Yes | – | +++ | nd | +++ | – | – |
| 30 | 24332 | MPNST | 2 | Yes | – | + | nd | ++ | – | – |
| 31 | 24354$ | MPNST | 1 | Yes | – | ++ | nd | +++ | – | – |
| 32 | 24694 | MPNST | 2 | Yes | – | – | nd | – | – | + focal |
| 33 | 26592 | MPNST | 2 | Yes | – | +++ | nd | – | – | – |
| 34 | 28650 | MPNST | 2 | Yes | – | ++ | nd | ++ | – | – |
| 35 | 28652 | MPNST | 1 | Yes | – | – | nd | +++ | – | – |
| 36 | 27724 | MPNST | 3 | Yes | – | – | nd | +++ | – | – |
| 37 | 26580 | MPNST | 3 | No | – | nd | nd | nd | – | nd |
| 38 | 26582 | MPNST | 3 | No | – | +++ | nd | – | – | – |
| 39 | 26584 | MPNST | 2 | No | – | +++ | nd | +++ | – | – |
| 40 | 26586 | MPNST | 2 | No | – | +++ | nd | – | – | – |
| 41 | 26588 | MPNST | 3 | No | – | +++ | nd | – | – | – |
Amplification status (amp) is indicated by fold increase relative to the normal gene dose. ID: tumour identification number. NF1: NF1 status of the tumour patient. IHC: immunohistochemistry. WB: western blot. symbols ¥, $, %, #, §, * , + indicate tumours belonging to the same patient. nd: not determined (lack of material). Tumours were graded according to the modified FNCLCC system.
Expression of receptors PDGFRα and c-Kit
PDGFRα expression was determined in 32 MPNST from 28 patients. Immunoreactivity was observed on sections from 21 of 28 MPNST patients (75%). Twelve MPNST (38%) expressed PDGFRα in >60% of tumour cells, 7 MPNST (22%) in 31–60% of the tumour cells and 4 MPNST (13%) in 6–30% of the tumour cells. Five pNF were also evaluated and 4 showed PDGFRα expression. Three of these pNF localized adjacent to MPNST and 2 of them showed lower PDGFRα expression than the MPNST areas (MPNST 24626/pNF 28578 and MPNST 24772/pNF 28572). MPNST 24324 and corresponding pNF 28580 contained >60% PDGFRα positive tumour cells in both parts of the tumour. An example of immunohistochemistry is shown in Figure 1C . Results are compiled in Table III . Examination of 5 MPNST and cell culture S462 for PDGFRα expression by western blot revealed bands at the expected size of 185 kDa in four samples ( Figure 2 ). Further 6 neurofibromas analysed by western blotting showed little or no PDGFRα signals (data not shown). The western blot results were in accordance with immunohistochemistry. All tumour samples positive for PDGFRα in western blot (21914, 21852, 24472 and corresponding cell culture S462) were also positive in immunohisto- and cytochemistry ( Figure 1C and G ). No signals were detected in MPNST 24480 and 24784. Accordingly, these tumours were negative or showed PDGFRα expression in only a minority of cells. With the exception of pNF 28578, all tumours with PDGFRA amplification expressed PDGFRα.
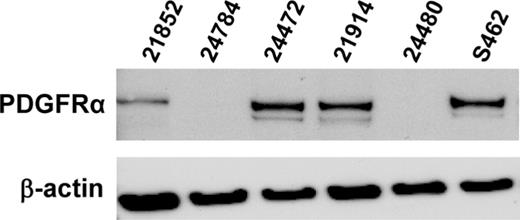
Western blot of primary MPNST and MPNST cell culture S462 with antibodies to PDGFRα and β-actin.
Immunohistochemistry revealed focal c-Kit expression in 2 MPNST ( Figure 1D ). C-Kit positive mast cells within the tumours and a c-Kit expressing GIST served as controls.
Expression of growth factors PDGFA and PDGFB
In order to examine PDGFRα ligand expression in neurofibromas and MPNST we performed RT–PCR for PDGFA and PDGFB in 5 dNF, 3 pNF, 8 MPNST and 2 MPNST cell cultures and the glioblastoma cell line DBTRG. PDGFA was expressed in most tumours whereas PDGFB was detected in only 1 pNF but the majority of MPNST ( Figure 3 ).
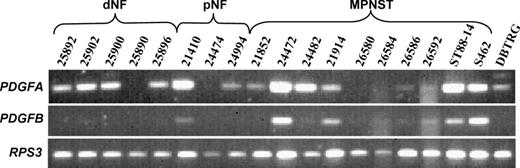
Expression of PDGFA and PDGFB in dermal neurofibromas (dNF), plexiform neurofibromas (pNF), MPNST, MPNST cell lines and the glioblastoma cell line DBTRG. RPS3 served as reference gene.
PDGF-A expression was determined in 30 MPNST from 26 patients. Immunoreactivity was observed on sections from 21 of 26 MPNST patients (81%). Fifteen MPNST (50%) expressed PDGF-A in >60% of tumour cells, 3 MPNST (10%) in 31–60% of the tumour cells and 5 MPNST (17%) in 6–30% of the tumour cells. Five pNF were also evaluated and 4 showed PDGF-A expression. Immunocytochemistry revealed strong PDGF-A expression in MPNST cell culture S462 ( Figure 1F ). Results for individual tumours are given in Table III .
Inhibition of MPNST cell culture proliferation and phosphorylation of PDGFRα by imatinib
The inhibitory effect of imatinib was tested with concentrations of 2 and 10 µM. Use of 2 µM imatinib led to an 11% reduction in proliferation on day 4 and a reduction of 39% on day 7 as compared to untreated control cells. The effect of 10 µM imatinib was more pronounced with 58% inhibition on day 4 and 66% on day 7 post-exposure ( Figure 4A ). This corresponds to a biologic IC 50 of <10 µM. Next, we evaluated if concentrations of 2 µM and 10 µM imatinib would inhibit ligand induced phosphorylation of PDGFRα. In fact, both imatinib concentrations prevented PDGF-AA induced phosphorylation in S462 cells which corresponds to a pharmacologic IC 50 <2 µM ( Figure 4B ).
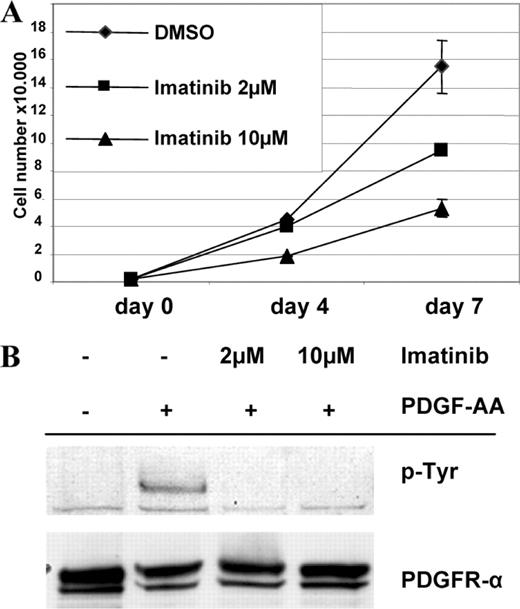
( A ) Effect of imatinib on proliferation of MPNST cell culture S462. ( B ) Inhibition of PDGF-AA induced phosphorylation of PDGFRα by 2 and 10 µM imatinib. Lysates of treated cells were resolved by electrophoresis and transferred to membranes. Membranes were probed with the indicated antibodies.
Stimulation with PDGF-AA and PDGF-BB increased proliferation of S462 cells under serum-free conditions by a factor of four in comparison to the untreated controls (data not shown).
Discussion
This study is the first to demonstrate molecular aberrations of receptor tyrosine kinase genes PDGFRA and KIT in MPNST. We detected gene amplification of PDGFRA in 6 and somatic point mutations in 2 of 31 patients with MPNST. Structural alterations of PDGFRA were therefore present in 8 of 31 (26%) patients with MPNST. The 2 point mutations localized to exon 4 and exon 10 of PDGFRA , which encode parts of the extracellular domain of PDGFRα. PDGFRA exon 10 corresponds to KIT exon 9 which is the second most mutated KIT exon in GIST ( 23 ). We found valine substituted by alanine in codon 469. This valine, located in the Ig-like domain of the receptors, is conserved in c-Kit and corresponds there to codon 459. Mutations in the extracellular domain may modulate ligand-binding and dimerization, thereby indirectly influencing tyrosine kinase activity. Finally, mutations of PDGFRA in MPNST occur as frequent as EGFR amplifications, which have also been found in 26% of MPNST ( 7 ). Other frequent alterations in MPNST include NF1 , CDKN2A and TP53 deletions and/or mutations ( 5 , 7 , 19 , 26 ). Until today not many tumour entities with mutations in PDGFRA have been described. Recently it was shown, that a subset of about 35% of GISTs lacking KIT mutations carried mutations in PDGFRA ( 27 , 28 ) indicating that either KIT or PDGFRA aberrations contribute to the development of these tumours.
We detected 7 allelic variants of PDGFRA present in both, tumour and reference tissues. Three of them led to an amino acid exchange and one to a truncated protein. The 478Pro variant has been described before and functional analysis revealed no constitutive phosphorylation like 2 PDGFRα gain-of-function mutants ( 25 , 28 ). We found a variant of PDGFRA with an 18 bp deletion resulting in a truncated protein lacking the 6 amino acids SWLKNN in a single patient ( Table II ). This deletion is located in the extracellular Ig-like domain IV and may, therefore, modulate ligand-binding. Protein extracts for western blotting were available from 5 MPNST patients. Three samples showed expression of PDGFRα, 2 of which were detected with amplification. Two samples with weak PDGFRα expression were derived from one patient with, and one without, gene amplification. Immunohistochemistry demonstrated PDGFRα expression in the majority of MPNST patients (75%). A cell culture established from MPNST 24472 exhibited similar features regarding PDGFRA amplification and PDGFRα expression as the native tumour. Gene amplification of KIT was detected in 4 of 31 patients. No point mutations were observed. Immunohistochemistry revealed c-Kit expression in 2 of 29 patients (7%). Both patients with focal c-Kit expression did not harbour KIT amplifications. Our data demonstrating limited c-Kit expression in MPNST are in accordance with a recent study that found weak c-Kit expression in 1 of 18 MPNST ( 29 ).
With the exception of pNF 22476, all tumours with KIT amplification also exhibited PDGFRA amplification. Notably, PDGFRA and KIT map next to each other with a distance of 359 kb on the chromosomal segment 4q12. Thus, the amplicon in the majority of the MPNST in our series contains more than one gene. Amplicons containing several genes have been described previously such as the frequent amplicons on chromosomal segment 12q13–q15 in glioblastoma containing MDM2 , SAS , CDK4 and in some cases also GADD153 , GLI , RAP1B , A2MR and IFNG ( 30 ). In MPNST the amplification of both PDGFRA and KIT may have profound effects on signal transduction. However, our observation of higher frequency of PDGFRA aberrations and stronger expression of PDGFRα may suggest that this gene provides a major selective advantage for MPNST tumour cells and that KIT , due to infrequent expression of the protein, may be co-amplified as an ‘innocent bystander’.
Because point mutations in PDGFRA appear to be infrequent in MPNST we suggest that an autocrine loop of the PDGF system supports proliferation and angiogenesis. We could show, that expression of PDGFR ligands PDGF-A and PDGF-B is common to nerve sheath tumours. PDGFA was more widely expressed than PDGFB especially in neurofibromas. Similar mechanisms are known to play a role in gliomas ( 31 , 32 ). In addition to an autocrine loop, paracrine stimulation of the PDGF system may also contribute to tumour proliferation because fibroblasts are known to be a source for PDGF. There is evidence for a direct link between NF1 and PDGF. It was shown that Schwann cells derived from Nf1−/− mice expressed PDGFB which was absent in Nf1+/+ mice ( 33 ).
Patients with GIST respond to treatment with imatinib, an inhibitor of the protein tyrosin kinase c-Kit ( 16 ). Imatinib does not selectively inhibit c-Kit but also interferes with other receptor tyrosine kinases such as PDGFRα ( 34 , 35 ). We therefore analysed growth of MPNST cells at imatinib concentrations of 2 and 10 µM employing cell culture S462, which was shown to harbour loss of heterozygosity in genes encoding neurofibromin, p53 and p16 ( 19 ). S462 showed a dose-dependent reduction of cell growth in vitro ( Figure 4A ). Ligand induced phosphorylation of PDGFRα was completely inhibited at both concentrations of imatinib ( Figure 4B ). The effect of imatinib on PDGFRα positive tumour cells has recently been shown in ovarian cancer cells. Only PDGFRα positive cell cultures were inhibited while cell lines lacking PDGFRα expression were not affected ( 36 ). In patients, a mean plasma concentration of up to 4.6 µM imatinib after oral administration of 400 mg (1.46 µM after 24 h) has been reported ( 17 ). Therefore, the concentration of imatinib inhibiting MPNST cell culture is similar to that in patient plasma. Further support for the potential sensitivity to imatinib is derived from the observation, that a majority of MPNST patients with PDGFRA amplification also exhibit amplification of KIT , although the latter seems not to be strongly expressed in tumour cells. However, c-Kit positive mast cells within the tumour are thought to contribute to its development ( 37 ). Therefore, MPNST carry at least two targets of imatinib. These data may indicate that patients with MPNST benefit from imatinib treatment.
In conclusion, we describe frequent mutations of PDGFRA in MPNST often associated with coamplification of KIT . In vitro growth of an MPNST cell line could be inhibited by the tyrosin kinase inhibitor imatinib which is known to target both PDGFRα and c-Kit. PDGFRα should therefore be considered as candidate for targeted therapy of MPNST.
We thank Kathrein Stichling and Petra Matylewski for their technical assistance and Prof. Karl Riabowol for critically reading the manuscript. This work was supported by Deutsche Krebshilfe (70-2794-De1) and the US army grant NF050145.
Conflict of Interest Statement : None declared.
References
Huson,S.M. (
Evans,D.G., Baser,M.E., McGaughran,J., Sharif,S., Howard,E. and Moran,A. (
Menon,A.G., Anderson,K.M., Riccardi,V.M. et al . (
Legius,E., Dierick,H., Wu,R., Hall,B.K., Marynen,P., Cassiman,J.J. and Glover,T.W. (
Kourea,H.P., Orlow,I., Scheithauer,B.W., Cordon-Cardo,C. and Woodruff,J.M. (
Holtkamp,N., Reuss,D.E., Atallah,I. et al . (
Perry,A., Kunz,S.N., Fuller,C.E., Banerjee,R., Marley,E.F., Liapis,H., Watson,M.A. and Gutmann,D.H. (
Holtkamp,N., Mautner,V.F., Friedrich,R.E., Harder,A., Hartmann,C., Theallier-Janko,A., Hoffmann,K.T. and von Deimling,A. (
Weinmaster,G. and Lemke,G. (
Betsholtz,C., Karlsson,L. and Lindahl,P. (
Ryan,J.J., Klein,K.A., Neuberger,T.J., Leftwich,J.A., Westin,E.H., Kauma,S., Fletcher,J.A., DeVries,G.H. and Huff,T.F. (
Badache,A., Muja,N. and De Vries,G.H. (
Leroy,K., Dumas,V., Martin-Garcia,N. et al . (
Heinrich,M.C., Corless,C.L., Duensing,A. et al . (
Hermanson,M., Funa,K., Koopmann,J. et al . (
Demetri,G.D., von Mehren,M., Blanke,C.D. et al . (
Druker,B.J., Talpaz,M., Resta,D.J. et al . (
Price,V.E., Fletcher,J.A., Zielenska,M., Cole,W., Viero,S., Manson,D.E., Stuart,M. and Pappo,A.S. (
Frahm,S., Mautner,V.F., Brems,H., Legius,E., Debiec-Rychter,M., Friedrich,R.E., Knofel,W.T., Peiper,M. and Kluwe,L. (
Coindre,J.M., Trojani,M., Contesso,G., David,M., Rouesse,J., Bui,N.B., Bodaert,A., De Mascarel,I., De Mascarel,A. and Goussot,J.F. (
Okuducu,A.F., Janzen,V., Hahne,J.C., Ko,Y. and Wernert,N. (
Plaat,B.E., Molenaar,W.M., Mastik,M.F., Hoekstra,H.J., te Meerman,G.J. and van den Berg,E. (
Duensing,A., Heinrich,M.C., Fletcher,C.D. and Fletcher,J.A. (
Clarke,I.D. and Dirks,P.B. (
Hartmann,C., Xu,X., Bartels,G., Holtkamp,N., Gonzales,I.A., Tallen,G. and von Deimling,A. (
Lothe,R.A., Smith-Sorensen,B., Hektoen,M., Stenwig,A.E., Mandahl,N., Saeter,G. and Mertens,F. (
Heinrich,M.C., Corless,C.L., Demetri,G.D. et al . (
Hirota,S., Ohashi,A., Nishida,T., Isozaki,K., Kinoshita,K., Shinomura,Y. and Kitamura,Y. (
Sato,O., Wada,T., Kawai,A. et al . (
Reifenberger,G., Ichimura,K., Reifenberger,J., Elkahloun,A.G., Meltzer,P.S. and Collins,V.P. (
Hermanson,M., Nister,M., Betsholtz,C., Heldin,C.H., Westermark,B. and Funa,K. (
Guha,A., Dashner,K., Black,P.M., Wagner,J.A. and Stiles,C.D. (
Mashour,G.A., Ratner,N., Khan,G.A., Wang,H.L., Martuza,R.L. and Kurtz,A. (
Buchdunger,E., Cioffi,C.L., Law,N., Stover,D., Ohno-Jones,S., Druker,B.J. and Lydon,N.B. (
Trempat,P., Villalva,C., Laurent,G., Armstrong,F., Delsol,G., Dastugue,N. and Brousset,P. (
Matei,D., Chang,D.D. and Jeng,M.H. (
Author notes
Institute of Neuropathology, Charité — Universitätsmedizin Berlin, Germany, 1Department of Surgery and Surgical Oncology, Robert-Rössle-Hospital, Berlin, Germany, 2Department of Neuropathology, Otto-von-Guericke-University, Magdeburg, Germany and 3Department of Oral and Maxillofacial Surgery, University Hospital Eppendorf, Hamburg, Germany
