


Abstract
The contribution that mitochondrial bioenergetics could have in cancer development is debated. Here, we have generated HCT116-derived colocarcinoma cell lines expressing different levels of the β catalytic subunit of the mitochondrial H + -adenosine triphosphate synthase to assess the contribution of mitochondrial bioenergetics in colon cancer progression. The generated cells exhibit large ultrastructural, transcriptomic, proteomic and functional differences in their mitochondria and in their in vivo tumor forming capacity. We show that the activity of oxidative phosphorylation defines the rate of glucose utilization by aerobic glycolysis. The aggressive cellular phenotype, which is highly glycolytic, is bound to the deregulated expression of genes involved in metabolic processes, the regulation of the cell cycle, apoptosis, angiogenesis and cell adhesion. Remarkably, the molecular and ultrastructural analysis of the tumors derived from the three HCT116 cell lines under study highlight that tumor promotion inevitably requires the selection of cancer cells with a repressed biogenesis and functional activity of mitochondria, i.e. the highly glycolytic phenotype is selected for tumor development. The tumor forming potential of the cells is a non-genetically acquired condition that provides the cancer cell with a cell-death resistant phenotype. An abrogated mitochondrial respiration contributes to a diminished potential for reactive oxygen species signaling in response to 5-fluorouracil treatment. Treatment of cancer cells with dichloroacetate partially restores the functional differentiation of mitochondria and promotes tumor regression, emphasizing the reversible nature of the metabolic trait of cancer.
Introduction
Mitochondria play a central role in the homeostasis of higher eukaryotic cells. The provision of metabolic energy by oxidative phosphorylation, the execution of cell death and intracellular signaling by Ca 2+ and reactive oxygen species (ROS) are main cellular functions of the organelle. In oxidative phosphorylation, adenosine triphosphate (ATP) is synthesized from adenosine diphosphate (ADP) and inorganic phosphate by the mitochondrial H + -ATP synthase that utilizes as driving force the proton electrochemical gradient generated by the respiratory chain ( 1 ). In response to different types of stimuli (death signaling, deprivation of trophic factors, DNA damage, ischemia, chemical or metabolic stress), mitochondria release proteins that regulate cell death pathways ( 2 ). Bioenergetics and the execution of cell death by the mitochondrial geared pathway are activities that are molecularly and functionally integrated ( 3–5 ). Oxidative phosphorylation is required for efficient execution of cell death ( 5–9 ). In this regard, cells that are unable to carry on oxidative phosphorylation and rely heavily on glycolysis have an apoptotic-resistant phenotype ( 5 , 6 , 8 , 10 ). Likewise, the treatment of cells with specific inhibitors of the H + -ATP synthase, inhibit and/or delay the execution of death ( 5 , 7 ). In addition, the activity of oxidative phosphorylation has been shown to be required for Bax-induced death in yeast cells ( 11 ). Moreover, genetic screens have identified both the β-subunit (β-F1-ATPase) ( 12 ) and δ-subunit ( 7 ) of the H + -ATP synthase as critical factors for Bax-mediating killing of Saccharomyces cerevisiae . Recent findings support that the contribution of the H + -ATP synthase to the execution of cell death is exerted by controlling the production of ROS generated by the respiratory chain ( 5 ). The generated ROS have been shown to promote oxidative damage to mitochondrial constituents and to favor the release of apoptogenic proteins from mitochondria ( 5 ).
The energetic metabolism of the cancer cell has raised renewed clinical and biotechnological interests ( 13–15 ). It has been consistently reported that the relative cellular expression level of the bottleneck β-F1-ATPase protein of oxidative phosphorylation is significantly diminished in tumors when compared with its levels in normal tissues ( 14 , 16 , 17 ). In certain types of carcinomas, the down-regulation of β-F1-ATPase is accompanied by an increased expression of some of the markers of the glycolytic pathway ( 14 , 16 ). This proteomic feature of cancer defines a ‘bioenergetic signature’ of clinical value as an indicator of disease progression in colon ( 16 , 17 ), lung ( 18 , 19 ) and breast ( 20 ) cancer patients as well as a predictive marker of the cellular response to chemotherapy ( 5 , 17 , 21 , 22 ). Moreover, the bioenergetic signature of tumors also informs of the rates of glucose uptake ( 19 ), adding further functional value to the index and strongly supporting a relevant role for the H + -ATP synthase in cancer progression.
The recent finding that cancer suppresses the tissue-specific differences in the expression of markers of energetic metabolism ( 23 ) further support that limitation of the bioenergetic activity of mitochondria is a required event for tumor progression. Indeed, tumors with a low bioenergetic signature have a worse prognosis ( 16–20 ). In this study, we have addressed the role that the molecular and functional activity of mitochondria has in colon cancer progression. We show that for successful in vivo tumor growth, only cells with a repressed bioenergetic activity of mitochondria are selected. This cellular phenotype confers resistance to cell death and contributes to the rapid accretion of tumor mass. However, it also embodies the Achilles’ heel of cancer and a most promising target to halt disease progression because it represents a reversible trait of the malignant phenotype that is amenable to treatment.
Materials and methods
Cellular treatments
Human colorectal carcinoma HCT116 cells were grown in McCoy's 5A media supplemented with 10% fetal bovine serum. Cells were left untreated (M-type) or treated with 6 μM oligomycin (OL, G-type) or 10 mM 2-desoxyglucose (2-DG, SM-type) for 48 h. Where indicated the cells were incubated with 10 μM 5-fluorouracil (5-FU) for 48 h or 1 mM dichloroacetate (DCA) for 24 h.
Western blot analysis
Cells were processed as indicated ( 5 ). The primary antibodies used were anti-Hsp60 [heat shock protein 60; Stressgen SPA-807 (Stressgene, Victoria, Canada); 1:2000], anti-glyceraldehyde-3-phosphate dehydrogenase (GAPDH; Abcam, Cambridge, UK; 1:20 000), anti-tubulin (Sigma–Aldrich, St Louis, MI; 1:5000) and anti-β-F1-ATPase (1:15000) ( 16 ). Peroxidase-conjugated anti-immunoglobulin Gs (Nordic Immunology, Tilburg, The Netherlands; 1: 3000) were used as secondary antibodies. Blots were developed using the ECL reagent.
Electron microscopy
Cells were fixed with 2% glutaraldehyde in 0.1 M Sörensen phosphate buffer pH 7.4 for 2 h and post-fixed with 1% OsO 4 and 1% K 3 Fe(CN) 6 for 1 h. Samples were embedded in Epon (TAAB 812 resin; TAAB Laboratories Equipment, Aldermaston, Berks, UK). Ultrathin sections were stained with uranyl acetate and lead citrate and examined at 80 kV in a Jeol 1010 electron microscope (Tokyo, Japan). The determination of the relative cristae length was carried out in digital images (Image J software, National Institute of Health, Bethesda, MD) by determining the length of cristae relative to the mitochondrial transversal section (width) of each organelle. The relative matrix density was determined by the ratio of the mean gray intensity in mitochondria relative to that of the cytoplasm.
Aerobic glycolysis and cellular respiration
Lactate concentrations in the culture media were enzymatically determined. For respiratory measurements, 1–2 × 10 6 cells were resuspended in 200 μl of respiratory medium and the rates of oxygen consumption determined in a Clark-type electrode ( 24 ). Succinate (10 mM) was used as respiratory substrate in the presence and absence of 5 μM OL and/or 2 μM carbonyl cyanide p -trifluoromethoxy-phenylhydrazone.
Cell cycle and cell death assays
The cells were treated as indicated, harvested and processed as indicated previously ( 5 ). The DNA content per cell was evaluated in a FACScan flow cytometer (Becton-Dickinson, San José, CA).
Determination of ROS
The intracellular production of H 2 O 2 was monitored using the oxidation-sensitive probe DCFH 2 -DA (Molecular Probes, Eugene, OR) ( 5 ) in a FACScan flow cytometer. Propidium iodide (1 μg/ml) was added to detect dead cells.
In vivo tumorigenesis and treatments
Approximately, 10 7 HCT116 cells of the M-type, G-type and SM-type were injected into the flank of 6-week-old nude male mice (National Cancer Institute, Frederick, MD). Tumor size was determined using a standard caliper and its volume calculated using the formula (width 2 × length) × 0.52, where width represents the shortest tumor dimension. Following the ethical criteria established by our Institutional Review Board, the animals were killed when the tumor volume reached ∼3000 mm 3 . In any case, animals were followed during a maximum period of 50 days. For treatment studies, animals injected with G-type cells received daily intraperitoneal injections (100 μl) of 1 mM DCA or 0.5 mM 5-FU or 0.9% NaCl. After six consecutive days animals were weighted and the tumors were extracted.
Gene array hybridization and analysis
RNA from cells (M- and G-type) and tumors (AT-M and AT-G) was extracted using the RNeasy Mini Kit (Qiagen, Hilden, Germany) and the cRNA labeled. Samples were hybridized to Human Genome U133Plus2.0 array. The chips were analyzed following manufacturer's instructions (GCOS 1.4 Affymetrix®; Affymetrix, Santa Clara, CA). The Partek Genomics Suite v7.3.1 software (Partek, St Louis, MI) was used to normalize the data. Differentially expressed genes were selected by comparing with the mean value of M-type cells or AT-M tumor samples. Raw expression ratio data sets were filtered using the Cluster and TreeView software (University of California, Berkeley, CA). The multiple correction tests of Bonferroni and Benjamini and Hochberg (or false discovery rate) were applied to the data. Pathways analysis was performed using GenMAPP and MAPPFinder version 2.0 beta (Gladstone Institutes, San Francisco, CA). All the genes in the chip were included to identify relevant differences ( P < 0.05) in pathways activity between M and G cells and between AT-M and AT-G tumors. The lists of differentially expressed genes were analyzed for relative enrichment within GO and GeneGo cellular processes, metabolic pathways, diseases, or canonical pathways maps using the information provided by Affymetrix.
Quantitative reverse transcription polymerase chain reaction analysis
Total RNA samples were quantified with a Nanodrop ND-1000 spectrophotometer (Nanodrop Technologies, Wilmington, DE). RNA integrity was assessed with an Agilent 2100 Bioanalyzer (Agilent Technologies, Santa Clara, CA). Reverse transcription reactions were performed using 1 μg of total RNA and the High Capacity Reverse Transcription Kit (Applied Biosystems, Foster City, CA) with random primers, following manufacturer's instructions. Primers were designed with Probe Finder Software (Roche Applied Science, Mannheim, Germany) (see supplementary Table 3 is available at Carcinogenesis Online). Real-time polymerase chain reaction (PCR) was performed using Power Sybr Green PCR Master Mix (Applied Biosystems).
Statistical analysis
The results shown are the means ± SEM. Statistical analysis was performed by Student's t -test. Pearson's correlation coefficient and the P -value ( P ) were calculated using the SPSS 13.0 software package (IBM, Chicago, IL). Survival curves were derived from Kaplan–Meier estimates and compared by log-rank test. Statistical tests were two-sided at the 5% level of significance.
Results
Regulating the mitochondrial phenotype of colon cancer cells
Treatment of HCT116 cells with OL, a specific inhibitor of the mitochondrial H + -ATP synthase, resulted in cells with down-regulated expression of its catalytic β-F1-ATPase subunit (G versus M cells in Figure 1A ). Conversely, treatment of HCT116 cells with 2-DG, an inhibitor of glycolysis, resulted in cells displaying up-regulated expression of β-F1-ATPase (SM versus M cells in Figure 1A ). Changes in the expression of β-F1-ATPase in OL (G)- and 2-DG (SM)-treated cells occurred in the absence of relevant changes in the expression of the structural mitochondrial protein Hsp60 and of the marker of glycolysis GAPDH ( Figure 1A ). Therefore, the β-F1-ATPase/GAPDH (bioenergetic signature) and β-F1-ATPase:Hsp60 ratios were significantly diminished in OL-treated cells and augmented in 2-DG-treated cells, respectively, when compared with non-treated M-type cells (Figure 1A).
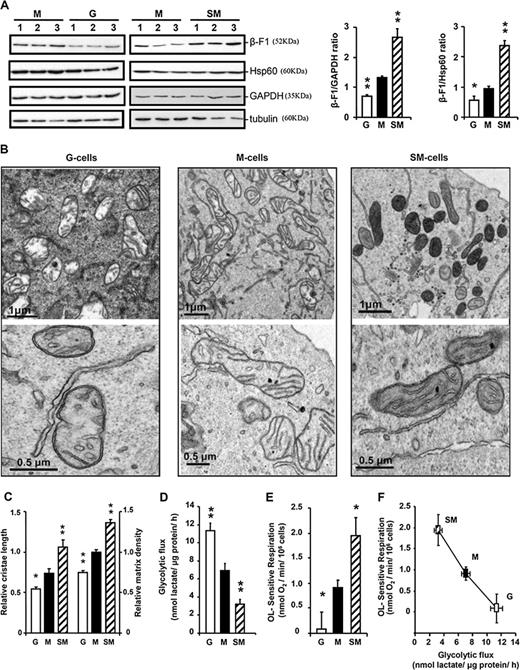
The bioenergetic signature of HCT116 colon cancer cells. ( A ) Representative western blots of the expression of β-F1-ATPase, Hsp60, GAPDH and tubulin in three different preparations (lanes 1–3) of OL-treated (G), 2-DG-treated (SM), and non-treated (M) HCT116 cells. The histograms show the calculated bioenergetic signature (β-F1:GAPDH ratio); SM cells ( n = 11), M cells ( n = 14) and G cells ( n = 11) and β-F1:Hsp60 ratio; SM cells ( n = 7), M cells ( n = 15) and G cells ( n = 8). ( B ) Electron microscopy analysis of G cells, M cells and SM cells at low (upper panels) and high (lower panels) resolution reveal large ultrastructural differences in the mitochondria of G cells when compared with M or SM cells. ( C ) The histograms show the quantification of the relative cristae length and matrix density of mitochondria. The results shown are means ± SEM of 83, 61 and 44 determinations for G, M and SM cells, respectively. ( D ) Rates of aerobic glycolysis in G, M and SM cells. Bars represent means ± SEM of 8, 15 and 6 independent determinations, respectively. ( E ) The rates of OL-sensitive respiration were determined after the addition of 5 μM OL. Bars represent means ± SEM of 6 (G cells), 11 (M cells) and 6 (SM cells) independent determinations. Plot in ( F ) illustrates the inverse relationship existing between the activity of oxidative phosphorylation and the rates of aerobic glycolysis. * P < 0.05 and ** P < 0.001 when compared with M cells.
Large ultrastructural modifications of mitochondria were observed in the absence of changes in the number of organelles per cell (16.3 ± 1.8 organelles/cell section) as a result of changes in β-F1-ATPase expression (Figure 1B). Cells with the G-phenotype were mostly populated with mitochondria devoid of cristae (Figure 1B) whereas M and SM cells contained mitochondria with developed cristae (Figure 1B). The relative cristae length and electron density of the matrix of mitochondria in G, M and SM cells revealed a significant increase as a function of the expression of β-F1-ATPase (Figure 1C), suggesting higher protein content. Aerobic glycolysis was found to increase as the relative expression of β-F1-ATPase (β-F1:GAPDH ratio) diminished in the cells (Figure 1D; R = −0.676; P < 0.01; n = 28). G cells had an irrelevant oligomycin sensitive respiration when compared with M and SM cells (Figure 1E). A significant inverse correlation between the activity of oxidative phosphorylation and the rates of glucose consumption by aerobic glycolysis existed (Figure 1F; R = −0.50; P < 0.05; n = 22), supporting the role of mitochondrial bioenergetics in glucose utilization rates, in other words, sustaining the relevance of the Pasteur Effect in cancer biology in nowadays terminology.
G cells have a higher rate of tumor growth
No differences were observed in the proliferation rates of SM, M and G cells when growing in culture ( Figure 2A ). However, when these cells were implanted into nude mice, we observed that the bioenergetic phenotype significantly affected the rate of tumor development ( Figure 2B ). In mice implanted with G cells, tumors grew significantly faster ( Figure 2B ). In survival analysis ( Figure 2C ), the mice allocated in the M and SM groups were compared with the G group of animals. The results showed a significant difference ( P = 0.004) in survival ( Figure 2C ) strongly indicating that in vivo a compromised mitochondrial activity and an enforced glycolysis affords a phenotypic advantage for colon cancer progression.
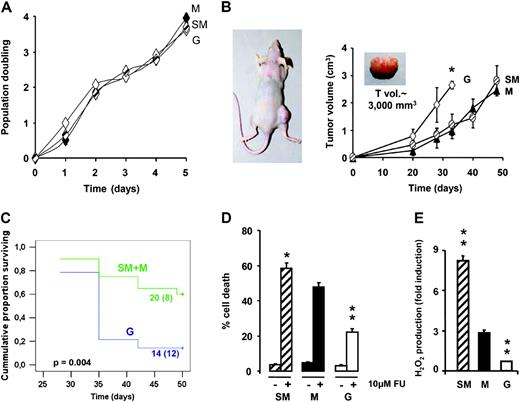
An enforced glycolysis encourages in vivo tumor growth. ( A ) 2-DG-treated (SM), OL-treated (G) and non-treated (M) cells were cultured for various days for the determination of population doubling. The results are means ± SEM of four independent experiments. ( B ) SM, G and M cells were injected into the right flank of nude mice. An enforced glycolytic phenotype accelerates the increase in tumor volume (cm 3 ). * P < 0.05 when compared with M injected mice. ( C ) Kaplan–Meier analysis shows the association of the bioenergetic phenotype of the cell with tumor progression. Log-rank significance is indicated in the plot. ( D ) SM-, G- and M-type cells were treated as indicated with 10 μM 5-FU. Fluorescent activated cell sorter analysis of the percentage of dead cells after 48 h of treatment. The results shown are the mean ± SEM of 9, 13 and 7 independent determinations for SM, M and G cells, respectively. ( E ) Fold induction in the generated H 2 O 2 after 5-FU treatment as determined by fluorescent activated cell sorter. The results are the means ± SEM of 6, 7 or 6 independent determinations for SM, M and G cells, respectively. * P < 0.05 and ** P < 0.001 when compared with M cells.
The bioenergetic phenotype influences the cellular response to death
Cell death is modulated by the bioenergetic phenotype ( 5–7 , 9 , 21 ) and it might contribute to the observed differences in the rates of tumor growth ( Figure 2B ). Analysis of the cell death response to 5-FU in SM-, M- and G-type cells revealed a significant direct correlation between the activity of oxidative phosphorylation and the extent of 5-FU-induced cell death ( R = 0.766; P < 0.01; n = 24) ( Figure 2D ). In agreement with previous results in colon cancer cells ( 21 ), the higher the bioenergetic phenotype of the cell (SM > M > G) the highest is its cell death response (SM > M > G) to the death inducing agent ( Figure 2D ). Moreover, and consistent with previous findings ( 5 ), the bioenergetic phenotype of the cells markedly influenced the ROS production response after treatment with 5-FU ( Figure 2E ). These results suggested that a faster rate of tumor accretion in G-implanted mice could result from the cell-death-resistant phenotype of the cells.
Gene expression profiles of the G- and M-phenotypes
Bioinformatic analysis of the gene expression profiles of M and G cells revealed that 3430 genes were differentially expressed ( P < 0.05; Partek analysis) ( supplementary Table 1 is available at Carcinogenesis Online). Hierarchical clustering using the genes differentially expressed confirmed the existence of large differences between M- and G-type cells ( Figure 3A ). From the global list of significant genes ( supplementary Table 1 is available at Carcinogenesis Online), 368 genes were ascribed to specific Kegg Pathways ( Figure 3B ). Moreover, discrimination of the M- and G-phenotypes was accomplished by 2387 genes significantly associated with relevant biological processes ( Figure 3C ). Table I and supplementary Tables 4 and Supplementary Data (available at Carcinogenesis Online) provide a summary of some relevant genes and processes found differentially expressed between M and G cells. Remarkably, the analysis revealed that the aggressive G-phenotype is associated with the repression of genes involved in mitochondrial biogenesis and function (see supplementary Tables 1 and Supplementary Data available at Carcinogenesis Online). For instance, it was observed that from a total of 369 probe sets related with mitochondrial functions, 297 were significantly inhibited in G cells (80% of the genes) when compared with M cells ( Figure 3D and see supplementary Table 4 available at Carcinogenesis Online). The histograms in Figure 3E summarize the validation by quantitative PCR of the changes observed in gene expression for representative genes that participate in oxidative phosphorylation, mitochondrial metabolism and apoptosis and mitochondrial biogenesis. The validation of additional genes involved in DNA expression and repair, biosynthesis of precursors and vascular development is provided in Supplementary Figure 1 (available at Carcinogenesis Online). Overall, quantitative PCRs confirmed array data (see Table I and text in supplementary material ).
Genes differentially expressed in M- and G-type cells
| Protein name | Gene symbol | Fold change | P -values | Activity/function | |
| FDR | Bonferroni | ||||
| Up-regulated in G-type cells | |||||
| Lipocalin 2 | LCN2 | 7.47 | 5.93 × 10 −4 | 0.00098 | Iron transport/endocytosis |
| Ribosomal protein L37 | RPL37 | 1.79 | 5.93 × 10 −4 | 0.00119 | Protein synthesis |
| Uridine phosphorylase 1 | UPP1 | 8.62 | 1.32 × 10 −3 | 0.00644 | Nucleotide metabolism |
| Tribbles homolog 3 | TRIB3 | 4.84 | 1.32 × 10 −3 | 0.00761 | Cell cycle |
| Chromosome 6 open reading frame 48 | C6orf48 | 2.26 | 1.32 × 10 −3 | 0.01114 | Iron transport |
| Kallikrein-related peptidase 6 | KLK6 | 1.70 | 1.32 × 10 −3 | 0.01141 | Protein degradation |
| Transaldolase 1 | TALDO1 | 1.67 | 1.32 × 10 −3 | 0.01332 | Pentose phosphate pathway |
| DNA-damage-inducible transcript 3 | DDIT3 | 5.34 | 1.32 × 10 −3 | 0.01464 | Protooncogen |
| Serine/threonine kinase 24 | STK24 | 1.42 | 1.32 × 10 −3 | 0.01559 | Signal transduction |
| Chloride intracellular channel 4 | CLIC4 | 1.77 | 1.43 × 10 −3 | 0.01929 | Cellular homeostasis |
| Integrin, beta 1 | ITGB1 | 1.49 | 1.43 × 10 −3 | 0.02003 | Vascular development |
| 6-phosphogluconolactonase | PGLS | 1.69 | 1.46 × 10 −3 | 0.02189 | Pentose phosphate pathway |
| Phosphoglycerate dehydrogenase | PHGDH | 2.54 | 1.79 × 10 −3 | 0.03044 | Amino acid synthesis (Ser) |
| Cystatin A (stefin A) | CSTA | 4.34 | 1.79 × 10 −3 | 0.03341 | Protein degradation |
| Chromosome 19 open reading frame 33 | C19orf33 | 2.72 | 2.14 × 10 −3 | 0.04271 | Tumorigenesis |
| EH domain-binding protein 1 | EHBP1 | 1.53 | 2.36 × 10 −3 | 0.05102 | Endocytosis/cytoskeleton organization |
| Plasminogen activator, urokinase | PLAU | 5.27 | 2.36 × 10 −3 | 0.05420 | Extracellular matrix degradation |
| Asparagine synthetase | ASNS | 4.44 | 2.58 × 10 −3 | 0.06789 | Cell cycle G1 progression |
| SH3-domain kinase-binding protein 1 | SH3KBP1 | 2.44 | 2.58 × 10 −3 | 0.07473 | Endocytosis/EGFR signaling |
| Carboxypeptidase A4 | CPA4 | 1.62 | 2.58 × 10 −3 | 0.07482 | Cell proliferation/differentiation |
| Calbindin 2, 29 kDa (calretinin) | CALB2 | 3.54 | 3.04 × 10 −3 | 0.12476 | Intracellular Ca 2+ regulation |
| Neuropilin 1 | NRP1 | 10.11 | 3.06 × 10 −3 | 0.13754 | Vascular development |
| AXL receptor tyrosine kinase | AXL | 3.51 | 3.22 × 10 −3 | 0.15295 | Oncogen |
| Sestrin 2 | SESN2 | 4.08 | 3.22 × 10 −3 | 0.15450 | Oxidative stress response |
| Down-regulated in G-type cells | |||||
| FK506-binding protein 5 | FKBP5 | −2.19 | 1.32 × 10 −3 | 0.00729 | Protein folding/Ca 2+ signaling |
| Transcription factor 7-like 1 | TCF7L1 | −1.67 | 1.32 × 10 −3 | 0.01584 | Transcription factor/Wnt signaling |
| Sperm-specific antigen 2 | SSFA2 | −2.57 | 1.61 × 10 −3 | 0.02577 | Integrin receptor |
| v-fos FBJ viral oncogene | FOS | −7.84 | 2.36 × 10 −3 | 0.05192 | Mitochondrial biogenesis |
| Cofilin 2 (muscle) | CFL2 | −2.09 | 2.58 × 10 -3 | 0.06760 | Actin-filament dynamics |
| Mitochondrial ATP synthase, F0-subunit F2 | ATP5J2 | −1.70 | 2.58 × 10 −3 | 0.07060 | OXPHOS |
| Mitochondrial ATP synthase, F0-subunit C3 | ATP5G3 | −1.64 | 2.58 × 10 −3 | 0.07141 | OXPHOS |
| KIT ligand | KITLG | −3.28 | 2.66 × 10 −3 | 0.07975 | Stem cell factor/differentiation inhibitor |
| Dehydrogenase/reductase (SDR family) member 2 | DHRS2 | −2.00 | 2.68 × 10 −3 | 0.08312 | Cell cycle |
| Crystallin, mu | CRYM | −2.01 | 2.68 × 10 −3 | 0.09104 | T3-binding protein |
| Synaptotagmin−like 2 | SYTL2 | −4.73 | 2.69 × 10 −3 | 0.09683 | Ca 2+ sensor/protein trafficking |
The table summarizes a list of relevant genes found up- or down-regulated in G cells when compared with M cells. Inclusion of the genes in this list follows statistical significance by the stringent multiple correction tests of FDR and Bonferroni. The protein name, gene symbol, fold change value and the main cellular activity is indicated FDR, false discovery rate.
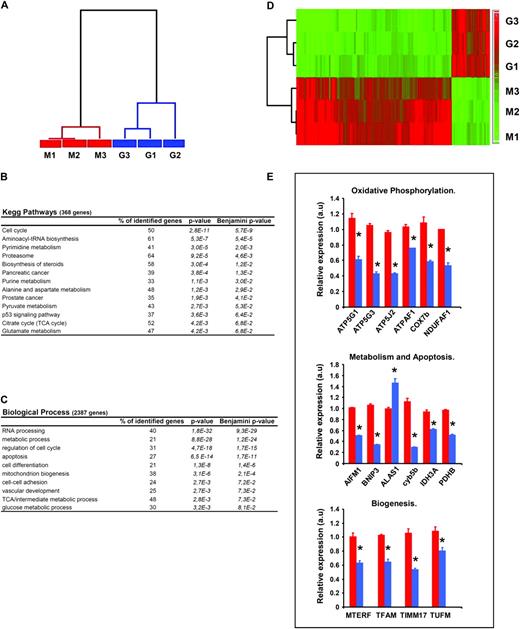
Repression of mitochondrial biogenesis in G cells. Three different samples of OL-treated (G1–G3) and non-treated (M1–M3) cells were processed for gene expression analysis using the Human Genome Plus 2.0 array (Affymetrix). ( A ) The dendrogram shows the large differences that exist between M (red) and G (blue) cells as assessed by 3430 genes found differentially expressed ( P < 0.05, see supplementary Table 1 is available at Carcinogenesis Online). The Kegg Pathways ( B ) and Biological Process ( C ) most significantly affected in G cells when compared with M cells is shown. The percentage of identified genes within a particular pathway and process is indicated. P -values for Partek analysis and Benjamini multiple correction test are also listed. ( D ) The heatmap illustrates the transcriptomic repression of mitochondrial functions by clustering of M ( n = 3) and G samples ( n = 3) in two different groups using the 369 probe sets related with mitochondrial function that are differentially expressed. Gene expression scores are shown according to a color scale: red, high; green, low. ( E ) Quantitative reverse transcription PCR validation of the microarray analysis in M (red bars) and G (blue bars) cells. Relative expression levels were normalized using Normfinder algorithm criteria to the actin, ND6 and PGLS content determined by quantitative reverse transcription PCR. * P < 0.001 when compared with M cells.
Tumor progression selects cells with the G-phenotype
Remarkably, analysis of the expression of markers of the ‘bioenergetic signature’ in the tumors derived from the implanted G, M and SM cells revealed that the expression of β-F1-ATPase, Hsp60 and GAPDH was the same irrespective of the phenotype of the cells implanted ( Figure 4A ). In fact, the normalized expressions of β-F1-ATPase revealed that all tumors had the mitochondrial phenotype of G cells ( Figure 4A ). The gene expression profile of tumors derived from M (AT-M) and G (AT-G) cells was compared. In high contrast with the same analysis in the parental cells ( Figure 3 and Table I ), tests for multiple corrections (false discovery rate and Bonferroni) revealed the absence of differences in gene expression between AT-M and AT-G tumors ( supplementary Table 2 available at Carcinogenesis Online). These results indicate that AT-M and AT-G tumors essentially have the same transcriptome. In fact, most of the genes found significantly up- or down-regulated in the analysis of M versus G cells (summarized in Table I and Figure 3 ) were not found altered in the analysis of the corresponding tumors ( supplementary Table 2 available at Carcinogenesis Online), reinforcing the molecular resemblance between AT-M and AT-G tumors. Real time quantitative PCR analysis in samples derived from AT-M and AT-G tumors confirmed the transcriptomic identity of AT-M and AT-G tumors ( Figure 4B ). Moreover, electron microscopy analysis of the tumors derived from G (AT-G), M (AT-M) and SM (AT-SM) cells confirmed that mitochondria in all tumors were mostly devoid of cristae resembling its ultrastructure in G cells ( Figure 4C ). Overall, these results support that tumors could only develop after cells with a G-phenotype have been selected.
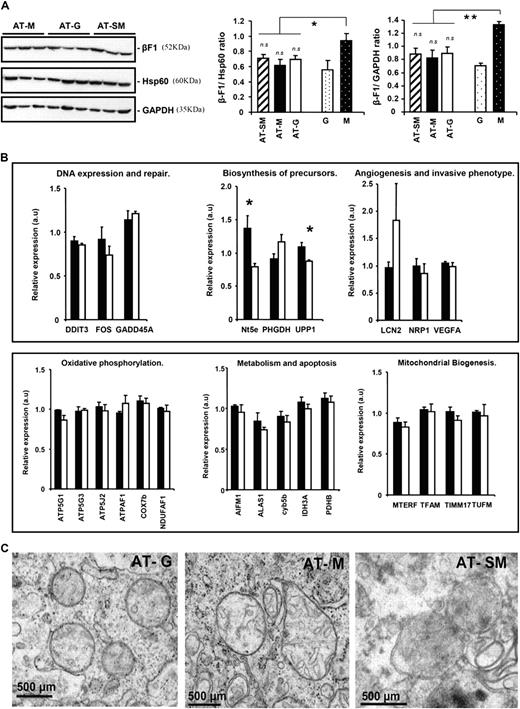
Tumors derived from HCT116 colon cancer cells have the same mitochondrial phenotype. OL-treated (G), 2-DG-treated (SM) and non-treated (M) cells were injected into nude mice and the developed tumors analyzed by western blot (A), quantitative reverse transcription-PCR (B) and electron microscopy (C). ( A ) Representative western blots of the expression of β-F1-ATPase, Hsp60 and GAPDH in three different tumor preparations (AT) derived from M (AT-M), G (AT-G) and SM (AT-SM) implanted cells. The histograms show the calculated β-F1:Hsp60 ratio and bioenergetic signature (β-F1:GAPDH ratio) in AT-SM ( n = 7–10), AT-M ( n = 9–12) and AT-G ( n = 11–16) samples and in the parental G ( n = 8–11) and M cells ( n = 14–15). * P < 0.05 and ** P < 0.001 and when compared with M cells. n.s., non-significant when compared with G cells. ( B ) Tumors derived from implanted M (AT-M, closed bars) and G (AT-G, open bars) cells were processed for quantitative reverse transcription PCR. Relative expression levels were normalized using Normfinder algorithm criteria to the BNIP3 content determined by quantitative reverse transcription-PCR. * P < 0.001 when compared with M cells. ( C ) Ultrathin sections of AT-G, AT-M and AT-SM tumors processed for electron microscopy revealed the presence of rounded mitochondria that lacked cristae very much resembling the organelle observed in G cells.
The G-phenotype is a reversible acquired trait
The transformation of M and SM cells into the aggressive G-phenotype when growing in vivo suggests that the acquisition of this phenotype is not responding to a permanent cellular transformation event but rather results from metabolic adaptation of the cancer cell to a particular ‘milieu.’ To verify the reversibility of the metabolic phenotype, G- and SM-type cells were cultured for various days after removing their respective drug treatments and their phenotypes analyzed ( Figure 5 ). Both in washed SM and G cells, the rates of aerobic glycolysis ( Figure 5A ) and the activity of oxidative phosphorylation (data not shown) returned to the values observed in the parental M cells. Consistently, the bioenergetic signature of washed SM cells showed a sharp decrease ( Figure 5B ) whereas a significant increase was observed in the bioenergetic signature of washed G cells ( Figure 5B ).
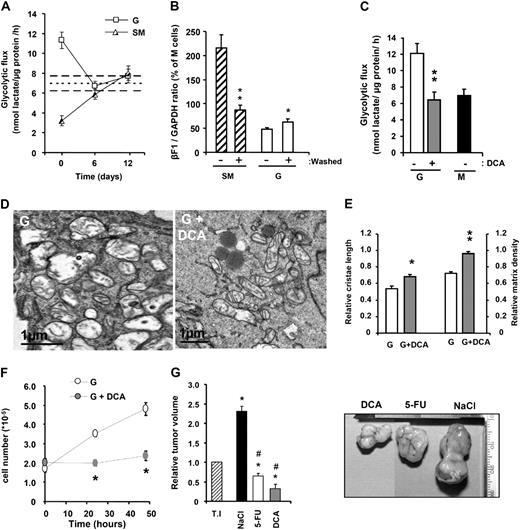
The reversible nature of the metabolic phenotype. ( A ) 2-DG-treated (SM) and OL-treated (G) cells were maintained in the absence of 2-DG or OL for 12 days. The mean rate of aerobic glycolysis in M cells is represented by a dotted line with upper and lower range limits represented by broken lines. The results shown are the means ± SEM of two independent experiments. ( B ) Analysis of the bioenergetic signature (β-F1:GAPDH ratio) in washed SM and G cells. The results shown are the means ± SEM of n = 11 and n = 8 for SM and washed SM cells; n = 11 and n = 9 for G and washed G cells independent determinations. * P < 0.05 and ** P < 0.001 when compared with parental cells, respectively. ( C ) Rates of aerobic glycolysis after 24-h treatment with 10 mM DCA. Histograms are means ± SEM of six independent experiments. The rates of aerobic glycolysis in M cells is included for comparison. ( D ) Electron microscopy analysis of non-treated and DCA-treated (G+DCA) G cells reveal that DCA triggers the appearance of cristae and an increase in matrix density. ( E ) Relative cristae length and matrix density of mitochondria in non-treated and DCA-treated G cells. The results shown are means ± SEM of 83 and 90 determinations for relative cristae length and 210 and 150 determinations for matrix density, for G (open bars) and DCA-treated (gray bars) cells, respectively. * P <0.05 and ** P < 0.001 when compared with non-treated G cells. ( F ) Cellular proliferation is arrested after 10 mM DCA treatment to G cells. The results shown are means ± SEM of four independent determinations.* P < 0.05 when compared with non-treated G cells. ( G ) OL-treated (G) cells were injected into nude mice and allowed to develop tumors until reaching ∼1000 mm 3 of size (T.I, hatched bar). Animals received daily injections of 0.5 mM 5-FU (open bar) or 1 mM DCA (gray bar). A 0.9% NaCl-treated group (closed bar) was also included for comparison. * and # P < 0.05 when compared with T.I and NaCl-treated mice, respectively. Representative tumors derived from control (0.9% NaCl-treated) and treated mice are shown.
Moreover, short-term treatment of G cells with 10 mM DCA, an activator of the mitochondrial decarboxylation of pyruvate ( 25 , 26 ), diminished the rates of aerobic glycolysis to reach the levels found in M cells ( Figure 5C ). Furthermore, electron microscopy of DCA-treated cells revealed that mitochondrial ultrastructure was partially restored resembling the organelles in M cells ( Figure 5D ) by increasing both the relative cristae length and electron density of the matrix ( Figure 5E ). DCA promoted the arrest of cellular proliferation ( Figure 5F ) indicating that, in addition to its metabolic effect, DCA is also affecting cellular growth.
To explore the tumor growth inhibitory activity of DCA, G cells were implanted in mice ( Figure 5G ). A control NaCl-treated group and a group treated with 5-FU were also included for comparison ( Figure 5G ). Daily treatment of the animals with the different agents was initiated after tumors of ∼1 cm 3 have developed and lasted for six consecutive days ( Figure 5G ). Control NaCl-treated animals revealed a rapid 2.5-fold increase in tumor volume in contrast to animals treated with 5-FU that revealed a significant decrease in tumor volume after 6 days of treatment ( Figure 5G ). The maximum tumor growth reduction (>50 %) was attained in mice treated with DCA ( Figure 5G ) indicating that reversion of the metabolic phenotype of the cancer cell to a mitochondrial-dependent pathway promotes in vivo tumor regression.
Discussion
We have examined the role that mitochondrial energetic metabolism has in colon cancer progression. To this aim, we generated and characterized two colon cancer cell lines derived from the human HCT116 colocarcinoma that exhibit a variable expression level of β-F1-ATPase and large structural, molecular and functional differences in their mitochondrial phenotype. We show that tumor promotion inevitably requires the selection of cancer cells with a repressed mitochondrial phenotype that shifts the energetic metabolism to depend heavily on aerobic glycolysis. The findings indicate that repression of organelle biogenesis, specifically of the bioenergetic differentiation of mitochondria, is a prerequisite for colon cancer progression. Repression of the bioenergetic function of mitochondria ensue cancer cells with a cell-death-resistant phenotype. The acquisition of this metabolic trait is a reversible feature imposed by the milieu where tumor cells develop in vivo and is amenable of pharmacological reversion to halt tumor progression.
It has been shown that the H + -ATP synthase is a key organizer of the inner mitochondrial membrane as well as a regulator of cristae formation both in yeast ( 27 , 28 ) and in cells of mammals ( 29 ). Consistently, we show that cells with different content of β-F1-ATPase have large ultrastructural modifications of mitochondria. Changes in the cellular expression of this protein could result from changes in the number of mitochondria per cell and/or from the degree of bioenergetic differentiation of the mitochondrion ( 24 ). The lack of changes in the expression of the structural Hsp60 together with the profound ultrastructural alterations observed in mitochondria as the expression of β-F1-ATPase augments support that the treatments are specifically affecting the differentiation of the organelle ( 24 ). In line with this suggestion, we observed no relevant changes in the number of mitochondria/cell in any of the cell types studied. Remarkably, mitochondria in G cells strongly resembled the phenotype of liver organelles during fetal stages of development ( 24 ) suggesting that this phenotype might result from retrograde dedifferentiation of the organelle, a mitochondrial déjà vu of early embryonic stages.
The bioenergetic differentiation of mitochondria ( 24 ) is controlled by translational activation of mRNAs and specifically affects β-F1-ATPase ( 30 ). Similar mechanisms operate for retrograde dedifferentiation of mitochondria in liver cancer ( 31 ). We propose that the reversible changes in the bioenergetic phenotype of the mitochondria as a result of interfering with oxidative phosphorylation (OL) or with glycolysis (2-DG; DCA) mechanistically resemble mitochondrial responses upon changes in the availability of energetic substrates ( 32 ), suggesting the implication of the adenosine monophosphate kinase signaling pathway in the adjustment of the final mitochondrial phenotype of the cell ( 33 ).
The onset of tumor growth is a poorly understood step of carcinogenesis. We illustrate that the acquisition of the aggressive G-phenotype is bound to the deregulated expression of genes involved in vascular development and mitochondrial functions. It is worth mentioning the induction of lipocalin 2 observed in G cells which is known to trigger epithelial to mesenchymal transition and to increase invasiveness in breast cancer ( 34 ). Remarkably, relevant mitochondrial functions involved in the provision of metabolic energy and in the biogenesis of mitochondria are repressed in G cells in agreement with molecular, functional and structural data. These results provide evidence that in vivo tumor progression requires the acquisition of a cellular phenotype with a repressed bioenergetic activity of mitochondria. However, in agreement with recent suggestions ( 35 ), it is possible that other mitochondrial functions such as glutaminolysis could contribute to support growth and the inhibition of apoptosis in the aggressive cancer cells.
Selection of a high glycolytic phenotype must provide cells with an advantage for tumor progression by facilitating their adaptation to a hypoxic and/or an acidic environment ( 36 ). This selection could also contribute to the acquisition of a cell-death-resistant phenotype. Indeed, energetic metabolism and the execution of cell death are two mitochondrial activities that are molecularly and functionally integrated, being the H + -ATP synthase an additional component involved in both pathways ( 5–12 ). Consistently, we show that G cells have deregulated expression of several genes involved in adaptation to hypoxia and in the execution of cell death, being the latter activity significantly diminished in G cells in response to 5-FU. Deregulated cell death in G cells seems to result from diminished ROS signaling, in agreement with the redox-protective role exerted by glucose metabolism in cancer cells ( 37 ).
The tumor forming G-phenotype is acquired independently of any genetic alteration being a reversible trait that could be modulated by agents that regulate the bioenergetic differentiation of mitochondria. It has been documented that interference of the mitochondrial oxidation of pyruvate predisposes to tumor development ( 38 ) and cellular invasion ( 39 ). Conversely, the activation of mitochondrial function by restoring the oxidation of pyruvate ( 25 , 26 ) or by suppression of its glycolytic metabolism ( 40 ) compromise the ability of cancer cells to proliferate. Overall, these findings reinforce the idea of a tumor suppressor function of mitochondrial activity ( 14 , 41 ) and place the repression of mitochondrial bioenergetic function as part of the in vivo program required for tumor progression. Little is known about the signaling pathways that repress the biogenesis of mitochondria. In this regard, the stress-responsive transcription factor DNA damage-inducible transcript 3 (also known as C/EBP-homologous protein) and its target gene TRIB3 might deserve special attention ( 42 ) because the inhibition of mitochondrial function in mouse epithelial cells also promotes the up-regulation of DNA damage-inducible transcript 3 and TRIB3 in addition to other genes found in our study (GADD45A, BNIP3 and Nt5e) ( 43 ) ( supplementary Table 1 available at Carcinogenesis Online; Figure 3 ). It is likely that the over-expression of DNA damage-inducible transcript 3 and TRIB3 in G cells might contribute to the down-regulation of the biogenesis of mitochondria through their repressor activities on c/EBP and AP1, respectively, which are required for the biogenesis of mitochondria ( 44–46 ).
In agreement with recent findings ( 25 ) we observed that DCA promoted the regression of tumors as effectively as the conventional treatment with 5-FU. However, and in contrast to 5-FU treatment, we observed that DCA induces a marginal apoptotic response in colon cancer cells (data not shown). Therefore, tumor regression induced by DCA treatment should be mechanistically ascribed to the arrest of cellular proliferation, as we have observed after treatment of the cells with this agent, together with the induction of some form of cell death triggered by this agent in the environment where the tumors develop. Indeed, we have shown that cells with functional mitochondria are unable to promote tumor development and that the restoration of mitochondrial function induces tumor regression. In other words, colon cancer progression is only possible when cancer cells repress the biogenesis and functional activity of mitochondria.
Supplementary material
Supplementary Tables 1 – Supplementary Data and Supplementary Data can be found at http://carcin.oxfordjournals.org/
Funding
Predoctoral fellowship from Ministerio de Sanidad y Consumo (PI041255 grant) to M.S.A. Grants from Ministerio de Educación y Ciencia (BFU2007-65253), the Centro de Investigación Biomédica en Red de Enfermedades Raras (CIBERER) del ISCIII, Madrid and Comunidad de Madrid (S-GEN-0269), Spain. Institutional grant from Fundación Ramón Areces to Centro de Biología Molecular Severo Ochoa.
Abbreviations
- β-F1-ATPase
β catalytic subunit of the mitochondrial H + -ATP synthase
- DCA
dichloroacetate
- 2-DG
2-desoxyglucose
- 5-FU
5-fluorouracil
- GAPDH
glyceraldehyde-3-phosphate dehydrogenase
- Hsp60
heat shock protein 60
- OL
oligomycin
- PBS
phosphate-buffered saline
- ROS
reactive oxygen species
We are grateful to J. Palacín, M.T. Rejas and F. Carrasco (Centro de Biología Molecular Severo Ochoa) for their support in nude mice, electron microscopy and quantitative polymerase chain reaction studies, respectively.
Conflict of Interest Statement: None declared.
