


Abstract
The oncogenes MYCN and survivin ( BIRC5 ) maintain aggressiveness of diverse cancers including sarcomas. To investigate whether these oncogenes cooperate in initial malignant transformation, we transduced them into Rat-1 fibroblasts. Indeed, survivin enhanced MYCN-driven contact-uninhibited and anchorage-independent growth in vitro . Importantly, upon subcutaneous transplantation into mice, cells overexpressing both instead of either one of the oncogenes generated tumors with shortened latency, marked anaplasia and an increased proliferation-to-apoptosis ratio resulting in accelerated growth. Mechanistically, the increased tumorigenicity was associated with an enhanced Warburg effect and a hypoxia inducible factor 1α linked vascular remodeling. This cooperation between MYCN and survivin may be important in the genesis of several cancers.
Introduction
The proto-oncogene MYCN is deregulated in diverse cancers of endodermal, neuroectodermal and mesodermal origin. Up to one-third of small cell lung carcinomas present with amplification or overexpression of MYC family members, including MYCN , associated with a more aggressive disease ( 1 , 2 ). In poor prognosis neuroblastoma (NB) and high-risk medulloblastoma, embryonic malignancies derived from neuroectoderm, MYCN is amplified ( 3–5 ). There is accumulating evidence that the deregulation of MYCN plays a causative role in the development and maintenance of these tumors ( 6–9 ). Sarcomas constitute another tumor entity with deregulation of MYCN. Amplification or overexpression of MYCN occurs in rhabdomyosarcoma, where it is associated with adverse outcome in the alveolar subtype and drives tumorigenesis in collaboration with PAX3–FKHR fusion protein ( 10–12 ). MYCN is also expressed or overexpressed in the majority of pediatric synovial sarcomas ( 13 ).
Despite its tumor-promoting properties, MYCN is also a potent inducer of apoptosis ( 14 , 15 ). Multiple antiapoptotic pathways are activated concomitantly with MYCN enabling it to exert its tumorigenic function. Survivin ( BIRC5 ) is highly expressed in embryonic and fetal organs as well as in the majority of cancers but is undetectable in most adult tissues ( 16 , 17 ). Overexpression of survivin is found in 90% of advanced stage NB, associated with MYCN amplification ( 18 , 19 ). Inhibition of survivin in NB cell lines causes cell death, consistent with the importance of survivin in these tumors ( 20 , 21 ). All medulloblastoma overexpress survivin and prognosis correlates negatively with its expression levels ( 22 , 23 ). Survivin is also expressed in over 80% of primary rhabdomyosarcomas, which depend on survivin for growth ( 24 ). Synovial sarcomas express survivin in the majority of cases, with increased risk of death when survivin is strongly expressed ( 25 ).
Tumor malignancy correlates with an anabolic shift of metabolism from oxidative phosphorylation to aerobic glycolysis. This phenomenon, known as the Warburg effect, has emerged as one of the hallmarks of cancer ( 26 , 27 ). MYCN is known to induce glycolytic fuelling, in part mediated by hypoxia inducible factor 1α (HIF1α) ( 15 , 28 , 29 ). There is emerging evidence that survivin also contributes to the Warburg effect ( 30 ).
While there is strong evidence that MYCN and survivin are simultaneously overexpressed in malignancies including sarcomas, it is unknown whether MYCN and survivin cooperate in initial malignant transformation. To address this question, we introduced the human transgenes, i.e. MYCN , survivin or both into fibroblasts and tested the transfectants for cancer cell properties. We show that survivin increases MYCN-induced malignant transformation in vitro , as well as tumorigenicity in vivo . Increased tumorigenicity was associated with increased anaplasia and could be attributed to enhanced anchorage-independent and contact-uninhibited growth, hyperproliferation, vascular remodeling and a metabolic switch to aerobic glycolysis. From this we conclude that MYCN and survivin cooperate in malignant transformation of fibroblasts. This cooperation may play a decisive role in the cancerogenesis of several malignancies.
Materials and methods
Cell lines and media
Cell lines were maintained in a humidified 5% CO 2 atmosphere at 37°C. Rat-1 cells (American Type Culture Collection, VA) were cultured in Dulbecco’s modified Eagle’s medium containing 10% fetal calf serum, 2mM glutamine and 100U/ml penicillin/streptomycin (all compounds from GIBCO, CA). GP2-293 cells (Clontech, CA) were grown in Dulbecco’s modified Eagle’s medium containing 10% fetal calf serum, 4mM glutamine and 100U/ml penicillin/streptomycin.
Vector constructs
The retroviral vector construct pBABEpuroLAP- Survivin contains the coding sequence of human survivin and was generously provided by Dr Susanne M.A. Lens, University Medical Center of Utrecht. pWZL- MYCN neo contains the coding sequence of human MYCN (kindly supplied by Dr Martin Eilers, IMT at the Philipps University of Marburg). The empty vectors pBABEpuro (a gift from Dr William Weiss, UCSF) and pWZLneo (a gift from Dr M. Eilers) were used for cotransduction and as controls.
Retroviral transduction
The retroviral constructs were each cotransfected with the pVSV-G plasmid into the GP2-293 packaging cell line (both Clontech) using calcium phosphate transfection according to standard protocols (125mM CaCl 2 and 0.75mM phosphate). Virus-containing supernatant was supplemented with 8 µg/ml polybrene (Sigma, Germany) and incubated with the cells for at least 6h (multiplicity of infection of 5–10). Rat-1 cells were transduced on two consecutive days to generate control cells (C: pWZLneo + pBABEpuro), survivin cells (S: pBABEpuroLAP- Survivin + pWZLneo), MYCN cells (N: pWZL- MYCN neo + pBABEpuro) and survivin + MYCN cells (SN: pBABEpuroLAP- Survivin + pWZL- MYCN neo). Experiments with transiently transduced cells were set up 2 days after the second transduction. For stable transduction, cells were selected with puromycin (2 µg/ml; Sigma) and G418 (700 µg/ml; GIBCO). Experiments with stably transduced cells were set up after at least 10 days of selection.
Western blot analysis
Cells (1×10 6 ) were lyzed in 100 µl of Laemmli-Urea buffer (6M urea, 235mM Tris pH 6.8, 5.6% sodium dodecyl sulfate, 18.75% glycerol) containing 5% of 2-mercaptoethanol. Snap-frozen tissue was pulverized, lyzed in Laemmli-Urea buffer containing 1mM dithiothreitol and protein concentration was measured using bicinchoninic acid protein assay kit according to the manufacturer’s protocol (Thermo Scientific, MA). Whole-cell extracts were heated for 5min at 100°C and 20 µl or 10 µg were separated on a sodium dodecyl sulfate polyacrylamide gel and blotted onto Hybond enhanced chemiluminescence nitrocellulose membrane (Amersham, UK). Membranes were blocked in Tris-buffered saline containing 5% milk powder (Merck, Germany) and probed overnight at 4°C with anti-Survivin (R&D systems, MN), anti-MYCN (Santa Cruz, CA) and anti-β-Actin (Sigma) antibodies. As secondary antibodies, goat anti-rabbit IgG (PIERCE, MA or LI-COR, NE) and goat anti-mouse IgG (PIERCE or LI-COR) were used. Enhanced chemiluminescence (Amersham) or ODYSSEY Imaging System (LI-COR) were used for detection.
Quantitative reverse transcription–polymerase chain reaction
Total RNA was isolated using TRI zol reagent and treated with DNase I (both Invitrogen, CA) according to the manufacturer’s instructions. First-strand complementary DNA was synthesized with Moloney Murine Leukemia Virus (M-MLV) reverse transcriptase (Promega, Germany) according to the manufacturer’s protocol. Quantitative reverse transcription–polymerase chain reaction (annealing at 58°C, 40 cycles) was performed using LightCycler Fast Start DNA Master SYBR Green I and a LightCycler PCR machine (both Roche, Germany). Expression of genes investigated was normalized to expression of β-actin. Primer sets are listed in Supplementary Materials and methods , available at Carcinogenesis Online.
Cell growth assay
Stably transduced living (trypan blue negative) cells (1.8×10 4 ) were seeded in triplicates (sextuplicates for 24h time point) onto six well plates in culture medium for the time points indicated. At each time point, cells were harvested and living cells were counted with Vi-CELL XR cell counter (Beckman Coulter, CA).
Apoptosis assay
Stably transduced living (trypan blue negative) cells (2.5×10 4 ) were seeded in triplicates onto six well plates in culture medium for the time points indicated. As soon as cells had attached to the plates, medium was exchanged for serum-free culture medium (3h after seeding; t = 0h). At each time point, cells were harvested prior to lysis and staining in a hypotonic buffer (0.1% sodium citrate, 0.1% Triton X-100) containing 50 µg/ml propidium iodide. Hypodiploid nuclei were measured by flow cytometry to determine apoptosis rate.
Focus formation assay
Transiently transduced cells were seeded at low density (5 × 10 5 ) onto 10cm dishes in growth medium without selection. Medium was changed regularly without passaging cells. After 4–5 weeks in culture, cell layer was methanol-fixed and stained with 0.5% crystal violet (Sigma) solution in water containing 25% of methanol. Foci were defined to be groups of cells that grew in multiple layers and thus in a contact-uninhibited manner.
Soft agar assay
Transiently transduced cells (2 × 10 3 ) were seeded as single cell suspension in 200 µl of 0.3% low melting point agarose (Invitrogen) in growth medium without selection onto 24 well plates (four wells each). After 4 weeks in culture, colonies that had formed within the soft agar were stained with 5mg/ml MTT (Sigma) in phosphate-buffered saline. Colonies with a minimal size of 0.2mm were counted.
Animal experiments
Recombination activating gene (RAG) −/− /common γ-chain −/− mice bread in the Animal Research Center of Ulm University and housed in sterile isolators were used. Eight mice per group were subcutaneously injected into one flank with single cell suspensions of stably transduced cells containing 2 × 10 5 viable cells in Dulbecco’s modified Eagle’s medium without additives. Mice were monitored twice per week and tumor size was measured. Experiments were terminated at the time tumors reached a diameter of 1cm. All experiments were done in accordance with institutional and state guidelines for the care and protection of animals.
Immunohistochemical analyses
Immunohistochemical studies were performed on three representative tumors of each group ( Supplementary Table SI , available at Carcinogenesis Online) according to standard protocols. In brief, serial sections (3 µm) of paraffin-embedded tissue were deparaffinized, pressure-cooked in 10mM citrate buffer (pH 6.0) and probed with anti-Ki-67 (DAKO, Denmark), anti-cleaved caspase 3 (Abcam, UK), anti-CD31 (Dianova, Germany), anti-HIF1α (Abcam) and anti-LDHA/LDHC (Cell Signaling, MA) antibodies. Alkaline phosphatase-conjugated anti-mouse, anti-rabbit or anti-rat antibodies (all JIR Labs, PA) and Permanent Red (DAKO) were used according to the manufacturer’s instructions. Proliferation index (Ki-67) and apoptosis rate [cleaved caspase 3 (CC3)] were calculated as the percentage of positively stained cancer cell nuclei counted in three maximally proliferative (Ki-67) or five representative areas (CC3) per section at ×400 (0.096mm 2 ). To evaluate tumor vasculature, the number of microvessels in three neovascular hot spots per section was counted at ×200 (0.397mm 2 ) according to standard protocols ( 31 ). To quantify the area of individual vessels, whole tumor sections were scanned and analyzed using BZ-9000 microscope and Hybrid Cell Count Software (both Keyence, Japan). A macro was set up, which measured the size of connected red-stained area. Total or partial endothelial cell area was calculated as the ratio of the respective red-stained area to the whole tumor area.
Glucose, lactate and ATP measurement in vivo
Glucose, lactate and ATP content in tumor sections was measured by induced metabolic bioluminescence imaging as described previously ( 32 ). In brief, cryostat sections of shock-frozen tissue specimens are immersed into an enzyme solution. Defined increase of temperature makes the tissue sections melt and allows for enzymatic reactions to take place finally leading to emission of light. The light reaction is registered with a precision microscope (Axiophot, Zeiss, Germany) and an ultrasensitive video system (Ancor, UK) to calculate local metabolite content in micromoles per gram (µmol/g) of tissue.
Protein blast
To assess homology of human and rat proteins, amino acid sequences were downloaded from the protein database of the NCBI homepage ( http://www.ncbi.nlm.nih.gov/protein/ ) to run the protein blast provided by NCBI ( http://blast.ncbi.nlm.nih.gov/Blast.cgi ). Algorithm parameters were applied as preadjusted.
Statistical Analysis
Mean, median and SEM were calculated and plotted using GraphPad Prism 4 (GraphPad Software, CA). Each experiment was repeated in triplicate.
Results
MYCN and survivin are overexpressed when transduced into Rat-1 cells
The spontaneously immortalized embryonic fibroblast cell line Rat-1 was chosen as model system as it has been successfully used in the past to investigate MYCN-induced transformation ( 33 ). Cells were retrovirally transduced in a sequential manner with two vector constructs each containing one of the human transgenes survivin (S) or MYCN (N) coupled to different resistance genes ( Figure 1A ). Transiently as well as stably transduced cells were assessed for transgene expression. Analyses showed that transgenic survivin and MYCN were strongly and exclusively expressed in cells that had been transduced with the respective vector construct ( Figure 1B ). As we showed previously, stably transduced cells have lower MYCN protein levels compared with transiently transduced cells ( 15 ). Thus, the transgenes were appropriately expressed when transduced into Rat-1 fibroblasts.
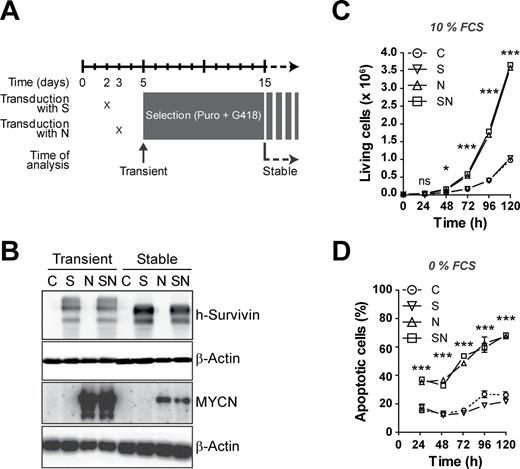
Survivin does not influence cell growth and does not counteract MYCN-induced apoptosis in vitro . ( A ) Scheme of retroviral transduction. Rat-1 fibroblasts were transduced with expression vectors for human survivin (S), human MYCN (N) and/or the corresponding empty vector controls (C). ( B ) Transduced cells overexpress survivin and MYCN. Western blot analysis confirms expression of transgenic survivin and MYCN. β-Actin is shown as loading control. ( C ) Survivin does not impact on MYCN-induced cell growth. Representative growth curves of stably transduced Rat-1 cells grown in medium containing 10% fetal calf serum. The means ± SEM are shown. Statistical analyses were done using analysis of variance (ANOVA) with Bonferroni correction. ns, not significant; * P < 0.05; *** P < 0.001 for C versus N, C versus SN, S versus N and S versus SN. Similar results were obtained in three independent experiments. ( D ) Survivin does not protect from MYCN-induced cell death upon serum withdrawal. Representative apoptosis rates of stably transduced Rat-1 cells grown in serum-free medium. The percentage of apoptotic cells was determined by fluorescence-activated cell sorting analysis counting propidium iodide-stained hypodiploid nuclei. Statistical analysis was performed as in (C). Similar results were obtained in three independent experiments.
Excess survivin does not influence MYCN-enhanced growth and apoptosis in vitro
It is well established that MYCN is not only mitogenic but also proapoptotic. Therefore, we assessed cell growth defined as the overall increase in cell number as well as apoptosis in stably transduced Rat-1 cells under normal growth conditions or during trophic stress induced by serum withdrawal. In the presence of serum, overexpression of MYCN in Rat-1 fibroblasts led to significantly increased growth rates compared with empty vector controls or survivin -transduced cells ( Figure 1C ). As the spontaneous median apoptosis rate was very low (1%), the number of living cells mainly reflects cell proliferation. Coexpression of survivin did not alter MYCN-induced cell growth. Previously, we have shown that knockdown of survivin increases MYCN-induced caspase-dependent apoptosis during serum deprivation ( 15 ). Therefore, we wanted to know whether an excess of survivin would protect cells from MYCN-induced cell death. To provoke MYCN’s proapoptotic function, cells were subjected to trophic stress by serum withdrawal. These culture conditions led to an increased basal apoptosis level in all cells analyzed ( Figure 1D ). In comparison with the controls and survivin-overexpressing cells, MYCN -transduced Rat-1 cells displayed significantly higher apoptosis rates. Of note, additional expression of survivin could not rescue Rat-1 cells from MYCN-induced apoptosis. Taken together, these data show that, in vitro , survivin overexpression does not impact on cell growth and apoptosis of Rat-1 fibroblasts, neither per se nor in conjunction with MYCN.
Survivin enhances MYCN-induced contact-uninhibited and anchorage-independent growth
Loss of contact inhibition and anchorage-independent growth are among the cancer cell properties acquired during malignant transformation. To asses for contact inhibition, confluent transiently transduced cells were observed for forming foci by overgrowing the monolayer. MYCN sufficed to induce contact-uninhibited growth and thus focus formation ( Figure 2A ). Survivin alone did not induce focus formation, but its coexpression significantly increased the frequency of MYCN-induced foci.
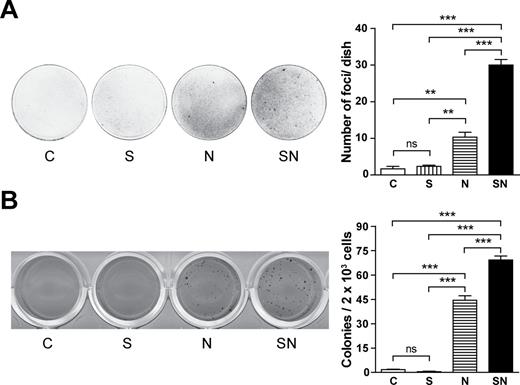
Survivin enhances MYCN-induced malignant transformation of Rat-1 fibroblasts. Transiently transduced Rat-1 fibroblasts were used. Bars show the mean ± SEM. Statistical analyses were performed using ANOVA followed by Tukey’s Multiple Comparison Test. *** P < 0.001; ** P < 0.01; ns, not significant. Experiments were repeated three times with similar results. ( A ) Survivin potentiates MYCN-induced focus formation. Cells were seeded at low density. After 4–5 weeks in culture, cells were stained with crystal violet and the number of foci was counted. ( B ) Survivin increases MYCN-induced clonogenicity in soft agar. Cells were seeded in semisolid medium. After 4 weeks in culture, cells were stained with MTT and colonies with a minimal diameter of 0.2mm were scored.
To assess anchorage-independent growth, transient transfectants were seeded in soft agar. MYCN enabled Rat-1 cells to grow in an anchorage-independent manner in soft agar ( Figure 2B ). Importantly, MYCN-induced anchorage-independent and clonogenic growth was significantly enhanced by additional overexpression of survivin. Thus, survivin and MYCN cooperate in inducing cancer cell characteristics in Rat-1 fibroblasts.
Decreased latency and enhanced growth of Rat-1 tumors coexpressing survivin and MYCN
One of the major hallmarks of cancer cells is the ability to form tumors in vivo. We therefore investigated whether the transfectants give rise to tumors in RAG −/− /common γ-chain −/− recipient mice. Palpable masses developed in all transplanted mice, due to their severe immunodeficiency ( Figure 3A ). Survivin transduction did not change basal tumorigenicity, whereas MYCN significantly decreased tumor latency. Importantly, latency was further shortened by concomitant overexpression of survivin, implying a cooperative effect of survivin and MYCN in malignant transformation.
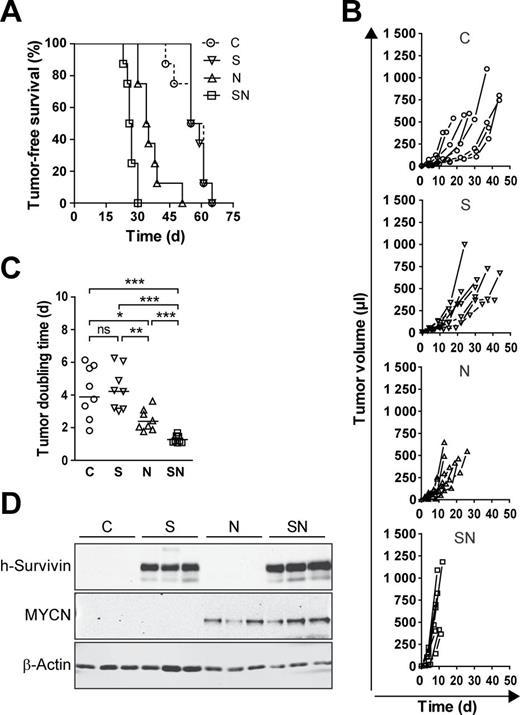
Survivin enhances MYCN-induced tumorigenicity of Rat-1 fibroblasts. 2×10 5 cells of stable bulk cultures were injected subcutaneously into one flank of RAG −/− /common γ-chain −/− mice (each group n = 8). Mice were monitored at regular intervals for the appearance of tumors. ( A ) Tumors overexpressing survivin together with MYCN display the shortest latency. Kaplan–Meier plot depicts the time points at which the tumors were palpable (volume ≥10 µl). Log-rank test: P < 0.001 for SN versus N, SN versus S, SN versus C, N versus S, N versus C and ns for S versus C. ( B ) Enhanced growth of tumors coexpressing survivin and MYCN. Shown are the growth curves of individual tumors. ( C ) Doubling time of SN tumors is significantly reduced. Dot plot shows doubling time of individual tumors. Mann–Whitney test was used for statistical analysis of the dot plot. *** P < 0.001; ** P < 0.01; * P < 0.05; ns, not significant. ( D ) Transgenes are expressed in the tumors. Western blot analysis confirms expression of transgenic survivin and MYCN in the tumors. β-Actin is shown as loading control.
Tumor growth rate was also assessed. MYCN significantly accelerated tumor growth thus shortening tumor doubling time ( Figure 3B and C ). Of note, cells expressing both transgenes gave rise to the fastest growing tumors, which still expressed the human transgenes ( Figure 3D ).
SN tumors are anaplastic with increased proliferation not offset by apoptosis
Histology of tumors resembled human high-grade pleomorphic sarcoma with high cellularity, fascicular storiform growth pattern, pronounced nuclear polymorphism, prominent nucleoli and numerous atypical mitoses ( Figure 4A ). Anaplastic features were most pronounced in SN tumors, in particular increased nuclear-to-cytoplasmic ratio, confirming their more malignant phenotype. To determine the mechanisms by which the combined overexpression of survivin and MYCN leads to a more aggressive tumor growth in vivo , tumors were stained for the proliferation marker Ki-67 and for CC3, a marker for caspase-dependent apoptosis ( Figure 4B and C ). Three out of eight tumors per group were selected with respect to a comparable tumor volume within each of the three sample sets to avoid confounding effects of different tumor size ( Supplementary Table SI , available at Carcinogenesis Online). The proliferation index of S tumors was similar to the control, whereas N tumors showed significantly increased proliferation ( Figure 4B ). Tumors coexpressing survivin and MYCN (SN) had the highest proliferation index throughout all groups. This was accompanied by a slight, albeit statistically significant increase in apoptosis ( Figure 4C ). Taken together, combined overexpression of survivin and MYCN in vivo causes hyperproliferation not compensated by apoptosis.
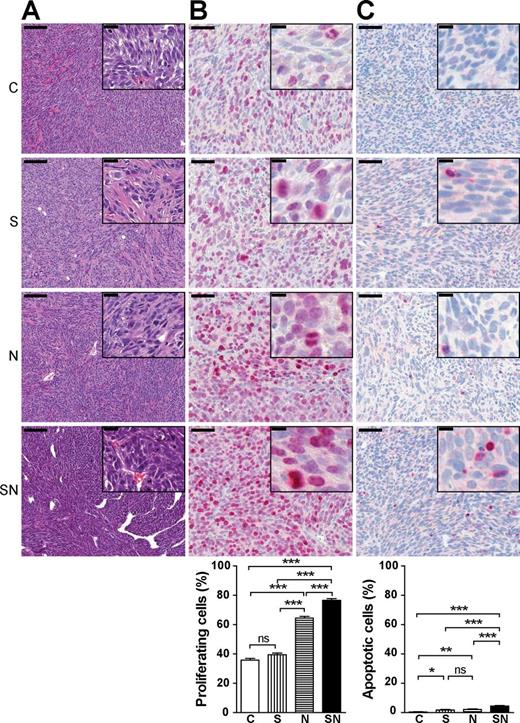
Survivin enhances MYCN-induced tumor growth by increasing the proliferation-to-apoptosis ratio. Paraffin-embedded tissue sections were analyzed for morphology, proliferation (Ki-67) and apoptosis (CC3) using immunohistochemistry. At least, 800 nuclei per tumor section were counted. The means ± SEM are shown. Statistical analyses were done using ANOVA followed by Tukey’s Multiple Comparison Test. *** P < 0.001; ** P < 0.01; * P < 0.05; ns, not significant. ( A ) Anaplastic features are most pronounced in SN tumors. Representative hematoxylin and eosin staining (scale bar: 100 µm. Inset, scale bar: 20 µm). ( B ) Tumors that overexpress both transgenes show markedly increased proliferation. Representative staining for Ki-67 (scale bar: 50 µm; inset, scale bar: 10 µm) and its quantification. ( C ) SN tumors display a slightly increased apoptosis rate. Representative staining for CC3 (scale bar: 50 µm; inset, scale bar: 10 µm) and its quantification.
Enhanced tumorigenicity is accompanied by HIF1α-associated vessel remodeling and enhanced aerobic glycolysis
As induction of angiogenesis is a hallmark of oncogenic transformation, we assessed tumor angiogenesis by staining for CD31, a marker of endothelial cells ( 27 ). Each section was screened for so-called microvessel hot spots, areas with the highest microvessel density. The number of vessels per hot spot was significantly decreased in tumors overexpressing both transgenes ( Figure 5 ). However, the decrease in overall vessel number was compensated by the larger size of many vessels in SN tumors, in line with the total endothelial cell area being similar in all groups ( Figure 5 ).
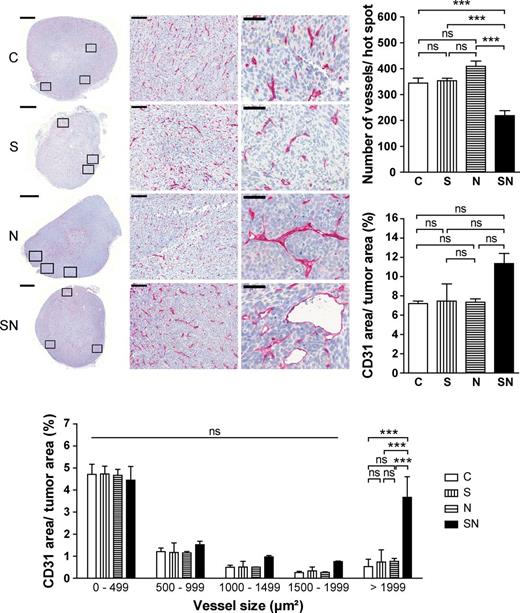
Survivin cooperates with MYCN to remodel tumor vasculature by increasing the number of large vessels. Representative staining for the endothelial marker CD31 showing an overview of the whole tumor section (left; scale bar: 1mm). Rectangles mark the three microvessel hot spots analyzed. Representative microvessel hot spots are shown in the middle (×200) and right (×600) panel (scale bars: 100 µm and 50 µm). The graphs show mean ± SEM of microvessel hot spots (top right), of total endothelial (i.e. CD31-positive) cell area (middle right) and of endothelial cell area after fractioning vessels according to their size (bottom). Statistical analyses were done using ANOVA followed by Tukey’s or Bonferroni Multiple Comparison Test. *** P < 0.001; ns, not significant.
An additional hallmark of cancer is the switch from oxidative phosphorylation, prevalent in normal cells, to aerobic glycolysis even in the presence of sufficient oxygen (the so-called Warburg effect ( 34) ). To evaluate the presence of the Warburg effect in vivo we first stained tumor sections for HIF1α and lactate dehydrogenase A (LDHA), key molecules in aerobic glycolysis ( 35 , 36 ). MYCN expression alone sufficed to upregulate both markers ( Figure 6A and B ). In tumors coexpressing MYCN and survivin expression of HIF1α and LDHA was clearly more pronounced and more homogeneously distributed across the tumor area ( Figure 6A and B ).
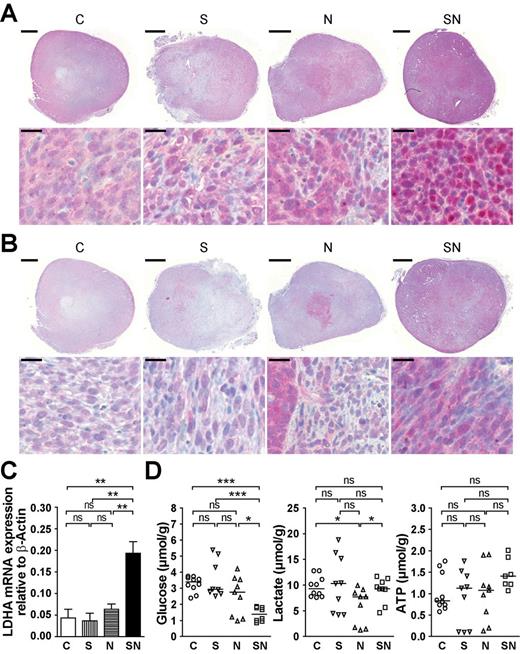
Coexpression of survivin and MYCN potentiates MYCN-induced aerobic glycolysis. ( A ) SN tumors exhibit the highest accumulation of nuclear HIF1α. Representative immunohistochemical staining for HIF1α showing an overview of the whole tumor section (top; scale bar: 1mm) and an enlarged view (bottom; scale bar: 20 µm). ( B ) Survivin and MYCN cooperate in enhancing LDHA expression. Representative immunohistochemical staining for LDHA showing an overview of the whole tumor section (top; scale bar: 1mm) and an enlarged view (bottom; scale bar: 20 µm). ( C ) LDHA messenger RNA expression levels are highest in SN cells. Representative quantitative reverse transcription–polymerase chain reaction analysis of stably transduced bulk cultures. The means ± SEM are shown. Statistical analyses were done using one-way ANOVA followed by Tukey’s Multiple Comparison Test. ** P < 0.01; ns, not significant. ( D ) Decreased glucose level at stable ATP and lactate levels in SN tumors. Glucose, lactate and ATP content in cryostat sections were measured by induced metabolic bioluminescence imaging. The dot plots show the individual values and the median. Mann–Whitney test was used for statistical analysis. *** P < 0.001; * P < 0.05; ns, not significant.
In C and S, HIF1α was moderately expressed both in cytoplasm and nucleus, whereas in N expression of HIF1α was stronger. N cells with increased HIF1α clustered in the center of the tumor. In SN, HIF1α expression was strongest, was localized predominantly in the nucleus and was present in cells distributed homogenously within the tumor ( Figure 6A ).
LDHA messenger RNA levels were significantly higher in SN transfectants compared with the other groups ( Figure 6C ). In contrast, messenger RNA of lactate dehydrogenase C, which is not implicated in the Warburg effect, remained at near undetectable levels in all groups (data not shown).
To extend these findings, we measured glucose, lactate and ATP in the tumor tissue by induced metabolic bioluminescence imaging. When comparing the tumors derived from C, S and N, there were no significant differences in any of the metabolites analyzed ( Figure 6D ). Notably, at similar ATP content, SN tumors displayed significantly lower glucose levels compared with all other groups suggesting a glycolytic phenotype. In spite of pronounced glycolysis, lactate levels were not increased in SN tumors compared with the other tumor groups. This implies that both outward transfer of lactate as well as lactate removal via the blood stream efficiently function in SN tumors.
Taken together, these data indicate that MYCN together with survivin induce tumors with larger, more mature blood vessels and altered metabolism shifted toward aerobic glycolysis, properties that correlate with increased tumor malignancy.
Discussion
We have shown that MYCN and survivin , two genes commonly overexpressed in diverse tumor entities including sarcomas, cooperate in malignant transformation of Rat-1 fibroblasts. Rat-1 fibroblasts have been successfully used in the past to investigate MYCN-induced transformation ( 33 ). The p21 promoter is hypermethylated in Rat-1 cells, thus abrogating p53 signaling ( 37 ). This signaling pathway is also deregulated in a broad range of human sarcomas by deletions and/or inactivating mutations of p53, amplification of MDM2 or overexpression of Twist1 ( 38 , 39 ). Of particular relevance, defects in the p53 axis may coexist with MYCN overexpression or amplification in sarcomas ( 40 , 41 ). The p53 signaling pathway is also defective in many NB, where p14 ARF and MDM2 are frequently inactivated or amplified, respectively ( 42 , 43 ). Thus, Rat-1 cells are a suitable cellular model to investigate transformative cooperation between MYCN and survivin.
Combined expression of MYCN and survivin in Rat-1 fibroblasts impacted on several hallmarks of cancer ( 27 ). First, it led to increased cell growth. Second, insensitivity to antigrowth signals was induced, as manifested by decreased contact inhibition. Third, anoikis resistance was enhanced, as shown by anchorage-independent growth. Fourth, metabolism was reprogrammed, as demonstrated by aerobic glycolysis. Fifth, angiogenesis was altered, as shown by vascular remodeling. Finally, in vivo , MYCN and survivin cooperatively reduced tumor latency and enhanced tumor growth.
Overexpression of MYCN stimulated proliferation of fibroblasts, similar to MYCN in neuroectodermal cells ( 44 , 45 ). Of note, concomitant expression of survivin increased growth rate of tumors in vivo , whereas survivin alone did not impact on proliferation. This may be explained by the fact that survivin maintains integrity of the mitotic spindle, thus promoting mitotic progression even under stress such as oncogene activation ( 46 , 47 ). In vitro, no effect of survivin on MYCN-induced hyperproliferation was observed, probably due to oversupply of proproliferative factors in the culture medium, a situation not present in vivo .
Survivin did not protect from MYCN-induced apoptosis in vitro . In vivo , antiapoptotic function attributable to survivin could not be appreciated as both constitutive and MYCN-induced apoptosis in the tumors were very low. Endogenous survivin levels may have been sufficient for maximal protection from apoptosis, rendering a further increase in survivin expression noneffective. This is in line with data showing that knockdown of survivin increased sensitivity of NB cell lines to apoptosis induced by serum deprivation ( 15 ). One might speculate that human transgenes are not fully active in rat cells and, as a result, the effect of sole expression of transgenic survivin is limited. However, MYCN and survivin are highly conserved in both species with an overall amino acid sequence identity of 85% in the case of MYCN and 83% in the case of survivin. The helix-loop-helix leucine-zipper of MYCN and the baculovirus IAP repeat domain of survivin, which are the functional domains, even share 97% and 92% identity, respectively, in-between both species. Moreover, Lens and coworkers ( 48 ) could rescue a survivin knockdown phenotype in murine fibroblasts by reexpressing human survivin.
MYCN and survivin cooperated in enhancing anchorage-independent and contact-uninhibited growth. The former facilitates early establishment of tumors and may enhance metastasis as well. It has been shown that survivin promotes metastasis via NF-κB- and Akt-dependent upregulation of genes involved in cell invasion and by FAK- and Src-dependent inhibition of anoikis ( 49 , 50 ). Together with contact-uninhibited growth, these acquired properties can explain the reduced latency in SN tumors.
Combined overexpression of MYCN and survivin transformed fibroblasts into markedly anaplastic sarcomas forming rapidly growing tumors in mice. In contrast, overexpression of MYCN led to tumors with less anaplasia that grew more slowly. Sole overexpression of survivin or mock-infection of Rat-1 cells led to slowly growing, differentiated fibromas. This finding may appear to be unexpected since Rat-1 cells are considered to be nontransformed. Moreover, this observation may seem to be inconsistent with the results of the focus formation and soft agar assays, where the empty vector-transduced cells did not show a transformed phenotype. However, these apparent discrepancies can be explained. First, in vitro assays may not perfectly model the situation found in vivo. Second, the RAG −/− /common γ-chain −/− mice employed in our study are severely immunocompromised and are thus not only permissive for growth of immortalized but also nontransformed cells ( 51 ). In contrast with our approach, tumorigenicity of Rat-1 fibroblasts was initially assessed in syngeneic Fischer rats with a fully functional immune system ( 52 ). As even transformed cells that engraft in immunocompromised animals may not grow in syngeneic animals, the observation that Rat-1 cells generate slowly growing masses in RAG −/− /common γ-chain −/− mice may not be surprising ( 53 ). Furthermore, a physiological niche supportive for fibroblasts was ensured in our experiments, as the Rat-1 transfectants were injected into the subcutis.
All experiments described in this article were performed with newly purchased, low passage Rat-1 fibroblasts and transfectants of the different groups were cultured in parallel. As morphology and growth properties of control cells did not change throughout the experiments, it is unlikely that the Rat-1 fibroblasts became transformed during culture.
Vascular remodeling was evident in the combination group. The larger vessel lumina observed may not only allow for increased blood flow by decreasing resistance but also appear to be more mature, i.e. less leaky. Both factors together may thereby enhance supply of nutrients and oxygen to tumors thus enhancing their growth.
Overexpression of MYCN but not of survivin induced a glycolytic phenotype. This phenotype was markedly enhanced in cells overexpressing both MYCN and survivin. Several findings favor the notion that the metabolic changes observed are manifestations of the Warburg effect rather than being the consequence of enhanced tumor growth and insufficient nutritional supply. First, hypoxic areas are generally located in the center of a tumor, but in SN tumors, HIF1α, which can be induced by hypoxia, was homogeneously expressed throughout the tumors, suggesting that hypoxia may only explain in part the metabolic changes observed. Furthermore, lactate did not accumulate in the cells of SN tumors, consistent with the Warburg effect, but not with insufficient vasculature that would impede lactate removal. Finally, expression of HIF1α and LDHA is known to be specifically linked with amplification of MYCN ( 29 ). The switch from oxidative phosphorylation to aerobic glycolysis increases the provision of building blocks necessary for hyperproliferation and may thus have contributed to the enhanced tumorigenicity of SN cells.
A limitation of this article is that experiments were performed in only one cell line. Generalization of the conclusions requires analyses of further cell lines and also transgenic mouse models, which is currently ongoing. Still, our data clearly show that MYCN and survivin cooperate in transformation of fibroblasts by inducing anchorage-independent, contact-uninhibited and increased cell growth, vascular remodeling and a metabolic switch to aerobic glycolysis. Certainly, these findings have to be validated in human primary material. Future analyses of human tumors known to overexpress MYCN and survivin will show whether their concomitant overexpression better predicts poor outcome than overexpression of either gene alone. It will be interesting to investigate whether these changes are mediated by stabilization of MYCN protein by survivin, similar to what has been described for MYCN and aurora kinase A (AURKA) or mutated anaplastic lymphoma kinase (ALK), or via modulation of expressed MYCN target genes by survivin ( 54 , 55 ). Taken together, the data presented here shed new light on the carcinogenesis of tumors with deregulated MYCN and survivin and delineate the direction of further investigations.
Supplementary material
Supplementary Materials and methods and Supplementary Data can be found at Supplementary Data
Funding
C. Beltinger received a stipend from the Deutsche Krebshilfe; N.I. Hipp received a complementary stipend from the International Graduate School in Molecular Medicine Ulm (funded by the Deutsche Forschungsgemeinschaft, GSC-270).
Abbreviations:
- ANOVA
analysis of variance
- CC3
cleaved caspase 3
- HIF1α
hypoxia inducible factor 1α
- LDHA
lactate dehydrogenase A
- NB
neuroblastoma
- RAG
Recombination activating gene.
Acknowledgements
The authors thank Susanne Lens, William Weiss and Martin Eilers for kindly providing the expression vectors, and Frank Leithäuser for assessing tumor histology and Hellmut Augustin for helpful discussions.
Conflict of Interest Statement: None declared.
References
