


Abstract
Subjects switched between tasks that rely on separable ‘low-level’ neural circuits, a motion and a color task. Using functional magnetic resonance imaging, we assessed anticipatory processes within these circuits during preparation to switch between tasks. Once the switch was made, we could then compare activation levels within the circuit associated with the newly relevant task to continuing activity in the circuit associated with the irrelevant task, allowing us to assess both the effectiveness of anticipatory switching mechanisms and the subsequent competition between alternative stimulus–response contingencies. Subjects prepared effectively for the color task, being equally fast and accurate on switch trials as on repeat trials, and this successful preparation was associated with robust preparatory activity within well-known color-processing regions. In contrast, subjects showed considerable behavioral costs when switching to the motion task, evincing a lack of effective preparation, borne out by the fact that motion circuits were silent during the preparatory period.
Introduction
Please count the number of occurrences of the letter o in this sentence. If you were kind enough to comply with this seemingly arbitrary request, you effortlessly switched from reading the text to interrogating the orthography for each occurrence of the letter o, and now you have switched back to reading again. Furthermore, you were able to switch to the counting task despite having just done a different task (reading) with exactly the same stimuli. That is, you did not perseverate and read the text a second time, but were able to instantiate a new task, perhaps one you had never done before (with those stimuli). Switching from one task to another in this way is central to our everyday, conscious experience, and yet little is known about how this critical function is accomplished by the brain.
The past decade has seen a dramatic increase in the study of the processes responsible for controlling behavior: so-called control processes. The paradigm most often used to study these processes is the ‘task switching’ paradigm. Subjects are given at least two tasks; on some trials they are required to switch from one task to the other, while on others they are required to perform each repeatedly. Jersild (1927) was the first to use this paradigm to conduct a systematic examination of control processes. In one of his experiments, he asked subjects to work through a list of two-digit numbers, adding 6 to each. Then he asked subjects to work through another list of two-digit numbers, subtracting 3 from each. Finally, he asked them to work through two more lists, regularly switching between these two tasks. When he compared the time it took them to complete the first two (single task) lists with the time it took them to complete the second two (switching) lists, he found a robust difference: subjects took far longer to complete the lists when they were required to switch than when they were not (this difference was only found when stimuli did not uniquely cue the task). This cost in performance when subjects are required to switch has been called the ‘switch cost’, and has been taken by many as an index of the time taken by control processes to switch the system.
While the procedures Jersild used have been improved upon (e.g. Rogers and Monsell, 1995; Meiran, 1996), the tasks typically employed have remained much the same. This is the case both in the behavioral literature (e.g. Hsieh and Allport, 1994; Mayr and Keele, 2000; Meiran, 2000b; Wylie and Allport, 2000; DeJong, 2001; Rubinstein et al., 2001; Nieuwenhuis and Monsell, 2002; Logan and Bundesen, 2003; Monsell et al., 2003; Waszak et al., 2003; Yeung and Monsell, 2003) and in the functional magnetic resonance imaging (fMRI) literature (e.g. Dove et al., 2000; Kimberg et al., 2000; Sohn et al., 2000; DiGirolamo et al., 2001; Brass and von Cramon, 2002; Dreher and Berman, 2002; Dreher et al., 2002; Gurd et al., 2002; Rushworth et al., 2002; Sylvester et al., 2003). Of course, there are good reasons for using stimuli and tasks that have antecedents in the literature, and this approach has provided important insights into how the cognitive system implements control. However, one of the features of tasks such as those described above is that they rely on very similar neural substrates. While this might not be an issue for purely behavioral studies (and can even be advantageous), tasks that rely on spatially distinct neural circuits can provide critical insights into the mechanisms underlying control when functional imaging techniques are applied. For instance, in previous work, we have shown that after stimuli have been associated with two tasks, the neural circuitry underlying both tasks continues to be active, even when one of the two tasks ceases to be relevant (Wylie et al., 2004). This suggested to us that some substantial portion of the ‘switch cost’ might be attributed to overcoming competition from the representations generated by each of the activated neural circuits.
Here, we tested this hypothesis further by using an event-related design in which subjects switched randomly between two tasks. On each trial, a cue was presented that informed the subject of the currently relevant task. After a preparation interval, the imperative stimulus was presented, and the subject responded. The imperative stimulus, which was a rotating, colored rectangle, was associated with two tasks: subjects judged whether it was rotating quickly or slowly (motion), or whether it was colored red or blue (color). Because the neural circuits underlying rotational motion and color discrimination are spatially distinct, this experiment allowed us to assess the following.
When preparing for each task, did subjects differentially activate any areas on switch trials relative to repeated-task (repeat) trials?
(a) When preparing for the color task, were the areas associated with color processing differentially active?
(b) When preparing for the motion task, were the areas associated with motion processing differentially active?
When performing each task, were the neural circuits associated with the irrelevant task active?
(a) When performing the color task, were areas associated with motion processing reliably active?
(b) When performing the motion task, were areas associated with color processing reliably active?
Another issue that this experiment was designed to address concerns a recent finding by Logan and Bundesen (2003). These researchers observed a confound in what has become the ‘classic’ cued task-switching paradigm. In this paradigm, subjects are given two or more tasks, and on each trial they are cued as to which task to perform. The cues for each task are unique to that task, and one cue is used for each task. Thus, although this paradigm was devised to study the effects of switching task, there are two things that change on trials when subjects are required to switch from one task to the other: (i) the task that subjects must perform; and (ii) the cue that informs them of this. Logan and Bundesen (2003) investigated whether this confound was important by using two cues for each task (experiments 3–5). This allowed them to assess performance when the cue changed but the task was the same as on the previous trial, and to compare this with performance on trials when both the cue and the task changed. They found a comparable performance decrement in both of these conditions, leading them to speculate that switch costs derive more from having to encode a new cue than from having to switch task. However, others (Mayr and Kliegl, 2003; Brass and von Cramon, 2004) have found a different pattern of results. These researchers found that while there was a behavioural cost associated with encoding a new cue (but repeating the same task), if both the cue and the task were changed the behavioural cost was larger. Furthermore, Brass and von Cramon (2004) found that the functional architecture of changing the cue alone was very similar to that associated with repeating both the task and the cue (except in the pre-SMA). Logan and Bundesen (2005) have proposed that the important difference between these experiments is that they used meaningful words as cues whereas others used arbitrary shapes or letters. One of the purposes of the current experiment is to test whether the fMRI results reported by Brass and von Cramon (2004) are found when words are used as cues.
To anticipate our results, we found a behavioral switch cost for the motion task, but not for the color task. This suggested that subjects were able to effectively prepare for the color task but not for the motion task. In accordance with this interpretation, (i) subjects activated the relevant neural circuits in response to a cue to switch to the color task, but (ii) not for the motion task. Furthermore, we found (iii) that regardless of the task subjects were performing, the neural circuits underlying both tasks were active, and (iv) that the neural circuits underlying each task were more active on switch trials than on repeat trials.
Materials and Methods
Subjects
Fourteen young (mean age ± SD = 24.5 ± 4.4), neurologically normal, right-handed subjects participated (nine women). All had normal color vision, and sufficiently good acuity to discriminate the stimuli without their glasses at the distance used. All provided written, informed consent. The behavioral data from one subject was lost due to equipment failure, and the fMRI data from this subject were therefore excluded from all analyses.
Apparatus
A Siemens 1.5 T VISION magnet was used for both the functional and anatomical data collection. Stimuli were delivered using an IFIS-SA stimulus-delivery system (MRI Devices Corp., Waukesha, WI), which is equipped with a head-coil-mounted 640 × 480 LCD panel. This shielded LCD screen is mounted on the head-coil, directly in the subject's line of vision. Head motion was minimized using the standard Siemens head-holder.
The generation and sequencing of stimuli and the collection of subject responses were accomplished using the Presentation® software package (Version 0.75, www.neurobs.com). This was run on a Dell® Latitude laptop that was interfaced with the IFIS system. Responses were collected using an MR compatible, two-button response pad (Lumina LP-400 response pad system; Cedrus®, www.cedrus.com). All subjects responded with the index and middle fingers of their right hand.
Stimuli
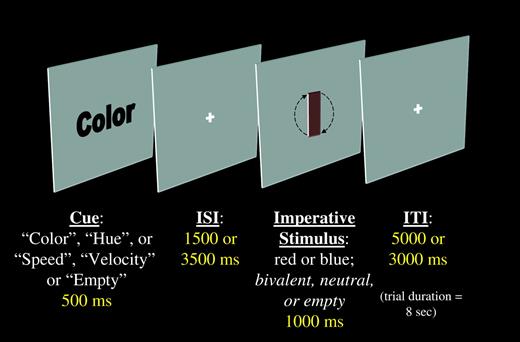
Examples of the stimuli can be seen in Figure 1. In order to enable us to assess switching task from switching cues (Logan and Bundesen, 2003), two cues were used for each task: ‘color’ and ‘hue’ were used to cue the color task; ‘speed’ and ‘velocity’ were used to cue the motion task.
A graphical depiction of the task sequence. Each trial began with a cue, presented for 500 ms. The cue could be the word ‘color’, ‘hue’, ‘speed’ or ‘velocity’. An inter-stimulus interval (ISI) ensued that was either 1500 or 3500 ms long. The imperative stimulus was then presented for 1000 ms. This stimulus could be either red or blue and could be rotating either quickly or slowly. Finally, an inter-trial interval ended each trial that was yoked to the ISI such that all trials lasted for 8 s.
There were three types of imperative stimulus: bivalent, neutral and catch. The bivalent stimuli were colored, rotating rectangles. In all cases, the rectangles were delimited by a black outline. The rectangles were tinted either red [the red, green, blue (RGB) values (range = 0–254) were {128, 100, 100}] or blue (RGB = {100, 100, 128}), and rotated either quickly [100 frames per second (f/s) at 10° per frame] or slowly (40 f/s at 10° per frame). The neutral stimuli were different for each task. When the task was to judge the color, the neutral stimuli were stationary, colored rectangles. When the task was to judge the speed of rotation, the stimuli were gray (RGB = {128, 128, 128}), rotating rectangles. Because the background of the display was the same shade of gray, these neutral stimuli appeared to be transparent. While the neutral stimuli lacked the competing stimulus dimension, the catch stimuli lacked both dimensions. That is, these stimuli were neither colored nor moving. Subjects were told to expect these stimuli and to simply press either key when they appeared.
Finally, a low-level baseline condition was included. This was an ‘empty’ trial. The cue presented was the word ‘Empty’, and no imperative stimulus was presented on these trials. Subjects were told to expect these trials and to simply wait until the next cue was presented.
Three sequences of stimuli were generated using the RFSgen program of the AFNI suite (Cox, 1996). This allowed us to ensure that the sequences would be amenable to deconvolution before the data were collected. Each subject was run using one of these three sequences, and the sequences were counterbalanced across subjects. In total, 325 trials were run, divided into 10 blocks (five blocks of 33 trials and five of 32 trials which were interleaved), which allowed for ∼12 observations in each condition (mean ± SD = 12.5 ± 4.35). There were 26 conditions, comprising the factorial crossing of cue (4), task (2) and stimulus-type (3), plus the ‘empty’ baseline condition on switch and repeat trials (2).
On each trial, a cue was presented for 500 ms, followed by a cue-to-target interval (CTI) that was varied between 1500 and 3500 ms. Both of these CTIs are sufficiently long to allow subjects to achieve maximal preparation for the forthcoming task (e.g. Rogers and Monsell, 1995; Meiran, 1996). However, varying the CTI in this way has been shown to allow for later deconvolution of the hemodynamic response associated with the cue (Weissman et al., 2002). The task stimulus was then presented for 1000 ms, followed by an inter-trial interval. In all cases, each trial lasted a total of 8 s.
Procedure
All subjects were informed about the tasks and the stimuli (bivalent, neutral and catch), and worked through one practice block (comprising 33 trials, containing at least one instance of each of the conditions). They were all asked to respond as quickly as possible, without sacrificing accuracy, and to maintain fixation throughout each trial. Performance was monitored, and subjects were required to work through additional blocks if it was clear they had not understood the instructions.
Each of the 10 blocks began with an instruction screen that reminded subjects of both the cues that were associated with each task and the response assignments for each task. This was presented for 7 s. Then a countdown from 3 to 1 was presented, with each number presented for 1 s. This initial 10 s (5 TRs), allowed the magnetic field to achieve a steady state. Following this period, the experimental trials were presented, and each block lasted ∼4.5 min. Between blocks, subjects were instructed to rest.
fMRI Data Collection
Information about the hemodynamic response evoked by the tasks was obtained using single-shot, T2*-weighted, echo planar imaging sequences on the Siemens 1.5 T. Images were acquired with a TR of 2 s, a TE of 50 ms and a 90° flip-angle. Each of the volumes consisted of 22 slices (voxel size = 3.91 × 3.91 × 5 mm; matrix size = 64 × 64 voxels), which allowed for whole-brain coverage. In each of the ten experimental blocks, 150 volumes were acquired. Prior to data analysis, the first five volumes of each block were discarded to account for the time needed for the field to achieve a steady state. Onset of the volume acquisitions was triggered by a TTL pulse generated by the Presentation® stimulus delivery software (www.neurobs.com). Thus, time (T = 0) is precisely defined for both the Siemens volume acquisitions and the beginning of stimulus delivery.
Anatomy
High-resolution whole brain images were acquired using the Siemens 1.5 T magnet with a 3D T1-weighted magnetization-prepared rapid gradient echo sequence. A total of 202 slices were acquired (voxel size = 1 mm3; matrix size = 256 × 256; TR = 11.6 ms; TE = 4.9 ms; flip-angle = 8°). These anatomical images were acquired for coregistration with the fMRI data.
fMRI Data Analyses
All images were realigned using AFNI (Cox, 1996), and any blocks in which the subject moved more than one voxel in any dimension or more than a degree in pitch, roll or yaw were discarded. Each raw time-series of signal strength for each subject was first time-shifted so that the slices were ‘aligned’ temporally (i.e. shifted so that the slices have the same temporal origin), and any linear trends in the data were removed. All of the volumes in the time-series were then spatially registered using an image midway through the time-series as the canonical image. All voxels outside the brain were eliminated from further analysis. The hemodynamic response was modeled by a delayed gamma function, and this function was coded into the design matrix as a regressor. This has been shown to be a robust method of estimating the hemodynamic response when the precise timing of the onset of the rise of the hemodynamic response is not known (Ollinger et al., 2001). Contrasts were specified using the General Linear Model.
A Priori Regions of Interest Analyses
Regions of interest (ROIs) were defined for each task. Previous studies have shown color processing to be associated with Brodmann areas (BAs) 18 and 19 (e.g. Brefczynski and DeYoe, 1999; Barrett et al., 2001; Tootell and Hadjikhani, 2001; Zeki et al., 1991; Wylie et al., 2004), and motion processing to be associated with the human homologue of MT (e.g. Tootell et al., 1995; Wylie et al., 2004). Here, we used these results to guide the formation of ROIs in each subject. For each subject, neutral color stimuli were compared with empty trials, thus approximating a color localizer. (This technique was used to account for individual variation in the areas used to perform the task.) However, this activation map included areas that were important in the performance of the color task, but were not associated with color processing per se (e.g. response-related areas). In order to exclude these areas, we used the results of previous studies (e.g. Zeki et al., 1991; Tootell and Hadjikhani, 2001). The resulting color ROI was then used as a mask — i.e. a template of areas associated with the color task — for later analyses. Similarly, neutral motion stimuli were compared with empty stimuli, and the activation in areas previously found to be important in motion processing was used as a mask for later analyses.
Data-led ROI Analyses
The regions identified in the a priori ROI analyses were then used as a mask to assess the more detailed aspects of the first questions this experiment was designed to address [When preparing for each task, did subjects differentially activate the relevant processing area(s) on switch trials relative to repeat trials?]. For instance, in the case of the color cues, first the data from the color switch cues were compared with data from the color repeat cues, then, in a second step, the color-processing ROI was used as a mask. This identified any activity that was present both when preparing to switch to the color task, and in response to the color stimuli [repeat color trials versus catch (empty) trials]. The same approach was followed with the motion cue data (i.e. the comparison of the motion switch cues to the repeat cues was masked by the comparison of the stimuli on repeat motion trials to the catch trials).
The second question (When performing each task, were the neural circuits associated with the irrelevant task active?) was addressed in a similar way to the approach used for questions 1a and 1b. The activity associated with the color task was assessed by comparing the activity on repeat color trials to the activity on catch trials. The activity associated with motion processing was assessed by comparing the activity on repeat motion trials to the activity on catch trials. We then assessed whether there were any areas that were active both during the performance of the color task and the motion task by using one activation map as a mask for the other. If the areas associated with the irrelevant task were persistently active, this would predict that areas associated with color processing should be active on motion-task trials and that areas associated with motion processing should be active on color-task trials. That is, areas associated with both tasks should be active on all trials. Thus, in the current analysis, there should be overlap of activation in areas associated with color processing and with motion processing (at the very least). While we used the results of previous studies to guide our interpretation of these data, we did not confine our analyses to these ROIs because we wanted to see the full extent of the overlap, which we expected would extend beyond color- and motion-processing areas.
For both phases of our analyses, the effects were assessed with t-tests that compared the activation pattern resulting from the relevant linear contrastto the null hypothesis across subjects (i.e. a random effects model). Regions of significant activation were defined as those in which each voxel exhibited a reliable change in activity across subjects [t(13) > 2.16, P < 0.05, uncorrected] in a 1152 mm3 region (equal to 18 voxels in the 4 mm3 resolution of normalized space). Monte Carlo simulations using normally distributed noise indicated <0.005% false positives with this statistical threshold.
Nomenclature
The introduction of a new variable calls for an addition to the descriptive vocabulary of the literature. In the task-switching literature, ‘switch’ trials have been understood to be those trials on which the task switches from one trial to the next and ‘repeat’ trials have been understood to be those trials on which the task repeats across successive trials. However, the condition introduced by Logan and Bundesen (2003), in which the cue switches but the task does not, requires a descriptor (see Table 1). Logan and Bundesen described this condition as ‘task repetition’, to be contrasted with ‘cue repetition’ in which both the task and the cue were repeated across successive trials. Mayr and Kliegl (2003) called the same condition ‘cue-switch’, which is more transparent, but — like the terminology introduced by Logan and Bundesen — is only informative relative to the descriptors used for the other conditions.
Nomenclature for conditions used in task-switching experiments
| Cue: | Same | Different | Different |
| Task: | Same | Same | Different |
| ‘Traditional’ | Repeat | N/A | Switch |
| (Logan and Bundesen, 2003) | Cue-repetition | Task-repetition | Task-alternation |
| (Mayr and Kliegl, 2003) | No-switch | Cue-switch | Task-switch |
| Current | Repeat | Synonym | Switch |
Here, we will refer to this condition as the ‘synonym’ condition, a descriptor that refers to the fact that the cue is physically different from the cue on the previous trial, but nevertheless has the same meaning (it is a synonym). The condition in which both the cue and the task switches across successive trials will be referred to as a ‘switch’ trial, and the condition in which the cue and the task are the same as on the previous trial will be referred to as a ‘repeat’ trial (see Table 1).
Results
Behavioral results
The response times (RTs) and error rates (ERs) were each initially analyzed with a 2 × 2 repeated-measures analysis of variance. The factors were task (color versus motion) and trial (switch versus repeat).
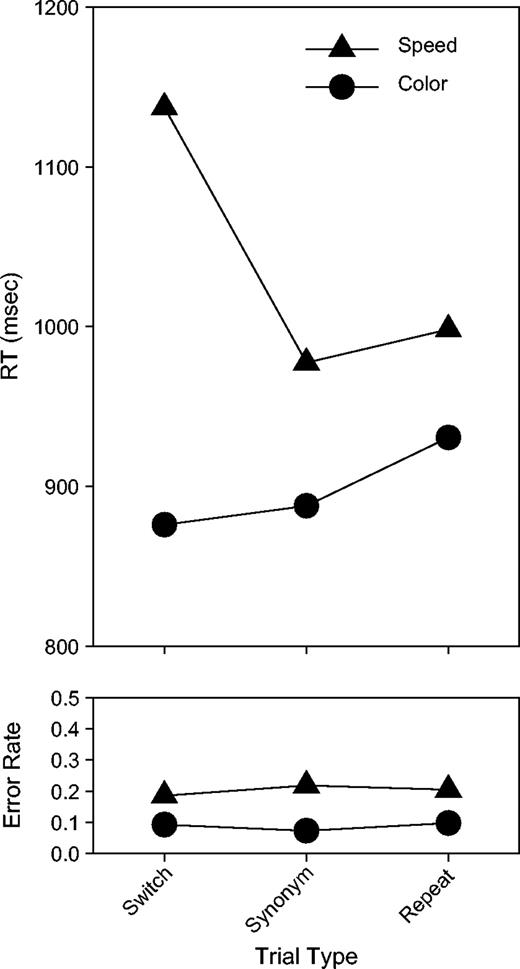
In the RT data (see Fig. 2), both the main effect task [F(1,12) = 46.62, P < 0.0001] and trial [F(1,12) = 7.77, P < 0.02] were reliable, as was the interaction [F(1,12) = 13.04, P < 0.005]. The effect of task was due to subjects responding with longer latencies when performing the motion task (1037 ms) than when performing the color task (898 ms). The effect of trial was due to subjects responding with longer latencies on switch trials (1007 ms) than on repeat trials (964 ms). The interaction reflected the fact that the effect of trial was entirely confined to the motion task. This was shown by running a paired, two-tailed t-test that compared switch and repeat trial RTs within each task. While there was a robust difference between switch and repeat trials in the motion task (1137 and 998 ms respectively; P < 0.005), there was no difference in the color task (875 and 930 ms respectively).
Behavioral results. Reaction time (RT) (top panel) and error rate (bottom panel) are shown separated by trial type (switch, synonym and repeat trials) and task (color and motion).
In the ER data (see Fig. 2), the only reliable effect was the main effect of task [F(1,12) = 13.84, P < 0.005]. This was due to subjects making more errors when performing the motion task than when performing the color task.
Unlike Logan and Bundesen (2003), who reported large differences between synonym trials and repeat trials (see also Mayr and Kliegl, 2003), no such differences were evident in these data in either task, in RT or in ER.
fMRI Results
Switch Cues versus Repeat Cues for the Color Task
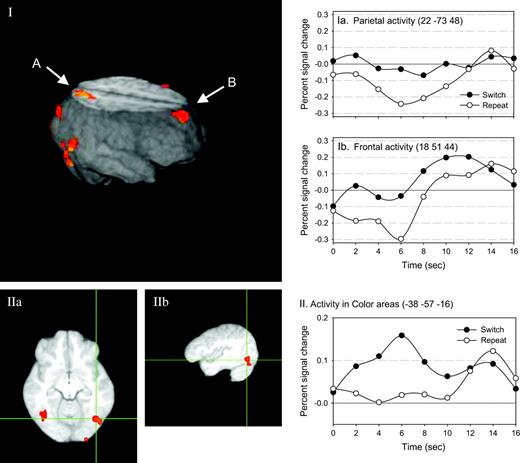
For this comparison, we first compared switch cues to repeat cues for the color task (see Fig. 3 and Appendix A). Then we masked this activation map with the comparison of the brain response when subjects were performing the color task on repeat trials to the brain response on ‘empty’ trials. This revealed areas that were active both when subjects were preparing to switch to the color task, and when subjects were actually performing the color task (see Table 2).
Switch versus repeat color cues. The activated regions associated with the comparison of color cues on switch trials to repeat trials is shown. In panel I, the activations are rendered onto a reconstruction of an average brain (the average of the anatomical scans for all 13 subjects). Several regions are shown, including parietal (A) and frontal (B) regions. The estimated impulse response function for each of the switch and repeat cues are plotted to the right for both the parietal (Ia) and the frontal (Ib) regions. Furthermore, panel I shows a ventral activation, in the fusiform gyrus, which is detailed in panels IIa and IIb (the axial and sagittal views, respectively). This region is the same region subjects use when performing the color task. The estimated impulse response function for switch and repeat cues are plotted at the right (II).
Areas active when color switch cues were compared with color repeat cues, masked by the activation associated with processing the imperative stimulus on color repeat trials compared with the activity on empty trials
| Anatomical area | Left hemisphere | Right hemisphere | ||||||||||||
|---|---|---|---|---|---|---|---|---|---|---|---|---|---|---|
| Talairach coordinates | t-values | Talairach coordinates | t-values | |||||||||||
| x | y | z | x | y | z | |||||||||
| Temporal | ||||||||||||||
| Inferior temporal gyrus (BA 37) | 46 | −65 | 0 | 2.360 | ||||||||||
| Fusiform gyrus (BA 37) | −38 | −57 | −16 | 2.599 | ||||||||||
The areas that showed reliable activation were left inferior temporal gyrus and fusiform gyrus. Importantly, the activity in fusiform gyrus has been repeatedly shown to be associated with color processing (Brefczynski and DeYoe, 1999; Barrett et al., 2001; Wylie et al., 2004). Wylie et al. (2004) found activity at −38, −53, −16 (x, y, z respectively), while here it was found at −38, −57, −16. This strongly suggests that subjects were activating this area in response to the cue on color switch trials.
Switch Cues versus Repeat Cues for the Motion Task
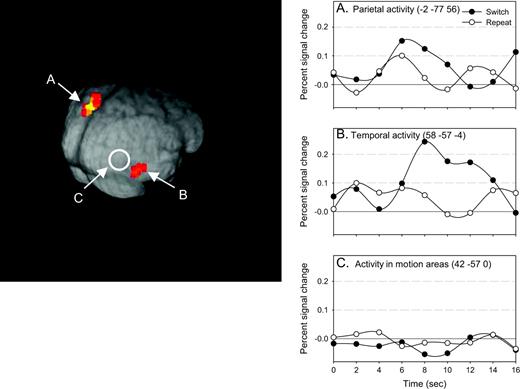
The comparison of switch and repeat cues for the motion task revealed two areas of activation (see Fig. 4 and Appendix B). However, when the same data-led ROI procedure was applied to the cues for the motion task, no overlap was found between the areas that were active in response to the cues and the areas that were active when subjects were performing the motion task.
Switch versus repeat motion cues. The two areas (parietal and temporal) that were reliably activated in the comparison of motion cues on switch trials to repeat trials are shown in the 3D reconstruction. The estimated impulse response function for switch and repeat cues are plotted at the right for three regions: parietal (A), temporal (B) and V5 (C).
Activity Characteristics of Motion and Color Processing Areas
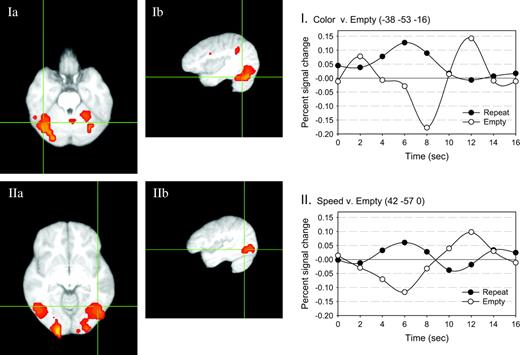
The overlap between the response to color, repeat stimuli and motion, repeat stimuli is shown in Figure 5 and Table 3. For this contrast, only the bivalent target stimuli were included. The areas of overlap included areas in superior frontal regions, parietal regions (both BA 40 and 7), and occipital regions. Importantly, these active regions included areas that are associated both with color processing (BA 18/19: ±38, −53, −16) and with motion processing (BA 37: ±42, −57, 0). In Table 3, these activations are subsumed in larger activated regions on the right (30, −61, −16) and on the left (−14, −93, 0). This replicates our previous finding of activity in areas associated with processing that had been relevant for a given stimulus-type, regardless of the task subjects were actually performing (Brefczynski and DeYoe, 1999; Barrett et al., 2001; Wylie et al., 2004).
Areas of overlap between the color and motion tasks. The activity associated with the repeat trials of each task were found, and then areas of overlap between the two activation maps were assessed. Two areas are shown. Panels Ia and Ib (axial and sagittal views, respectively) show activity in the same fusiform area that previous studies have shown to be associated with color processing. The estimated impulse response function associated with processing repeat and empty target stimuli are plotted at the right (I). Panels IIa and IIb (axial and sagittal views, respectively) show activity in a more dorsal and lateral area, that has been previously shown to be associated with motion processing. The estimated impulse response function associated with processing repeat and empty target stimuli are plotted at the right (II).
Areas of overlap between the comparison of color versus empty and speed versus empty
| Anatomical area | Left hemisphere | Right hemisphere | ||||||||||||
|---|---|---|---|---|---|---|---|---|---|---|---|---|---|---|
| Talairach coordinates | t-values | Talairach coordinates | t-values | |||||||||||
| x | y | z | x | y | z | |||||||||
| Frontal | ||||||||||||||
| Superior frontal gyrus (BA 6) | −2 | 7 | 48 | 3.447 | ||||||||||
| Precentral gyrus (BA 6) | −54 | 3 | 36 | 2.768 | ||||||||||
| Parietal | ||||||||||||||
| Superior parietal lobule (BA 7) | −26 | −61 | 40 | 2.839 | ||||||||||
| Inferior parietal lobule (BA 40) | −50 | −49 | 52 | 2.662 | ||||||||||
| Occipital | ||||||||||||||
| Cuneus (BA 18) | 6 | −93 | 8 | 2.463 | ||||||||||
| Lingual gyrus (BA 17) | −14 | −93 | 0 | 2.920 | ||||||||||
| Fusiform gyrus (BA 19) | 30 | −61 | −16 | 2.419 | ||||||||||
| Cerebellum | ||||||||||||||
| Culmen | −2 | −57 | −8 | 3.597 | 26 | −45 | −20 | 2.987 | ||||||
Activity Characteristics of Motion and Color Processing Areas as a Function of Switching
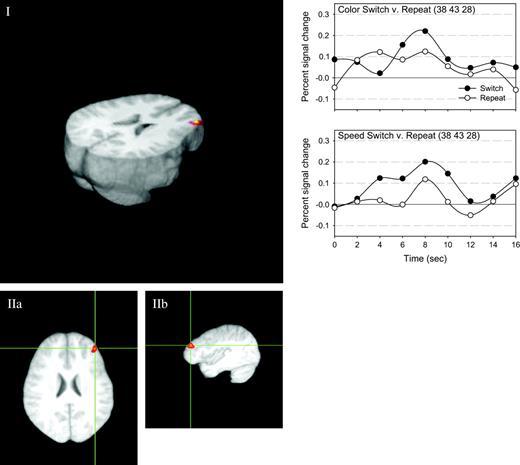
In order to assess whether there were any common areas that were more active on switch trials than repeat trials, we first compared switch trials to repeat trials for each task (for the color task and motion task, see Appendices C and D, respectively). Then, in a second step, we masked one activation map with the other. This showed that the only area that was more active on switch trials than repeat trials, regardless of which task was currently relevant, was an area in middle/superior frontal cortex (BA 9: 38, 43, 28). This is shown in Figure 6.
The single area of overlap between the comparison of switch versus repeat trials for each task. For each task, the activity associated with processing the imperative stimulus on the switch trial was compared with that of the repeat trial. This resulted in two activation maps (one for each task), and we then assessed whether there were any areas where there was activity, regardless of the task subjects were switching to. Only one area was found. Panel I shows this area on the 3D reconstruction of the average brain. Panels IIa and IIb show the axial and sagittal views of this activation. The estimated impulse response function for switch and repeat task stimuli are plotted at the right, both for the color task (above) and motion task (below).
Activity Characteristics of Switch and Synonym Cues
Logan and Bundesen (2003) have proposed that the ‘switch cost’ might have more to do with encoding a new cue than with switching per se. If this were the case, then there should be perfect overlap between the switch cue − repeat cue comparison and the synonym cue − repeat cue comparison. We therefore performed this analysis for both tasks, separately for the cues and the targets. There were no areas of overlap for the cues or for the targets of either task.
Correlation Analyses
In an effort to assess whether the activity found in the area associated with the irrelevant task had any behavioral importance, we performed two correlations. We began with the comparison of switch–repeat conditions, in response to the imperative stimuli, for each of the tasks. Then, for each subject, we extracted the activity value at the most active voxel in the area associated with the currently irrelevant task. That is, for the motion task, we extracted the activity at the most active voxel in color processing areas from the switch–repeat comparison for each subject. These values were then correlated with the behavioral ‘switch cost’ (i.e. switch–repeat) in response times for the currently relevant task (in this case, motion). This should reveal whether the ‘cost’ of switching to the motion task was at all related to the amount of activity in color processing areas (on switch trials relative to repeat trials).
For the motion task, there was a reliable correlation (Pearson correlation = 0.49, P = 0.04). For the color task, there was no reliable relationship. The positive correlation between the switch cost for the motion task and the activity in areas associated with color processing suggests that the activation in color areas might have led to the slowing of subjects' responses on the switch trials. However, the critical factor might have been the ratio of activity in color areas relative to the activity in motion areas. That is, if there was a great deal of activity in color areas but even more activity in motion areas, one might expect fast responses to the motion task. To address this, we reran the analysis, comparing the switch cost for each task to the ratio of the activity in the irrelevant processing area to the activity in the relevant processing area. In this case, we found a robust correlation for the motion task (Pearson correlation = 0.70, P < 0.01). As before, there was no reliable relationship for the color task.
Discussion
This experiment began from the idea that requiring subjects to switch between tasks that rely on spatially distinct ‘lower level’ neural substrates would provide a unique window onto the processes underlying both preparation to switch to a new task as well as performance of such a switch. The results supported this surmise. Behaviorally, a robust switch cost was found for the motion task, but none was found for the color task. While asymmetries in switch costs have been reported in the literature (Allport et al., 1994; Monsell et al., 2000; Yeung and Monsell, 2003), it is unusual for either task to show a complete absence of switch cost. This might be, in part, due to the fact that the tasks subjects switch between in task-switching experiments have not generally been chosen to ‘load’ on spatially distinct neural circuits (e.g. subjects might be asked to switch between categorizing numbers and letters: two tasks that rely on largely overlapping neural circuits). Here, however, it is clear that subjects were able to achieve the same level of performance on switch trials as repeat trials for the color task. That is, subjects appeared to be able to prepare for the color task to the same extent on switch and repeat trials. This was accompanied by robust activity in the neural circuits associated with color processing during the cue period on switch trials (relative to repeat trials). However, when subjects were switching to the motion task — a task associated with a robust switch cost — no such activity was found in the areas associated with performing the motion task. Together, these two observations suggest that if subjects are able to activate the neural circuitry associated with performing a given task prior to the presentation of the task stimuli, then they might be able to switch to that task without a cost to performance.
It is worth pointing out that the motion task might have been more difficult than the color task: RTs were longer and error rates were higher for the motion task than for the color task. This potential difference in task difficulty might have played some role in determining this pattern of results. For instance, perhaps a ‘difficult’ task is one that cannot be prepared for by ‘pre-activating’ the lower-level neural circuits. This possibility deserves further research.
This experiment replicates and extends a previous study of task switching (Wylie et al., 2004). The results of that experiment strongly suggested that one of the important contributors to the switch cost was that stimuli continue to be processed according to stimulus-response (S-R) mappings that were previously learned but are currently irrelevant. Thus, even when subjects knew that a particular task was never going to be required again in the experimental context, areas associated with that task continued to be active. Here we found a similar result: areas associated with both tasks were active on every trial, regardless of the currently relevant task. Furthermore, this activity appeared to have behavioral consequences. When subjects were performing the motion task, activity in areas associated with the (currently irrelevant) color task reliably correlated with the switch cost for the motion task. This strongly suggests that one important contributor to the speed with which subjects can switch task is the amount of competition from information in the processing stream associated with the currently irrelevant task.
Another aim of this experiment was to investigate whether the activation pattern associated with encoding a new cue was the same as that associated with encoding a new cue and switching task (Logan and Bundesen, 2003). In this experiment, the results did not support this hypothesis. For neither the cue nor the task were there any areas that were co-active in the switch versus repeat and the synonym versus repeat comparisons. While these results accord well with our behavioral effects — where the synonym condition appeared to be very different from the switch condition (and similar to the repeat condition) — our behavioral results appear to be at odds with those reported by Logan and Bundesen (2003) and by Mayr and Kliegl (2003). However, there were several methodological differences between our study and those conducted by other researchers, the most striking of which was that we used very long CTIs in this experiment. Whether this was the critical difference is a subject for future study.
Theoretical Implications
These results support the idea that subjects can do ‘something useful’ (Rogers and Monsell, 1995, p. 219) during the cue to target interval if they are allowed sufficient time to do so. But what is this useful thing? One idea is that it consists in the deactivation of irrelevant processing pathways, and the activation of relevant ones. The data only partially support this idea. If some ‘control’ mechanism in the brain had been able to disable the irrelevant processing pathways, we would have found no activation in areas associated with the irrelevant task. Contrary to this, we find robust activation in both color processing areas and motion processing areas, regardless of the task subjects were actually performing, and when a switch cost was found (for the motion task), the activity in the area associated with the irrelevant task (color) reliably correlated with the switch cost. However, the other half of this idea (that control processes activate the currently relevant processing pathway) appears to be supported by these data. In the case of the color task, subjects ‘pre-activated’ color processing areas in response to the cue, and this appears to have enabled them to switch to the color task with no switch cost.
The finding that subjects pre-activated color processing areas is partially compatible with models of executive function, which propose that executive processes ‘reconfigure’ the system. Inasmuch as the system was responsive to the cue (at least for the color task), it appears that something not unlike ‘reconfiguration’ occurred — though this reconfiguration consisted only in activating the relevant processing pathway. However, the lack of a similar activation in areas associated with motion processing poses something of a problem for reconfiguration accounts. Why was the system able to activate the color processing areas but not the motion processing areas? In order for this sort of account to explain these data, something must be added to the theory.
A different sort of theory, and one that we have favored in the past, suggests that control is achieved through ‘biased competition’ (Wylie et al., 2003b; for similar ideas, see Meiran, 2000a; Logan and Gordon, 2001). According to this sort of theory, when a stimulus is presented, it is processed by all of the processing pathways that have been associated with that stimulus (or stimulus type) in a given context (insofar as that is possible). These pathways then compete with one another, and the ‘winning’ pathway is the one that drives behavior. This competitive system is biased by a representation of the currently relevant goal, allowing the processing pathway associated with this goal to ‘win’ the competition (on most trials). This sort of theory is better able to account for these data. Because the stimuli in this experiment were used for both tasks, both color processing areas and motion processing areas should be active (and competing) on all trials. This prediction is supported by the data. Furthermore, this sort of theory does not propose that ‘control’ processes deactivate or inhibit the currently irrelevant processing pathway — if the currently irrelevant processing pathway is deactivated, this is the result of the competition with the currently relevant pathway. Thus, the finding that the currently irrelevant processing pathway does not appear to be deactivated also accords with this model. It is perhaps worth pointing out that the activity seen in the irrelevant processing pathway could be (i) activity associated with processing the stimulus; (ii) activity associated with actively attempting to inhibit the relevant pathway; or (iii) both. Based on Parallel Distributed Processing (PDP) models (e.g. Gilbert and Shallice, 2002; Braver et al., 2003), we assume that both are occurring. Furthermore, the finding that the activity in the color processing region covaries with the switch cost for the motion task provides physiological support for the contention that a large part of the switch cost — and a large part of what occurs on switch trials — consists in competition between the processing pathways associated with the two tasks. Finally, the finding that subjects appear to ‘pre-activate’ color processing areas is also consistent with this model. If the biasing of the relevant processing area were to begin prior to stimulus presentation, then the competition should favor that task when the imperative stimulus is presented. This view is consistent with our previous work, where we found electrophysiological evidence supporting the idea that subjects began competitive processes in anticipation of a switch of task (Wylie et al., 2003a). It is also worth pointing out that when subjects were switching to the color task, there was more activity in the middle/inferior frontal gyrus (−38, 19, 24) in response to switch cues than repeat cues. This replicates previous work that has shown this area to be sensitive to cues to switch task (Brass and von Cramon, 2002).
Unfortunately, just as ‘reconfiguration’ models need modification to account for the fact that subjects were only able to prepare for the color task, so too does the competition model. However, unlike reconfiguration models, the competition model can account for this discrepancy without proposing that executive control cannot, for some reason, be pre-emptively deployed for the motion task. For instance, one possible mechanism for early biasing is imagery: if subjects imagined the two possible colors during the CTI, this would have engaged color processing areas (e.g. Klein et al., 2000) and served to bias the system towards the color task before the imperative stimulus was presented. Why did they not do the same for the motion task? One possibility is that this task was not as easy to imagine as the color task. Alternatively, it could be the case that biasing motion was more difficult than biasing color, and that subjects therefore simply chose not to bias (prepare for) the motion task. These clearly very speculative interpretations require further investigation; however, they do offer plausible accounts of our data that are consistent with the competition hypothesis.
General Conclusions
In summary, we have found evidence that is consistent with the idea that effective preparation for a task is accomplished by ‘pre-activating’ the neural circuits that will be used to perform that task. We interpret these results as supporting a model in which performing one task rather than another is achieved through biased competition, and in which ‘pre-activation’ is understood as biasing in the absence of stimulation.
Areas active when color switch cues were compared with color repeat cues
| Anatomical area | Left hemisphere | Right hemisphere | ||||||||||||
|---|---|---|---|---|---|---|---|---|---|---|---|---|---|---|
| Talairach coordinates | t-values | Talairach coordinates | t-values | |||||||||||
| x | y | z | x | y | z | |||||||||
| Frontal | ||||||||||||||
| Superior frontal gyrus (BA 8) | 18 | 51 | 44 | 3.025 | ||||||||||
| Middle/unferior frontal gyrus (BA 48/9) | −38 | 19 | 24 | 3.447 | ||||||||||
| Inferior frontal gyrus (BA 47) | −22 | 7 | −16 | 3.537 | ||||||||||
| Precentral gyrus (BA 6) | −50 | 3 | 44 | 2.770 | ||||||||||
| Parietal | ||||||||||||||
| Precunius (BA 7) | 22 | −73 | 48 | 2.213 | ||||||||||
| Temporal | ||||||||||||||
| Superior temporal gyrus (BA 13) | −46 | −41 | 16 | 3.161 | ||||||||||
| Middle temporal gyrus (BA 21) | 54 | −61 | 0 | 2.411 | ||||||||||
| Fusiform gyrus (BA 37) | −38 | −57 | −16 | 2.599 | ||||||||||
| Occipital | ||||||||||||||
| Middle occipital gyrus (BA 19) | 30 | −85 | 20 | 2.265 | ||||||||||
| Fusiform gyrus (BA 19) | 42 | −65 | −12 | 2.516 | ||||||||||
| Cuneus (BA 18) | 14 | −93 | 12 | 2.319 | ||||||||||
Areas active when color switch cues were compared with speed repeat cues
| Anatomical area | Left hemisphere | Right hemisphere | ||||||||||||
|---|---|---|---|---|---|---|---|---|---|---|---|---|---|---|
| Talairach coordinates | t-values | Talairach coordinates | t-values | |||||||||||
| x | y | z | x | y | z | |||||||||
| Parietal | ||||||||||||||
| Precunius (BA 7) | −2 | −77 | 56 | 2.889 | ||||||||||
| Temporal | ||||||||||||||
| Middle temporal gyrus (BA 37) | 58 | −57 | −4 | 2.656 | ||||||||||
Areas active when color switch targets (imperative stimuli) were compared with color repeat targets
| Anatomical area | Left hemisphere | Right hemisphere | ||||||||||||
|---|---|---|---|---|---|---|---|---|---|---|---|---|---|---|
| Talairach coordinates | t-values | Talairach coordinates | t-values | |||||||||||
| x | y | z | x | y | z | |||||||||
| Frontal | ||||||||||||||
| (BA 6) | −46 | −5 | 44 | 2.192 | 50 | 7 | 40 | 2.612 | ||||||
| (BA 6) | −26 | 15 | 56 | 2.419 | ||||||||||
| Middle frontal gyrus (BA 10) | −26 | 55 | 20 | 2.185 | 34 | 55 | 20 | 2.312 | ||||||
| (BA 10) | 26 | 47 | −4 | 2.804 | ||||||||||
| (BA 9) | −42 | 31 | 36 | 3.791 | ||||||||||
| (BA 8) | 38 | 19 | 44 | 2.382 | ||||||||||
| Medial frontal gyrus (BA 10) | −6 | 55 | 4 | 2.255 | ||||||||||
| Parietal | ||||||||||||||
| Superior parietal lobule (BA 7) | −22 | −65 | 56 | 2.274 | ||||||||||
| Inferior parietal lobule (BA 40) | 46 | −57 | 44 | 2.413 | ||||||||||
| Temporal | ||||||||||||||
| Superior temporal gyrus (BA 41) | −58 | −25 | 8 | 2.644 | ||||||||||
| (BA 40) | 54 | −49 | 20 | 2.694 | ||||||||||
| Parahippocampal GYRUS (BA 19) | 18 | −49 | −8 | 2.831 | ||||||||||
| Occipital | ||||||||||||||
| Middle occipital gyrus (BA 9) | −46 | −77 | 12 | 3.035 | ||||||||||
| Limbic | ||||||||||||||
| Cingulate gyrus (BA 31) | −2 | −37 | 40 | 2.739 | ||||||||||
| Central | ||||||||||||||
| Postcentral gyrus (BA 5) | 6 | −45 | 72 | 2.284 | ||||||||||
| Basal ganglia | ||||||||||||||
| Caudate head | −6 | 7 | 4 | 2.840 | 18 | 15 | −4 | 2.340 | ||||||
Areas active when speed switch targets (imperative stimuli) were compared with speed repeat targets
| Anatomical area | Left Hemisphere | Right Hemisphere | ||||||||||||
|---|---|---|---|---|---|---|---|---|---|---|---|---|---|---|
| Talairach coordinates | t-values | Talairach coordinates | t-values | |||||||||||
| x | y | z | x | y | z | |||||||||
| Frontal | ||||||||||||||
| Middle frontal gyrus (BA 9) | 38 | 43 | 28 | 2.436 | ||||||||||
| Parietal | ||||||||||||||
| Postcentral gyrus (BA 40) | −54 | −33 | 48 | 2.289 | ||||||||||
| Cerebellum | ||||||||||||||
| Culmen | −34 | −37 | −28 | 2.823 | 22 | −29 | −32 | 2.626 | ||||||
The authors would like to acknowledge Ms Marina Shpaner and Mr Manuel Gomez-Ramirez for their dedicated and careful assistance in data collection and other technical issues. We would also like to thank Dr Nick Yeung for his insights during the planning phases of this experiment, and Drs Alan Allport and Adam Aaron for their helpful comments about aspects of the interpretation. This work was supported by grants from the National Institutes of Mental Health Institute (MH-63434 to J.J.F., MH-49334 to D.C.J. and MH-63915 to G.R.W.) and the Burroughs Wellcome Fund.
References
Allport DA, Styles EA, Hsieh S (
Barrett NA, Large MM, Smith GL, Michie PT, Karayanidis F, Fawdry R, Henderson D, O'Sullivan BT. (
Brass M, von Cramon DY (
Brass M, von Cramon DY (
Braver TS, Reynolds JR, Donaldson DI (
Brefczynski JA, DeYoe EA (
Cox RW (
DeJong R (
DiGirolamo GJ, Kramer AF, Barad V, Cepeda NJ, Weissman DH, Milham MP et al. (
Dove A, Pollmann S, Schubert T, Wiggins CJ, von Cramon DY (
Dreher JC, Berman KF (
Dreher JC, Koechlin E, Ali SO, Grafman J (
Gurd JM, Amunts K, Weiss PH, Zafiris O, Zilles K, Marshall JC et al. (
Hsieh S, Allport A (
Kimberg DY, Aguirre GK, D'Esposito M (
Klein I, Paradis AL, Poline JB, Kosslyn SM, Le Bihan D (
Logan GD, Bundesen C (
Logan GD, Bundesen C (
Logan GD, Gordon RD (
Mayr U, Keele SW (
Mayr U, Kliegl R (
Meiran N (
Meiran N (
Monsell S, Yeung N, Azuma R (
Monsell S, Sumner P, Waters H (
Nieuwenhuis S, Monsell S (
Ollinger JM, Corbetta M, Shulman GL (
Rogers RD, Monsell S (
Rubinstein JS, Meyer DE, Evans JE (
Rushworth MF, Hadland KA, Paus T, Sipila PK (
Sohn MH, Ursu S, Anderson JR, Stenger VA, Carter CS (
Sylvester CY, Wager TD, Lacey SC, Hernandez L, Nichols TE, Smith EE et al. (
Tootell RB, Hadjikhani N (
Tootell RB, Reppas JB, Dale AM, Look RB, Sereno MI, Malach R et al. (
Waszak F, Hommel B, Allport A (
Weissman DH, Woldorff MG, Hazlett CJ, Mangun GR (
Wylie GR, Allport A (
Wylie GR, Javitt DC, Foxe JJ (
Wylie GR, Javitt DC, Foxe JJ (
Wylie GR, Javitt DC, Foxe JJ (
Yeung N, Monsell S (
Author notes
1The Cognitive Neurophysiology Laboratory, Program in Cognitive Neuroscience and Schizophrenia, Nathan S. Kline Institute for Psychiatric Research, 140 Old Orangeburg Road, Orangeburg, NY 10962, USA, 2Department of Psychology, The City College of the City University of New York, North Academic Complex (NAC), 138th St and Convent Ave, New York, NY 10031 and 3Department of Psychiatry, New York University School of Medicine, New York, NY 10016, USA