


Abstract
Recent findings have demonstrated that a small set of highly connected brain regions may play a central role in enabling efficient communication between cortical regions, together forming a densely interconnected “rich club.” However, the density and spatial layout of the rich club also suggest that it constitutes a costly feature of brain architecture. Here, combining anatomical T1, diffusion tensor imaging, magnetic transfer imaging, and functional MRI, several aspects of structural and functional connectivity of the brain's rich club were examined. Our findings suggest that rich club regions and rich club connections exhibit high levels of wiring volume, high levels of white matter organization, high levels of metabolic energy usage, long maturational trajectories, more variable regional time series, and more inter-regional functional couplings. Taken together, these structural and functional measures extend the notion that rich club organization represents a high-cost feature of brain architecture that puts a significant strain on brain resources. The high cost of the rich club may, however, be offset by significant functional benefits that the rich club confers to the brain network as a whole.
Introduction
Healthy brain function depends on large-scale integration of information across brain regions, facilitated, and structured by the complex connectivity architecture of the brain's axonal pathways, the human connectome (Sporns et al. 2005). Previous studies using graph analytical tools to examine the topology of the mammalian brain network have shown the existence of a number of highly connected regions that occupy a central place in the overall architecture (Bassett et al. 2008; Hagmann et al. 2008; Bullmore and Sporns 2009). From the perspective of integration of information between brain regions, these putative structural “connectivity hubs” are of particular interest, as hubs are known to be crucial for efficient communication between different parts of a network and thus the integration of information from different sources. Indeed, studies have hypothesized a pivotal role of hubs in brain communication (Sporns et al. 2007; Hagmann et al. 2008; Bullmore and Sporns 2009; van den Heuvel and Sporns 2011; Zuo et al. 2011). Besides being individually highly connected, and therefore referred to as “rich,” brain hubs have been shown to be densely interconnected by rich club connections. This organization suggests that the rich club constitutes a coherent structural subnetwork in the mammalian brain: a densely and widely connected network core that plays a crucial role in attracting and integrating neuronal information across the brain (Zamora-Lopez et al. 2009, 2011; van den Heuvel and Sporns 2011).
With their high connection density and propensity to link regions over long distances, rich club connections have been suggested to form a high-cost feature of brain connectivity. It has also been suggested that their important role as global network shortcuts offsets their above average wiring cost (Bullmore and Sporns 2012; van den Heuvel, Kahn et al. 2012). Up until now, an estimation of the cost of rich club connections has been attempted solely in terms of physical connectivity, for example, the number of structural pathways (Zamora-Lopez et al. 2009, 2011; van den Heuvel and Sporns 2011; Harriger et al. 2012) and their density (van den Heuvel, Kahn et al. 2012). However, other structural and functional properties of brain connectivity may play additional important roles regarding the “cost” and “benefit” of a central rich club. For example, high levels of fiber density, long projection distances, and complex white matter microstructure may implicate not only a high demand on the brain's material resources, but may also confer several “advantages” in terms of promoting shorter communication relays. In this study, combining measurements obtained by diffusion-weighted imaging (DWI), magnetic transfer imaging (MTI), and functional magnetic resonance imaging (fMRI), we examined several structural and functional aspects of rich club organization in the human brain. Structural aspects included the examination of fiber density, projection distance, and aspects of white matter microstructure (e.g., fractional anisotropy [FA], myelination). Functional aspects of rich club connectivity included the strength of functional coupling and the level of signal diversity recorded at individual nodes. Using a multimodal functional/structural imaging design, we show that the brain's rich club is not only costly in terms white matter volume, but should also be considered high cost or “rich” in regard to other aspects of brain connectivity, including white matter microstructure, myelination levels and developmental trajectories, metabolic activity, structural–functional integration, and functional dynamics.
Materials and Methods
Subjects
Forty-two healthy subjects (age, mean/std: 29/8.0, m/f: 26/16) participated in this study, and gave written consent as approved by the medical ethics committee for research in humans of the University Medical Center Utrecht, The Netherlands. Participants were healthy adults selected from a running patient/control imaging cohort (van den Heuvel et al. 2013).
Image Acquisition and preprocessing
Participants underwent a 45-min scanning session on a 3-T medical scanner (van den Heuvel, Kahn et al. 2012), including an anatomical scan (T1), 2 DWI scans, an MTI scan, and a resting-state fMRI scan.
Anatomical T1-Weighed Image
A T1-weighed image (3D FFE using parallel imaging; TR/TE 10 ms/4.6 ms; FOV 240 × 240 mm, 200 slices, 0.75 mm isotropic voxelsize) was acquired. Gray/white matter tissue classification and automatic cortical segmentation was performed using the Freesurfer suite (V5, http://surfer.nmr.mgh.harvard.edu/) (Fischl et al. 2004), parcellating the cortex into 68 distinct brain regions (34 regions per hemisphere). For each of the 68 brain regions, the average level of cortical thickness (CT)—an estimate of the thickness of the cortical sheet—was computed, together with their level of cortical volume (CV).
Diffusion-Weighted Imaging
Two DWI sets of 30 weighted diffusion scans (b = 1000 s/mm2) and 5 × 2 unweighted B0 scans (b = 0 s/mm2) were acquired (DWI-MR using parallel imaging SENSE p-reduction 3; high angular gradient set of 30 weighting directions [Jones 2008], TR = 7035 ms, TE = 68 ms, EPI factor 35; FOV 240 × 240 mm, 2 mm isotropic, 75 slices). A second diffusion set was acquired with a reversed k-space read-out direction. DWI images were 1) corrected for possible susceptibility distortions by applying a field distortion map computed based on the 2 in opposite k-space readouts acquired b = 0 images (Andersson et al. 2003); 2) corrected for eddy-current distortions (Andersson and Skare 2002); and 3) realigned to the b = 0 image. DWI images were analyzed using a diffusion tensor imaging (DTI) model. A tensor was computed from the diffusion profile of each voxel using a robust tensor fitting method (Chang et al., 2005), and the preferred diffusion direction was computed as the principal eigenvector of the eigenvalue decomposition of the fitted tensor. Based on the eigenvalue decomposition of the tensor, several metrics of microstructural organization of white matter were computed, including: 1) the FA, a metric of global microstructural organization and often used as an estimate of the level of white matter integrity; 2) the level of axial or parallel diffusion (PD) expressing the amount of diffusion in the direction of the first eigenvector and a metric of local fiber orientation; 3) the level of radial or transverse diffusion (TD), expressing the amount of restricted diffusion in the direction perpendicular to the first eigenvector and an estimate of the level of myelination of white matter; and 4) the level of mean diffusion (MD), an estimate of the total level of diffusion within a voxel (Beaulieu and Allen 1994; Basser et al. 2000; Jones, 2008).
Magnetic Transfer Imaging
An estimate of local myelination content was examined through means of MTI. The MTI scan included the acquisition of 2 images (MTI, TE/TR = 2.19/65.8 ms, FOV 240 × 190 mm, matrix 128 × 128, flip angle 18, 95 slices of 2.5 mm), with the second image acquired with an additional off-resonance prepulse (3-lobe sync-shaped prepulse of frequency offset 1100 Hz, 620°) designed to excite macromolecules, which include myelin (Wolff and Balaban 1994; van Buchem 1999). The 2 volumes were realigned and the magnetic transfer ratio (MTR) value per voxel was computed as the percentage of signal loss due to the applied prepulse, computed as (Imt − Io)/Io, with Io referring to the nonprepulsed volume and Imt referring to the prepulsed volume. The level of MTR has been suggested to provide an estimate of the level of macromolecules (including myelin) present per voxel (Wolff and Balaban 1994; van Buchem 1999; Mandl et al. 2008).
Resting-State fMRI
Resting-state blood oxygenation-level–dependent (BOLD) signals were recorded during a period of 8 min using a fast fMRI sequence (3D PRESTO-SENSE p/s-reduction 2/2; TR/TE 22 ms/32 ms using shifted echo, flip-angle 9°; dynamic scan time 0.5 s, 1000 timeframes; FOV 256 × 256 mm, 4 mm isotropic voxel size, 32 slices). Volumes were 1) realigned to the last functional scan to correct for head movements, 2) co-registered with the T1 scan using SPM8 (http://www.fil.ion.ucl.ac.uk), and 3) corrected for influences of global signals and general movement by regressing out the global mean signal, the average ventricular signal, the average white matter signal and 6 motion parameters. No spatial smoothing was applied to the resting-state fMRI time-series to avoid inflation of local connectivity and local clustering (van den Heuvel et al. 2008). 4) Resting-state time-series were bandpass filtered (0.01–0.1 Hz) to select low frequency components of interest and to reduce the contribution of non-neural signal sources (including respiratory frequencies of ∼0.3 Hz and cardiac frequencies up to 1 Hz), and scrubbed to remove potential motion artifacts (Power et al. 2012). 5) Finally, for each of the 68 parcellated cortical regions, a regional averaged time-series was computed by averaging the time-series of the voxels included in each of the parcels. The level of functional coupling (generally referred to as “functional connectivity,” FC) of a connection between 2 nodes i and j was computed as the Pearson cross-correlation between the resting-state fMRI time series of i and j.
Connectome Reconstruction
For each individual dataset, the white matter pathways of the subject's brain network were reconstructed using deterministic streamline tractography, based on the Fiber Assignment by Continuous Tracking (FACT) algorithm (Mori and van Zijl 2002). Within each voxel in the brain mask (i.e., the total of white and gray matter), 8 seeds were started following the main diffusion direction from voxel to voxel, thus reconstructing the white matter fibers, until one of the stopping criteria was met, that is, 1) when the trajectory of the streamline left the brain mask, 2) when the streamline reached a voxel with a low FA value (<0.1) or 3) when the streamline made a sharp turn of >45°. Next, for each possible pair of brain regions i and j (i.e., nodes in the network), it was determined whether they were structurally connected by examining whether one or more streamlines from the total collection of reconstructed tracts touched both region i and region j. If 2 regions were determined to be structurally connected, their connectivity was marked by a 1 in the N × N adjacency matrix A, with N denoting the number of cortical regions (N = 68). If no streamline could be found between region i and j, A(i,j) was marked by a 0.
Rich Club Organization
By definition, Φnorm(k) >1 for a range of k is indicative of a rich club organization within a network (Colizza et al. 2006; McAuley et al. 2007). Next, significance of rich club organization over the group of subjects was assessed through means of statistical testing (Bassett and Bullmore 2009; van den Heuvel et al. 2010). Over the group of subjects, a 1-sample t-test was performed at each level of k to test whether Φnorm(k) exceeded 1, with P < 0.05 (corrected) taken to indicate statistical significance. Bonferroni correction was applied to correct for multiple testing across all examined levels of k (24 in total) (van den Heuvel et al. 2013).
Once rich club organization was established, the rich club level of each node in each individual subject was computed as the highest rich club level it participated in (i.e., degree >k), and nodes were ranked according to their rich club level. Over the group of subjects, the nodal ranks were averaged and the top 8 highest ranking nodes (i.e., 12% of all nodes) were selected as the rich club. The results of this 2-stage rich club selection procedure are highly consistent with previous studies performing rich club selection on the group level (van den Heuvel and Sporns 2011; van den Heuvel et al. 2013).
Rich club nodes, non-rich club nodes and rich club, feeder and local connections
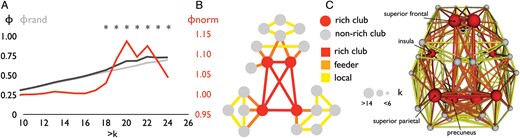
Definition of the rich club allows for the classification of the nodes of the network into rich club and non-rich club nodes (van den Heuvel and Sporns 2011). In turn, categorization of the nodes allows for the classification of the network connections into 3 classes: “rich club” connections, linking rich club nodes to each other; “feeder” connections linking rich club nodes to non-rich club nodes; and “local” connections linking non-rich club nodes to each other. Figure 1B presents a schematic illustration of the 2 classes of nodes and the 3 classes of connections.
Rich club organization. (A) Rich club curve Φ(k) averaged over the group of subjects (black line), rich club curve Φrandom(k) averaged over the group of subjects (gray line, mean of 1000 random networks per subject, averaged over the group of subjects), and the normalized rich club curve Φnorm(k) (i.e., the ratio between Φ(k) and Φrandom(k), red line). Figure shows a significant Φnorm(k) >1 (over the group of subjects, P < 0.05, Bonferroni) for k > 19 to k > 23. The rich club selected as the top 12% of nodes, matching k > 19. The selected rich club included bilateral precuneus, superior frontal cortex, insular cortex, and superior parietal cortex (red nodes in panel C). (B) Selection of the rich club allowed for the classification of the nodes of the network into rich club (red nodes) and non-rich club (gray nodes) members and a categorization of the connections of the network into rich club (red), feeder (orange), and local (yellow) connections. (C) Panel shows a graph plot of a group-average reconstructed structural brain network. Nodes reflect cortical brain regions. Connections between nodes represent reconstructed white matter pathways. Plot shows connections that were found to be present in at least 60% of the subjects (de Reus and van den Heuvel 2013). The size of the nodes reflects the number of connections (i.e., group-average degree) of each brain region.
Classification of the nodes and connections of the network allowed for the examination and statistical comparison of multiple aspects of brain connectivity. Combining information from DTI, MTR, structural T1, and FC measurements, several metrics of structural and functional architecture of 1) rich club nodes and non-rich club nodes and 2) of rich club, feeder, and local connections were examined.
Structural and Functional Properties of Rich Club Nodes
Cortical Thickness
For each individual dataset, the mean level of CT of rich club and non-rich club regions was computed as a metric of morphological organization. For each dataset, a CT value per node class was computed by averaging the level of CT across all nodes within a class. CT values were corrected for variation in regional volume of the regions, by regressing out the association between volume and thickness from the CT values within each dataset. Next, over the group of subjects, statistical comparison was performed between the 2 classes using permutation testing (see Statistical Assessment for details).
Functional Metrics
Using regionally averaged resting-state fMRI time-series, for each individual dataset, the level of node-specific “signal power” and “signal variation” were computed for each node, together with the number of suprathreshold functional connections of a node and its level of “functional connectivity diversity (FC diversity).” Signal power was computed as the sum of the squared signal levels. Signal variation—reflecting the variation of a signal over time—was computed as the coefficient of variance of the time signal. Signal power and divergence levels were corrected for the regional volume of the 68 nodes of the network. Similar to the CT values, for each individual subject, for each of the 3 metrics, an average rich club and non-rich club level was computed and tested for statistical difference over the group of subjects.
Number of functional connections
The ‘number of functional connections’ of a node was computed as the number of structural edges of a node (i.e., all connections present in the adjacency matrix A) that displayed a positive level of FC (i.e., higher than a threshold Tfc > 0) (van den Heuvel et al. 2008; Lynall et al. 2010).
FC diversity
Diversity in levels of functional coupling of the connections of a node was computed as the standard deviation across the FC values measured along its structural connections (Lynall et al. 2010), and compared across the class of rich club and non-rich club nodes.
Estimates of Aerobic Metabolic Activity of Regions
As reported in the article of Vaishnavi et al. (2011) different brain regions display different levels of metabolic energy use and aerobic metabolic activity during rest. To examine the metabolic activity of rich club versus non-rich club regions, a meta-analysis of regional energy metabolism and its relation to rich club organization was performed, by correlating data on rich club regions with data on regional metabolism, specifically data on the glycolytic index (GI), a measure of aerobic glycolysis (Vaishnavi et al. 2011). Spatial overlap between the Brodmann areas reported by Vaishnavi et al. and the anatomical template map used in this study (i.e., defining the nodes of the network) was determined by using the Talairach Daemon (TalD) (http://www.talairach.org/daemon.html). Similar to the analysis of the other node metrics, averages of regional GI values were computed for regions that spatially overlapped with rich club nodes, and regions that overlapped with non-rich club nodes. Next, similar to the other node metrics, possible differences in GI between the 2 node classes were examined using permutation testing (10 000 permutations, see Statistical Assessment for details).
Estimation of Myelination Maturation of Regions
Brain regions have been suggested to follow different maturational trajectories. This includes the order in which their white matter pathways myelinate during brain development. As discussed in detail in Glasser and Van Essen (2011), studies have mapped the myelination order of white matter regions, as measured directly in the white matter beneath the cortical sheet during brain development (Fuster 1997; Glasser and Van Essen 2011). Regionwise data describing a “maturation ranking” according to the order in which each region's tracts myelinate (Glasser and Van Essen 2011) was used to compute averages across rich club and non-rich club nodes. Spatial overlap between the regionwise maturational ranking map and cortical nodes as used in this paper was determined by using the Talairach Daemon. Next, similar to the evaluation of the other node metrics, an average was computed for the nodes in the rich club and non-rich club node class, and potential differences were examined for statistical significance using permutation testing (10 000 permutations, see Statistical Assessment for details).
Structural and Functional Properties of Rich Club Connections
Volumetric Coupling
Across the group of subjects, for each structural connection, structural coupling between brain regions was determined, computed as the between-subject correlation of the region-specific levels of CV. Volumetric coupling (VC) has been suggested to reflect aspects of structural connectivity between brain regions (He et al. 2007) and to reflect potential coherence in maturational trajectories of cortical regions (Raznahan et al. 2011). Computing the level of VC between all regions resulted in a N × N coupling matrix, with N the number of brain regions and with each cell reflecting a measure of VC between regions i and j.
White Matter Connectivity and White Matter Organization
Based on the DWI and the MTI data, multiple aspects of microstructural organization were examined. First, cost aspects of rich club connections that contribute to the spatial volume occupied by these pathways were examined. For each individual dataset, mean values of NOS and length were computed for the class of rich club, feeder and local connections by computing the mean over the connections belonging to each class, and tested for statistical difference using permutation testing (see Statistical Assessment) (van den Heuvel, Kahn et al. 2012). Second, metrics of microstructural organization of white matter were examined, including FA, PD, TD, and MD, as well as MTR, providing an estimate of the level of microstructural organization and myelination of white matter. Each fiber streamline crossed a number of voxels along its reconstructed trajectory, with each voxel characterized by measurements of the metric of interest (FA, PD, MD, TS, and MTR), and an average of the metric was computed for each streamline over all voxels. Next, for each connection present in the individual adjacency matrix A and for each metric, the average value over all streamlines comprising the connection was computed, which resulted in a weighted connectivity matrix for each individual subject, for each metric of interest. Finally, for each individual dataset, mean values for each metric were computed for each class of rich club, feeder and local connections by computing the mean over the connections belonging to each class, and tested for statistical differences (see Statistical Assessment below for details).
Functional Connectivity
For each dataset, the level of FC was determined for each structural edge in the group-averaged brain network, that is, a connection present in the adjacency matrix A (representing a structural pathway between region i and region j), with FC computed as the correlation between the resting-state time-series of the 2 connected regions. Over the group of subjects, the level of FC of rich club, feeder, and local connections was statistically assessed.
Structural–Functional Coupling, NOS, FA, and MTR
Studies have suggested an association between structural (SC) and functional connectivity (FC) in the macaque and human brain (Greicius et al. 2008; Hagmann et al. 2008; van den Heuvel et al. 2008; Adachi et al. 2012). For each individual dataset, the structural–functional coupling (SC–FC coupling) was computed as the correlation between the level of a metric capturing an aspect of structural connectivity and the strength of functional connectivity, across all connections that were present the adjacency matrix. Three aspects of structural–functional coupling were examined, including the correlation between the number of streamlines NOS and FC, the correlation between FA values of the connections and FC, and the correlation between connection-specific MTR values and FC. On the group level, differences in SC–FC coupling between rich club, feeder, and local connections were examined.
Statistical Assessment
Node Metrics
For analysis of node metrics on the individual level (i.e., functional signal power, signal divergence, CT), the metric values of rich club and non-rich club nodes across the group of individuals were first computed as the difference between the class averages of the rich club and non-rich club nodes. Then these values were compared with the differences obtained from 10 000 permutations in which nodes were randomly assigned to the 2 node classes. This procedure resulted in a null-distribution of values that could occur under the null hypothesis that rich club and non-rich club nodes do not differ. The original difference between rich club and non-rich club nodes was assigned a P-value as the proportion of random values in the obtained null distribution that were found to be more extreme.
Connection Metrics
For analysis on the group level (i.e., VC), comparison between the 3 classes of connections (i.e., rich club, feeder, and local connections) was performed using permutation testing. About 10 000 random sets of n nodes were selected from the collection of a total set of connections (with n the number of rich club nodes), and the average level of the metric of interest over all selected nodes was computed. A P-value was assigned as the percentage of the random values of the collection of permutation runs that were found to be more extreme. For statistical analysis of the connection metrics on the individual level (i.e., NOS, TD, PD, MTR, FC, and SC–FC metrics), a similar procedure as for the node analysis was performed. Permutation testing was used, randomly assigning the 3 connection classes across subjects across 10 000 permutations, obtaining a null distribution of differences that could occur under the null hypothesis stating that the classes of connections show no significant differences.
Results
Rich Club Organization
Confirming previous findings, the human connectome showed a rich club organization (Fig. 1A), as indicated by an above random level of connectivity between high-degree nodes. Figure 1A shows the rich club curve averaged over the group of subjects. Φnorm(k) was found to be significantly higher than 1 for k > 18 (P < 0.05, Bonferroni corrected). The brain's rich club, selected as the top ranking nodes across the group of subjects (matching k > 19 in Fig. 1C), included bilaterally the superior frontal gyrus, precuneus, insular cortex, and superior parietal cortex, confirming the results of a previous report (van den Heuvel and Sporns 2011). Selection of the rich club allowed for the classification of the nodes of the network into rich club and non-rich club members and a categorization of the connections of the network into rich club (red), feeder (orange), and local (yellow) connections. Figure 1B shows the schematic representation of the 2 classes of nodes and the 3 classes of connections. Figure 1C shows the spatial location of the rich club comprising the top 12% strongest connected nodes of the network (averaged across the group of subjects), matching the k > 19 level of rich club organization in Figure 1A, with the nodes and connections colored according to their node and connection class.
In what follows, we first describe structural and functional metrics related to rich club nodes, followed by metrics pertaining to rich club connections.
Node Metrics
Cortical Thickness
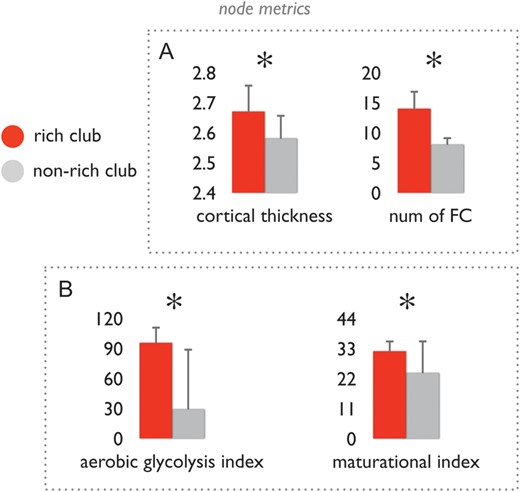
No difference was found in CT between rich club and non-rich club nodes (mean/std rich club: 2.606/0.082, non-rich club 2.595/0.090, P = 0.869) (Fig. 2). Correcting for differences in overall volume of brain regions (regressing out the effect of regional volume on the level of regional CT within each dataset) revealed a significantly higher CT of rich club regions as compared to non-rich club regions (mean/std rich club: 2.67/0.091, non-rich club 2.58/0.081, P = 0.0012).
Structural and functional aspects of rich club and non-rich club nodes. (A) Left bar graph shows the class-average levels of cortical thickness (corrected for differences in regional volume). Right bar graph shows the number of positive (Tfc > 0) functional connections of rich club and non-rich club nodes, showing that the number of functional connections of rich club nodes was significantly higher than that of non-rich club nodes. Error bars express variation of node class values over the group of subjects. (B) Bar graphs show the mean values of the class of rich club nodes and non-rich club nodes of the aerobic glycolysis index as taken from (Vaishnavi et al. 2011) and the maturational index as taken from (Glasser and Van Essen 2011). Data shows that rich club nodes display a significantly higher metabolic energy use as compared to non-rich club nodes, and a significantly longer maturational trajectory than non-rich club nodes. *P < 0.05 (permutation testing, 10 000 permutations). Error bars express variation of values over the group of included regions.
Functional Metrics
Signal power and variation
Variation of the time series of rich club nodes was found to be significantly higher than that of non-rich club nodes (mean/std (au) rich club: 2.74/0.49 | non-rich club: 2.42/0.46, P = 0.0374, 10 000 permutations). Rich club showed a marginal but significant increase in signal power in a frequency range (0.01–0.1 Hz) often associated with slow resting-state BOLD signal fluctuations as compared to the time series of the non-rich club nodes (mean/std (a.u.), rich club: 8.45/3.05 | non-rich club: 7.24/3.14; P = 0.14 ns).
Number of functional connections
Rich club nodes revealed a significantly higher number of structural connections (i.e., edges present in the adjacency matrix A) with a positive level of FC (i.e., suprathreshold functional connections, threshold Tfc > 0) as compared to the structural connections of non-rich club nodes (mean/std, rich club: 14/3.1, non-rich club: 8/1.7; P < 0.001). Using other thresholds (Tfc = 0.1–0.4, with increments of 0.1) revealed similar results, all showing a higher number of structural connections among rich club nodes showing a suprathreshold level of FC (Fig. 2).
FC diversity
Overall, no clear differences were found in diversity in FC levels of rich club and non-rich club nodes (P = 0.24). Examining the diversity of a subset of connections of the nodes showing suprathreshold connectivity (i.e., all edges in the adjacency matrix showing a Tfc > 0.2), revealed slightly higher levels of FC diversity of rich club nodes (0.14 | 0.017) as compared to non-rich club nodes (0.13 | 0.012), but with only marginal significance (P = 0.045).
Estimates of Aerobic Metabolic Activity of Regions
An exploratory meta-analysis of data on energy metabolism reported by Vaishnavi et al. (2011) was performed. The set of rich club regions exhibited significantly higher levels of the GI as compared to the set of non-rich club regions (P = 0.007; 10 000 permutations; Fig. 2).
Estimation of Myelination Maturation of Regions
A further exploratory meta-analysis was performed on the order in which the white mater pathways of regions become myelinated during brain development, based on a comparison of the distribution of rich club nodes with data reporting a regional myelination index across the cortex (Glasser and Van Essen 2011). Higher values of the maturational index indicate a longer myelination trajectory. On average, rich club regions showed a maturational index that was higher than that of non-rich club regions (P = 0.042; 10 000 permutations).
Connection Metrics
Volumetric Coupling
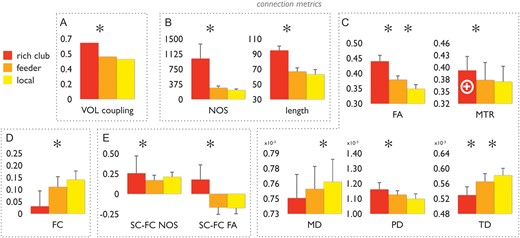
VC between regions connected by rich club connections (mean/std: 0.652/0.118) was found to be significantly higher (P < 0.001) compared with feeder (0.493/0.159) and local connections (0.455/0.1799) (P < 0.001 and P < 0.001, respectively; 10 000 permutations). VC along feeder connections did not differ from local connections (P = 0.22; 10 000 permutations).
Metrics of Physical Embedding: Number of Streamlines and Fiber Length
Rich club connections showed on average a higher NOS (P < 0.001 | P < 0.001) and included significantly longer fibers (rich club | feeder | local, mean/std 94.5/9.7 | 66.6/5.7 | 62.7/7.4; Fig. 3) as compared to feeder (P < 0.01) and local connections (P < 0.01), supporting earlier findings that rich club connections mostly span long distances and constitute a high-cost feature of brain architecture (van den Heuvel, Kahn et al. 2012). Feeder connections were also found to be significantly longer than local connections (P = 0.0086).
Structural and functional aspects of rich club, feeder, and local connections. Bar graphs show the class values of rich club, feeder and local connections. Data are shown for multiple metrics of structural and functional properties of rich club formation. Panel (A) shows the values of volumetric coupling, between rich club (red), feeder (orange), and local (yellow) connections. Panel (B) shows data on the number of streamlines (NOS) and projection length of the 3 connection categories. Panel (C) shows values of FA, MD, PD, TD, and MTR of rich club, feeder, and local connections. FA, fractional anisotropy; MD, mean diffusivity; PD, parallel diffusion, TD, transverse diffusion; MTR, magnetic transfer ratio. Panel (D) shows levels of functional coupling of all intrahemispheric connections (correlation between time series of the structurally connected regions); marks the inner core of the rich club, reflecting the connections between the left, right precuneus and left, right superior frontal cortex (see text). Panel (E) shows levels of structural–functional coupling (SC–FC), with SC based on the number of streamlines and with SC based on FA. Taken together, data show a significantly higher level of microstructural organization of rich club connections as compared to the classes of feeder and local connections (e.g., higher FA, lower MD and lower TD, higher SC–FC NOS/FA coupling). Error bars express variation (standard deviations) of measures for each connection class over the group of subjects. *P < 0.05 (permutation testing; 10 000 permutations).
Metrics of Microstructural Organization: FA, MD, TD, and PD
Across the group of subjects, the set of rich club connections displayed a significantly higher level of FA as compared to the level of FA of feeder and local connections (P < 0.001 | P < 0.001), suggesting a higher level of microstructural organization of rich club connections as compared to other connections in the brain network. Furthermore, feeder connections also showed a higher level of FA as compared to local connections (P < 0.001). To examine whether the observed higher FA was not just an effect of the longer distances of rich club tracts, 2 additional analyses were performed. 1) Examining the FA of only long-distance connections (>90 mm) revealed that FA values of long-distance rich club connections were also significantly higher than the FA values of long-distance local connections (P = 0.023 for feeder connections and P < 0.001 for local connections), underscoring that the high level of white matter microstructural organization is specific to connections linking rich club nodes. 2) Correcting FA measurements for influences of physical length by regressing out fiber length across all connections in each individual dataset still revealed significantly higher FA values for rich club connections as compared to local connections (P < 0.001), but not with respect to feeder connections (P = 0.15).
The MD of rich club connections showed no significant difference in comparison to feeder connections, and was significantly lower in comparison to local connections (feeder | local: P = 0.0879 | P = 0.0016; Fig. 3). Rich club connections showed significant lower TD as compared to both feeder and local connections (P < 0.001 | P < 0.001; Fig. 3), suggesting rich club connections to be more densely packed than feeder and local connections. Furthermore, higher levels of PD of rich club connections as compared to feeder and local connections were found (P < 0.001 | P < 0.001; Fig. 3). Feeder connections also showed marginally higher levels of PD as compared to local connections (P = 0.0428; Fig. 3).
Magnetic Transfer Ratio
Estimations of MTR (indicative of levels of myelination) were examined across the 3 classes of connections (mean/std rich club | feeder | local: 0.3824/0.0427 | 0.3765/0.0382 | 0.3703/0.0371). A marginally higher MTR of rich club connections was found as compared to local connections, but this effect was not significant (P = 0.17). No effect was observed when comparing rich club and feeder or feeder and local connections (P = 0.50 and P = 0.45, respectively. Examining the highest degree inner core of the rich club (i.e., selecting the regions occupying the highest rich club level, comprising the precuneus and superior frontal brain regions in both hemispheres, here referred to as RC+), did reveal significantly higher levels of MTR as compared to the set of local connections (P = 0.0014) and to feeder connections (P = 0.0014). Comparing feeder and local connections revealed no difference in the levels of MTR (P = 0.670; Fig. 3).
Functional Connectivity
The strengths of resting-state FC on structural rich club connections (mean/std: 0.113/0.062), structural feeder connections (0.096/0.045), and structural local connections (0.161/0.039) was examined. FC of rich club and feeder connections did not differ (P = 0.1494), but FC of feeder connections was significantly lower than that of local connections (P < 0.001). Examining only intrahemispheric structural connections, rich club connections showed significantly lower FC than both feeder (P < 0.001) and local (P < 0.001) connections (mean/std rich club | feeder | local 0.03/0.085 | 0.11/0.037 | 0.14/0.035). Feeder connections showed significantly lower FC than local connections (P = 0.0022; Fig. 3).
Structural–Functional Coupling
The strength of SC–FC coupling based on NOS was examined between rich club (mean/std: 0.25/0.19), feeder (0.16/0.07), and local (0.21/0.06) connections (Fig. 3). SC–FC coupling based on NOS was found to be significantly higher for rich club connections as compared to feeder connections (P = 0.0194), but was not different compared with local connections (P = 0.22). SC–FC coupling based on FA was found to be the highest for rich club connections (compared with feeder and local, both P < 0.001). No significant positive couplings were found for MTR SC–FC.
Robustness of Findings
To test for robustness of results pertaining to rich club organization against small changes in the configuration of the rich club, and thus the categorization of rich club and non-rich club nodes and rich club, feeder, and local connections (see below), 2 post hoc analyses were performed.
Analysis 1
To simulate small changes in rich club formation, one at the time, a member of the rich club was omitted. Next, connections were reclassified into rich club, feeder, and local based on this new definition of the rich club, and differences in connection metrics were recomputed.
Analysis 2
The rich club was selected at 1) a lower level of degree, resulting in a more liberal definition of the rich club (10 nodes, now including the right cingulate gyrus and the right lingual gyrus), and 2) a higher level of degree, resulting in a more conservative inclusion of nodes into the rich club (6 nodes, excluding the bilateral insula). Connections were re-classified and examined for possible differences in connection metrics between connection classes. Both analysis 1 and analysis 2 showed a high level of consistency with the main results reported in this article. This level of robustness is consistent with previous studies examining rich club organization (Harriger et al. 2012; van den Heuvel et al. 2013).
Discussion
Examining structural and functional aspects of rich club organization in the human brain, our findings support and extend the idea that the rich club, a set of highly interconnected high-degree regions, is a high cost feature of brain connectivity. Besides showing high density of connections and forming an integrated subnetwork, as previously suggested (Zamora-Lopez et al. 2010; Harriger et al. 2012; van den Heuvel, Kahn et al. 2012), our findings indicate that rich club nodes and connections exhibit high levels of wiring volume, high levels of white matter organization, high levels of metabolic energy usage, long maturational trajectories, more variable regional time series, and more positive inter-regional functional couplings.
Combining measurements of DWI, MTI, and fMRI, and several aspects of structural and functional brain connectivity of rich club organization were examined. Our findings support the observation that central brain hubs (e.g., Bassett et al. 2008; Hagmann et al. 2008; Buckner et al. 2009; Lynall et al. 2010; Tomasi and Volkow 2010; van den Heuvel et al. 2010; van den Heuvel and Sporns 2011; Zuo et al. 2011), in addition to being individually rich in terms of their overall number of connections, show above random levels of interconnectivity. The combination of these 2 topological features suggests that they form a topological central subnetwork or collective, the brain's rich club (Zamora-Lopez et al. 2009; van den Heuvel and Sporns 2011; Harriger et al. 2012). This dense organization of rich club connections was again found in the present study carried out on the regional scale, together with the observation of rich club connections (on average) showing the highest streamline count and spanning longer distances (Fig. 3) as compared to connections linking peripheral, i.e. non-rich club, nodes (van den Heuvel, Kahn et al. 2012; van den Heuvel et al. 2013). Going beyond these findings, the current study shows that rich club connections are characterized by several other “rich” or costly aspects of brain architecture. First, the class of rich club connections showed a high level of microstructural organization as compared to the class of feeder and local connections, as reflected by significantly higher levels of FA and low levels of MD and TD. In addition, the inner core of the rich club revealed a significantly higher MTR, indicative of a higher level of myelination of core rich club connections. Second, underscoring the cohesive character of the rich club as a dense structurally interconnected collective, rich club nodes were found to show a high level of VC. Positive levels of VC have been suggested to reflect aspects of structural connectivity (He et al. 2007) and the coupling of maturational processes (Raznahan et al. 2011). Third, a meta-analysis of regional energy metabolism revealed a significantly higher GI of rich club nodes as compared to peripheral nodes (Fig. 2), suggesting an above-average level of aerobic energy metabolism of rich club members as compared to other brain regions. Fourth, examining functional properties of rich club connections by analyzing resting fMRI time series revealed a larger number of functional connections of rich club nodes, as well as distinct functional dynamics of rich club and feeder connections as compared to connections linking local nodes. Fifth, a meta-analysis of maturational trajectories of the white matter closely associated with cortical regions (Fuster 1997; Glasser and Van Essen 2011) suggests a significantly longer maturational trajectory of white matter axonal pathways of rich club regions as compared to the pathways of non-rich club regions.
With its dense level of connectivity, the rich club has been noted to represent a relatively high-cost feature of neural architecture. However, offsetting its high wiring cost, it may confer several advantages to the network as a whole. It has been noted that rich club organization may ensure short communication relays (van den Heuvel, Kahn et al. 2012), provide a high level of robustness to random breakdowns (Paul et al. 2006) and be beneficial for maintaining a wide repertoire of functions and flexible dynamics (Bassett et al. 2012; Watanabe 2013). In this context, it is tempting to hypothesize that rich club formation in neural systems might be the result of a compromise between obtaining low levels of wiring cost on one side, and gaining high levels of performance on the other. Modern theories of neural network formation have indeed suggested that the architecture of neural systems may be driven by a potential “tradeoff” between cost of wiring and communication efficiency (Chklovskii et al. 2002; Laughlin and Sejnowski 2003; Kaiser and Varier 2011; Bullmore and Sporns 2012); ensuring high levels of both local and global information integration by creating short and efficient communication paths (Bassett et al. 2009; van den Heuvel et al. 2009), while at the same time conserving material resources (Laughlin and Sejnowski 2003; Kaiser and Hilgetag 2006). Our study provides additional support and further extends this idea of a cost-efficiency tradeoff of neural circuitry formation. High levels of white matter organization, as suggested by high levels of FA and MTR, may impose a high cost in terms of material resources, but they may also confer important advantages for information transmission between hubs of the brain. For example, high levels of myelination and more densely packed axonal pathways enable shorter and faster communication paths by promoting shorter transmission delays, which in turn may facilitate synchronous information processing, promote robustness, and reduce noise during communication (Laughlin and Sejnowski 2003; Kaiser and Hilgetag 2006; Bullmore and Sporns 2012).
Synchronization and information transfer between brain hubs might aid in the centralized processing and in the efficient integration of information between different functional domains of the brain. A high level of information integration taking place in rich club regions is supported by the findings of cellular studies examining the morphological features of intracortical connectivity, showing longer dendritic trees and higher spine density in “high-integration regions” (e.g., frontal BA 44, temporal BA 22, parietal BA 39, parietal BA 7) as compared to primary “low-integration” regions (e.g., primary visual BA 11, primary motor BA 4 and primary sensory BA 3,1,2) (Jacobs et al. 2001; Hutsler and Zhang 2010). Indeed, our finding of more diverse functional time series of hub regions may be indicative of a large repertoire of neural processing and interactions to take place in rich club regions. Furthermore, rich club connections, reflecting axonal pathways responsible for the transmission of information between the members of the rich club, displayed low levels of functional coupling during rest, as compared to connections between peripheral nodes. These observations suggest that the rich club does not form a single coherent functional community, but rather provides the infrastructure that allows the integration of information from different sets of functional domains of the brain at different times (Zamora-Lopez et al. 2010; van den Heuvel and Sporns 2011). As all of our current observations are limited to the brain “at rest,” reflecting an endogenous or intrinsic state of brain activity and connectivity, future studies examining the dynamic reconfiguration of the rich club during cognitive tasks and perturbations (Bassett et al. 2012; Fornito et al. 2012) are of high interest.
A more elaborate microstructural organization combined with a high traffic volume of neuronal communication in rich club regions would likely put high demands on energy consumption. Indeed, we note that rich club nodes tend to show a high overlap with regions that display high levels of metabolic activity. Studies examining the metabolic demand of brain regions showed a strong correlation between measures of metabolic activity and functional and structural brain organization (Varkuti et al. 2010; Vaishnavi et al. 2011). We therefore performed a meta-analysis of regional energy metabolism and its relation to rich club organization by correlating data on rich club regions and the metabolic data of Vaishnavi et al. (2011), specifically their data on the GI, a measure of aerobic glycolysis. The analysis revealed that rich club regions tend to show a distinct metabolic profile (Fig. 2). This observation is in line with an earlier meta-analysis indicating a positive correlation between the GI and measurements of cerebral blood volume, and high betweenness centrality in structural and functional networks (Bullmore and Sporns 2012; Liang et al. 2013). A further meta-analysis indicated that white matter associated with rich club regions matures over longer time spans. Ranking brain regions according to the order in which their white matter pathways myelinate during brain development (Fuster 1997; Glasser and Van Essen 2011) revealed that rich club regions, on average, show a maturational trajectory that is longer than that of non-rich club regions (Fig. 2), in particular the parietal members of the rich club. These findings tend to suggest that white matter tracts associated with rich club regions might be among the latest to mature during brain development.
Previous anatomical studies have noted the tendency of cortical hubs in the macaque brain to be “richly” connected (Goldman-Rakic 1988) and to form interlinked “hub complexes” (Sporns et al. 2007). Although caution is warranted when inferring direct homology of brain regions and connections across species (Sereno and Tootell 2005), observations of structural rich clubs in both the macaque (Harriger et al. 2012) and cat cortex (Zamora-Lopez et al. 2009, 2011) seem to highlight pathways and regions that have some overlap with the rich club of the human brain (Harriger et al. 2012). This high consistency of both the spatial as well as the topological properties of the rich club system across species may suggest a possible preservation of the rich club across species. Combined with recent evidence for a possible genetic control of functional brain network organization in both the adult (Glahn et al., 2010; Fornito et al. 2011) and adolescent (van den Heuvel, van Soelen et al. 2013) brain, these findings may point to a significant role for genetic factors in rich club organization as well as in its preservation across species.
Some methodological remarks can be made. First, in our analysis, multiple measurements of structural and functional connectivity of rich club formation on the macroscopic scale were examined using different variants of MR imaging. However, other, likely crucial, aspects of neuronal architecture remain out of reach for the imaging techniques used here. For example, studies examining axonal connectivity on the microscopic scale have suggested that axonal caliber, its ratio to thickness of the myelin sheet, as well as the distribution of axonal diameter across pathways play an important role in both the speed as well as the type of signal transferred between neurons (Schroder et al. 1988; Perge et al. 2009). New imaging techniques might provide more detailed in vivo measurements of axonal microstructure in the near future (Johansen-Berg and Rushworth, 2009; Jbabdi and Johansen-Berg 2011). These new techniques may provide more insight into the contribution of intra- and extracellular compartments to the diffusion signal, the presence and concentration of different types of macromolecules, including a more direct measurement of myelin content, and axonal diameter (Alexander et al. 2010). These future studies will allow further insights into the structural and functional aspects of the rich club, and a potential cost efficiency tradeoff of rich club formation in the human brain. Second, our results revealed a significantly higher level of functional coupling along structural local connections, as compared to structural rich club and feeder connections. It has been noted, however, that correlation estimates of functional coupling may be (to some extent) overestimated by spatial smoothing of fMRI data, an effect that may include a potential bias to our results as local connections were found to span shorter distances than rich club and feeder connections (Fig. 3). To exclude this potential confound, no additional spatial smoothing was applied in our study, but due to scanner-related properties, fMRI data are likely to display a certain level of inherent spatial smoothing. To examine the possible influence of this effect, a post hoc analysis was performed in which a spatial constraint was applied to the data. Examining only connections that had a physical length of longer than 90 mm (as measured by the length of the underlying SC connection, other cutoffs resulted in similar findings [van den Heuvel, Kahn et al. 2012]), functional coupling of local connections remained significantly higher than functional coupling of rich club connections (P = 0.006). Such low levels of functional coupling of rich club connections support the hypothesis that the rich club does not constitute a single functional community, but rather forms a distributed system across multiple communities that show, during rest, segregated levels of neural interaction (Zamora-Lopez et al. 2010; van den Heuvel and Sporns 2011; Harriger et al. 2012; van den Heuvel, Kahn et al. 2012).
In summary, our findings support and extend the notion that rich club organization represents a high-cost, but also high-value feature of human brain architecture. Offsetting its high cost, the rich club may facilitate high-volume and fast neural communication, and therefore promote efficient integration of information between remote parts of the brain network, processes known to play an important role in healthy brain functioning (Song et al. 2008; Bassett et al. 2009; Cole et al. 2012; Li et al. 2009; van den Heuvel et al. 2009; Zalesky et al. 2011).
Funding
M.P.v.d.H. was supported by a VENI (#451-12-001) grant of the Netherlands Organization for Scientific Research (NWO). O.S. was supported by the J.S. McDonnell Foundation. Funding to pay the Open Access publication charges for this article was provided by the Netherlands Organization for Scientific Research.
Notes
Conflict of Interest: None declared.