


Abstract
This study explored the effects of taste and oral anaesthesia on human sequential swallowing. Subjects were healthy adults (n = 42, mean age 28 years, 21 females), investigated by means of a water swallow test. Taste stimuli comprised quinine, glucose, citrus and saline solutions compared with neutral water. Oral anaesthesia comprised topical lidocaine at doses of 10, 20 and 40 mg and compared with placebo. Data were collected on swallowing speed (volume per second), inter-swallow interval and swallowing capacity (volume per swallow). Compared with water, glucose, citrus and saline reduced swallowing speed (10.94 ± 0.89 versus 9.56 ± 0.79, 9.33 ± 1.19, 9.37 ± 0.92 ml/s respectively, P < 0.05). Inter-swallow interval was increased only by quinine and saline (1.47 ± 1.11 versus 2.13 ± 0.34 and 1.92 ± 0.31 s, P < 0.04). Swallowing capacity was only marginally increased by quinine (P = 0.0759). Compared with the placebo, only 40 mg of lidocaine altered swallowing, immediately reducing the swallowing speed (7.89 ± 2.34 versus 10.11 ± 3.26 ml/s, P < 0.05) and increasing inter-swallow interval (1.67 ± 0.38 versus 1.45 ± 0.29 s, P < 0.01) without affecting capacity. By 15 min all measures except sensory thresholds had returned to baseline values. Thus, swallowing function is highly influenced by chemosensory input, providing insight into how oral sensation regulates pharyngeal swallowing.
Introduction
Swallowing constitutes a complex sequential sensorimotor activity, with both volitional and reflexive components, that is essential for maintaining survival and quality of life. Swallowing clears the oral cavity of saliva and propels ingested food to the stomach for digestion (Dodds, 1989; Miller, 1982). Swallowing simultaneously serves to protect the respiratory tract from aspiration and reflux events, and the digestive tract from potentially harmful compounds. Such is the significance of the swallowing process that, if impaired, it often leads to multiple complications, including aspiration pneumonia, malnutrition, dehydration and weight loss (Smithard et al., 1996). Mortality is high in patients with severely abnormal swallowing (dysphagia), such as those affected by neurological disease, so the implications for clinical management of patients with dysphagia are of critical importance (Cook and Kahrilas, 1999).
Sensation from the oral, pharyngeal and laryngeal regions includes a broad range of modalities, including two-point discrimination, vibrotactile detection, somesthetic sensitivity, proprioception, nociception, thermal sensitivity and chemical (taste) sensitivity (Miller, 1982; Ali et al., 1994). This input is conveyed via three cranial nerves innervating the muscles of the swallowing tract and includes the trigeminal nerve, the glossopharyngeal nerve and the vagus nerve, of which its superior laryngeal branch appears to be the most important to swallowing. Stimulation of any of these nerves can initiate or modulate a swallow (Miller, 1982); however, the most potent trigger is the superior laryngeal nerve, which is only matched by direct stimulation of the nucleus of the tractus solitarius (Car et al., 1975). Importantly, anaesthesia of areas innervated by these cranial nerve afferents will disrupt but not necessarily completely abolish the ability to swallow (Mansson and Sandberg, 1974).
The water swallow test has recently been evaluated and utilized as a reliable method for measuring swallowing performance in healthy subjects and patients with neurogenic dysphagia (motor neuron disease) (Hughes and Wiles, 1996). This methodology involves the careful timing of an individual's capacity to drink a set volume of water and recording the number of swallows taken. This then allows a calculation of the speed (volume taken per second) and capacity (volume taken per swallow) of swallowing and inter-swallow interval (ISI). The water swallow test has been shown to have excellent intra-individual reproducibility (Hughes and Wiles, 1996) but, in contrast to the modified barium swallow X-ray exam or videofluoroscopy, the water swallow test cannot directly study aspirative risk.
Since only limited data exist on the interaction between altered gustatory sensation and swallowing, the aim of the study was to objectively quantify, by means of the water swallow test, the effects of increased input via differing taste modalities and decreased input via anaesthesia on healthy human pharyngeal swallowing behaviour. Our hypothesis was that changes in sensory input with have differential effects on swallowing physiology.
Materials and methods
Subjects
Participants were healthy human adult volunteers (n = 42, mean age 28 years, 21 females). Participants were excluded if they had a previous history of swallowing difficulty, co-morbid neurological disease, inter-current illness or upper gastrointestinal disease necessitating regular medication. The study was presented to and approved by the Salford and Trafford Local Research Ethics Committee, and all subjects gave informed written consent before study.
Water swallow test
The timed water swallow test was performed according to the protocol described by Hughes and Wiles (1996). Briefly, each volunteer was asked to drink the contents (50 ml) in one cup ‘as quickly and as comfortably as possible’ while being precisely timed. Any residual water left over was then measured. The number of laryngeal elevations (swallows) was counted during this task. A stopwatch was started when the first drop of water touched the lip and stopped when the volunteer breathed after the last swallow. Thus, the water swallow test assesses sequential swallowing without any breaks for breathing during each measurment. The mean ISI was calculated as time to complete the task (s)/number of swallows during the task. Mean swallowing volume velocity (speed) was then calculated as volume drunk (ml)/time taken (s). Mean swallowing volume capacity was calculated as volume drunk (ml)/number of swallows. In initial pilot studies, our recordings confirmed the high intra-subject reproducibility of the water swallow test when repeated on either the same day or separate days previously reported by Hughes and Wiles (1996). We also made comparisons of the water swallow test with barium cup-drinking during videofluoroscopy in healthy subjects. Videofluoroscopy was carried out using a Siemens Fluorospot® H SIRESKOP SX Unit (Siemens Aktiengesellschaft Medical Engineering, Henkestrasse 127, D-91052 Erlangen, Germany) using 40% w/w thin barium liquid. X-ray images were acquired in real time at 30 frames/s using a Videomed DI TV system and recorded by digital video at 25 frames/s (Sony DHR 1000, Sony UK Ltd, Weybridge, Surrey, UK). Data were stored on digital cassette tape and reviewed off-line frame by frame (Panasonic UK Ltd, Bracknell, Berkshire, UK). Images were taken in the lateral view according to previously described protocols, the anatomical markers for imaging being the lips anteriorly, the cervical spine posteriorly, the nasopharynx superiorly and the upper margin of the thoracic oesophagus inferiorly. As with the water swallow test, subjects were asked to drink a 50 ml volume of thin barium using the same instruction, whilst recording the activity with the fluoroscope. When comparing these data with the water studies, we found that the evaluation of each swallow event was reliably recorded by assessing laryngeal elevation.
Taste solutions
Five different 50 ml water solutions at the temperature of 4°C were used: glucose (10% concentration), citrus acid (10% concentration), saline (0.9% concentration), quinine (0.5 mM concentration) and water. Each concentration of the sweet, sour, saline and quinine solutions were made up into 2 l of water and each bottle randomly labeled as solution 1, 2, 3, 4 or 5 by a research assistant who was not directly involved with conducting the water swallow tests. The identity of the solutions in each bottle was unknown to the experimenter. Solutions were prepared before the start of the experiment, and all bottles were refrigerated at the temperature of 4°C. Each solution was tested three times in a sequential, double-blinded, randomized manner.
Local anaesthesia of the oropharynx
Standard dose aerosol puffs (equivalent to 20 mg/dosette) of Lidocaine (Xylocaine Spray, AstraZeneca AB, Kings Langley, Hertfordshire, UK) were sprayed into the oropharynx of each subject, with the applicator being placed 4 cm aboral to the incisors in the midline. All subjects were given each anaesthestic dose once, prior to swallowing task [equivalent to 0 (placebo), 10, 20 or 40 mg of Lidocaine, respectively], randomized to different days. At the end of this application, the subject was asked to swallow rapidly three times to ensure adequate dispersion of the local anaesthetic, and then proceeded to perform the water swallow test.
Assessment of sensation
Sensation (before and after anaesthesia) was determined on each occasion by electrical stimulation using a 2 mm fingertip electrode (St Marks Pudendal Electrode, Medtronic Diagnostics A/S, Tonsbakken, Denmark) placed digitally onto each anterior faucial pillar. The electrode was connected to a constant current stimulator (Model DS7, Digitimer Ltd, Welwyn Garden City, Herts, UK), and the stimuli delivered via a trigger generator (Model DG2, Digitimer Ltd) at a frequency of 5 Hz (square wave duration 200 μs). The sensory threshold was defined as the mean intensity (in mA) across three measures each over both faucial pillars. For each faucial pillar stimulus, intensity was increased in a stepwise fashion in increments of 0.2mA from zero until the subject reported a ‘just perceived’ sensation. This was repeated six times, in a random order, across the right and left faucial pillars, three per side.
Visual analogue scales (VASs)
For taste, a VAS was presented to subjects after completing the swallowing tasks for each taste solution. Subjects were asked to identify the taste of the solution, rate its pleasantness or unpleasantness, and intensity. Participants rated pleasantness on a scale ranging from 0 (neutral) to 5 (extremely pleasant), or unpleasantness ranging from 0 (neutral) to 5 (extremely unpleasant). Intensity was rated on a scale of 0 (neutral) to 10 (extremely intense). Subjects were also asked to write down any additional comments concerning the solution. Details of the form were analyzed only after all data were collected to avoid identification of the solutions by the experimenter in this double-blinded trial.
Experimental protocols
Taste modulation of swallowing
In this study, 22 subjects (mean age 29 year, 11 male) were recruited. Each subject was seated in a chair while the procedure was explained. A beaker with one of the taste conditions was then offered to the subject. The subject was asked to complete the timed water swallow test as outlined above. Following completion of the task, the time taken to complete the task, the number of laryngeal elevations and any residual fluid in the beaker were noted. This was repeated two further times and the swallow measures recorded. At the end of the three swallows, the subject completed the taste VAS for pleasantness/unpleasant and intensity. A total of 15 water swallow tests were performed in each subject in a double-blinded, randomized manner.
Oral anaesthesia modulation of swallowing
In this study, 20 subjects (mean age 26 years, 10 male) were recruited. Each volunteer was studied for a period of ∼1 h on four separate occasions.
In each study, the subject performed a baseline water swallow test with water at 4°C as described above. Following this, sensory thresholds were elicited from the faucial pillars of each side using a St Marks electrode and the measurements recorded. Thereafter, the topical anaesthesia was then applied at one of four doses, randomized to separate days. Following the application of the anaesthesia, both water swallow tests and sensory thresholds were performed immediately afterwards, then at intervals of 15, 30, 45 and 60 min.
During the both studies, care was taken to observe, detect and document whether any subject displayed any signs of aspiration or dysphagia. Indicators such as coughing, dyspnoea, throat clearing, changes in voice and leakage of oral contents were designated as clinical indicators of aspiration and dysphagia as a result of the interventions.
Data analysis
Swallowing data (velocity, capacity and ISI) were expressed as means ± SEM. For the taste study, data collected for each of the five solutions were compared and analysed using repeated-measures analysis of variance (ANOVA). Means between samples were then compared using one-way ANOVA. For the anaesthesia study, swallowing data were analysed again using the repeated-measures ANOVA. A one-way ANOVA was then used to assess the effects of dose and paired t-test to determine the effects of time. Faucial pillar sensation data were grouped and averaged for each subject for both right and left, and mean values for the whole sample were then calculated and used for analysis. A P value of ≤0.05 was taken to denote that a statistically significant effect was present.
Results
All subjects tolerated the water swallow tests without overt difficulty. No clinical signs of aspiration or dysphagia were observed across either of the studies. Subjects were able to ingest the full volumes of test solutions, with no residue remaining in the beakers.
Taste
Pleasantness/unpleasantness/intensity ratings
Figure 1A,B shows the means of the VAS ratings of pleasantness and unpleasantness on a scale of 0–5 for each taste modality, and intensities on a scale of 0–10. Only one subject perceived water as being unpleasant. In contrast, the quinine solution was mostly perceived as an unpleasant stimulus, with a mean unpleasant score on the VAS of 3.81. Interestingly, a small number of subjects (21%) rated it as pleasant though the scores were towards the lower end of the scale. Almost all subjects (96%) perceived the sweet solution as pleasant. The citrus solution generated a mixed response, with 24% rating it as pleasant but 33% rating it as unpleasant, and 43% rating it as both pleasant and unpleasant. The saline solution was mostly perceived as unpleasant (91%).
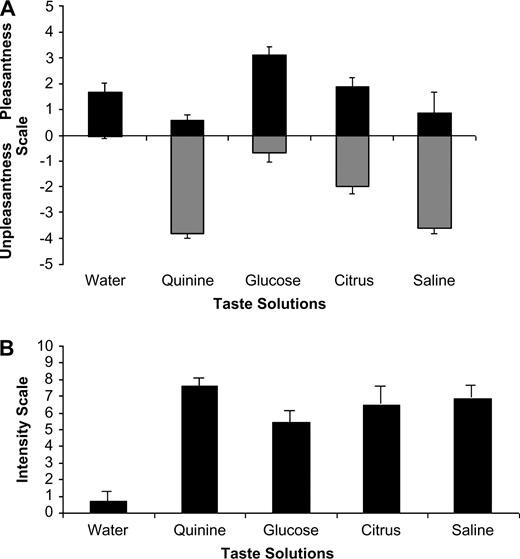
(A) Bar chart showing the group (mean ± SEM) levels of pleasantness and unpleasantness to each of the different tasting solutions according to a VAS. (B) Bar chart showing the group (mean ± SEM) intensity scores (strength of taste) for each of the different tasting solutions according to a VAS.
The intensity rates of each taste (Figure 1B) were more consistent, with highest intensity ratings reported for quinine, followed by saline, then citrus and finally glucose. Water evoked a mean intensity rating close to 0.
Swallowing capacity
The mean swallow capacities across the group for the five taste solutions are shown in Figure 2. Repeated measures ANOVA revealed a significant effect of taste on swallowing capacity (P = 0.0079, F = 3.71). However, a one-way ANOVA using water as the control showed that only the bitter solution approached significance (P = 0.0759), while the sweet, sour and salty solutions had little effect on swallow capacity. This implies that the significant differences between solutions seen with repeated ANOVA were between two different solutions outside of water alone.
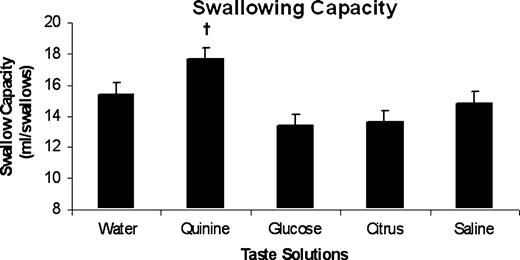
Bar chart showing the group swallowing capacity data (mean ± SEM) for each of the taste solutions: water (neutral), quinine (bitter), glucose (sweet), citrus (sour) and saline (salty). There was no strong effect of different tastes on swallowing capacity across the group. Quinine had a marginal probability of significance (†P = 0.0759).
Swallowing speed
The mean swallow speeds across the group for the five taste solutions are shown in Figure 3. As with swallowing capacity, repeated-measures ANOVA yielded a significant interaction effect of taste on swallowing speed (P = 0.0098, F = 2.83). Furthermore, when comparing between individual solutions with water as the control using one-way ANOVAs, sweet (P = 0.0404), sour (P = 0.0173) and salty (P = 0.02) solutions all reduced swallowing speed. The quinine solution had the weakest effect (P = 0.051).
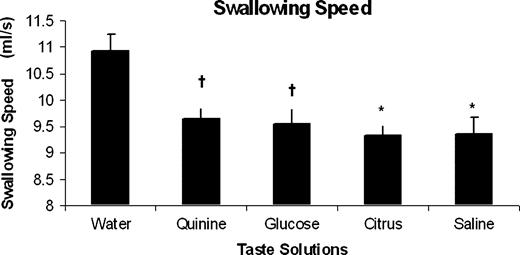
Bar chart showing the group swallowing speed data (mean ± SEM) for each of the taste solutions: water, quinine, glucose, citrus and saline. Compared with water, it can be seen that all taste solutions altered swallowing behaviour by reducing swallowing speed. (*P ≤ 0.02, †P ≤ 0.05).
Inter-swallow interval
Mean ISI data across the group for the five taste solutions are shown in Table 1. Again repeated-measures ANOVA revealed a significant effect of taste on ISI (P = 0.0069, F = 3.55). However, when compared with water, only quinine and saline increased ISI (P = 0.0025 and 0.0365, respectively).
Group ISIs (mean ± SEM) across each taste condition
Taste solution | ISI (s) |
|---|---|
| Water | 1.47 ± 0.11 |
| Quinine | 2.13 ± 0.34* |
| Glucose | 1.49 ± 0.10 |
| Citrus | 1.60 ± 0.10 |
| Saline | 1.92 ± 0.31* |
Taste solution | ISI (s) |
|---|---|
| Water | 1.47 ± 0.11 |
| Quinine | 2.13 ± 0.34* |
| Glucose | 1.49 ± 0.10 |
| Citrus | 1.60 ± 0.10 |
| Saline | 1.92 ± 0.31* |
P < 0.04, one-way ANOVA.
Anaesthesia
Sensation
Sensation thresholds to faucial pillar electrical stimulation are shown in Table 2. Sensation was significantly reduced, using the repeated-measures ANOVA (P < 0.01, F = 4.1) Moreover, the one-way ANOVA confirmed faucial pillar sensation was effected following the 20 and 40 mg doses of Lidocaine (P = 0.048 and P = 0.012, respectively), but not following the 10 mg dose. Paired t-tests showed that 40 mg altered sensation for at least 60 min (P < 0.05), whereas 20 mg only affected sensation for the first 30 min after application (P < 0.05).
Group faucial pillar sensory thresholds (mA, mean ± SEM) to electrical stimuli across each anaesthetic dose for each time point
Anaesthesia dose (mg) | B/L | Immediate | 15 min | 30 min | 45 min | 60 min |
|---|---|---|---|---|---|---|
| 0 | 2.95 ± 0.12 | 2.91 ± 0.13 | 2.93 ± 0.14 | 2.96 ± 0.13 | 2.88 ± 0.13 | 2.91 ± 0.14 |
| 10 | 3.07 ± 0.23 | 3.24 ± 0.19 | 3.10 ± 0.17 | 3.04 ± 0.15 | 2.95 ± 0.16 | 2.89 ± 0.15 |
| 20 | 2.80 ± 0.14 | 3.07 ± 0.19* | 3.11 ± 0.18* | 2.96 ± 0.14* | 2.94 ± 0.16 | 2.93 ± 0.14 |
| 40 | 2.83 ± 0.16 | 3.21 ± 0.19* | 3.14 ± 0.17* | 3.12 ± 0.17* | 3.18 ± 0.16* | 3.10 ± 0.17* |
B/L = baseline.
P < 0.05, paired t-test.
Swallowing capacity
The mean swallow capacities across the group following oral anaesthesia are shown in Figure 4. There was no significant effect of anaesthesia, at any of the doses applied, on swallowing capacity.
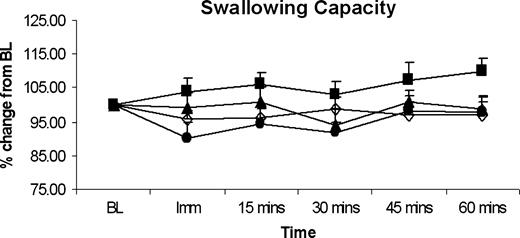
Histographic plots of group data, showing percentage change from baseline measures for mean swallowing capacity over time for different levels of topical anaesthesia. Lidocaine doses are shown at 0 mg (placebo; open diamond), 10 mg (closed square), 20 mg (closed triangle) and 40 mg (closed circle). Oral anaesthesia across all doses had no effect on swallowing capacity. BL = baseline.
Swallowing speed
The mean swallow capacities across the group following oral anaesthesia are shown in Figure 5. In contrast to capacity, swallowing speed was seen to reduce in all subjects, (repeated-measures ANOVA, P < 0.001, F = 5.84). A one-way ANOVA comparing each dose showed that this effect was explained mainly by the 40 mg Lidocaine dose (P < 0.05), with the paired t-tests confirming that this only occurred immediately after anaesthesia (P < 0.001).
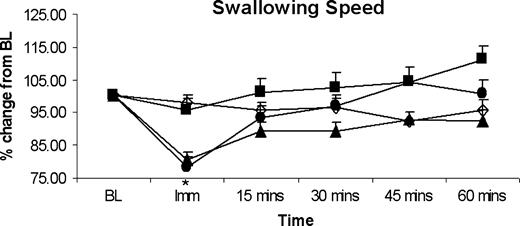
Histographic plots of group data, showing percentage change from baseline measures for mean swallowing speed over time for differing levels of topical anaesthesia. Lidocaine doses are shown at 0 mg (placebo; open diamond), 10 mg (closed square), 20 mg (closed triangle) and 40 mg (closed circle). Only the 40 mg oral anaesthesia dose produced an immediate reduction in swallowing speed, which disappeared after 15 min, despite lower perceived sensation. *P < 0.01. BL = baseline.
Inter-swallow interval
Mean ISI data across the group for each anaesthesia dose and each time period are shown in Table 3. In parallel to swallowing speed, ISI was seen to increase in all subjects (repeated-measures ANOVA, P < 0.001, F = 3.34). A one-way ANOVA comparing each dose showed that this effect was again mainly explained by the 40 mg Lidocaine dose (P < 0.01), with the paired t-tests confirming that this only occurred immediately after anaesthesia (P < 0.001).
Group ISIs (s, mean ± SEM), across each anaesthetic dose for each time point
Anaesthesia dose (mg) | B/L | Immediate | 15 mins | 30 mins | 45 mins | 60 mins |
|---|---|---|---|---|---|---|
| 0 | 1.43 ± 0.35 | 1.39 ± 0.30 | 1.42 ± 0.30 | 1.45 ± 0.36 | 1.48 ± 0.34 | 1.43 ± 0.30 |
| 10 | 1.43 ± 0.44 | 1.59 ± 0.60 | 1.47 ± 0.38 | 1.44 ± 0.35 | 1.47 ± 0.46 | 1.41 ± 0.41 |
| 20 | 1.34 ± 0.41 | 1.65 ± 0.45 | 1.49 ± 0.31 | 1.38 ± 0.31 | 1.45 ± 0.38 | 1.41 ± 0.33 |
| 40 | 1.45 ± 0.29 | 1.67 ± 0.38* | 1.46 ± 0.36 | 1.35 ± 0.28 | 1.32 ± 0.26 | 1.36 ± 0.28 |
B/L = baseline.
P = 0.001, paired t-test.
Discussion
This study examined the effects of both taste and anaesthesia on healthy human water swallowing behaviour, evaluated with cup drinking (via the water swallow test) as opposed to occasional single (volitional) swallows. As postulated, we found that altering taste or reducing oral sensation produced distinct changes in swallowing behaviour, although, contrary to expectation, these effects were not differential: a reduced volume per second and an increased ISI was seen with both interventions, suggesting a common compensatory swallowing response, being most pronounced with the strongest tastes and at the highest anaesthesia dose.
These findings raise a number of important questions concerning how swallowing behaviour adapts to changes in chemosensory input. For example, why should changes to taste or levels of sensation result in altered swallowing performance? And further, does adapting the swallow by such chemo-stimuli bear any relevance to the rehabilitation of swallowing when disrupted by disease?
With respect to the first question, it is important to consider the role of both taste and sensation in swallowing. Taste traditionally consists of the four basic gustatory modalities of sweet, sour, salty and bitter, but the range of primary taste sensations may be broader (Scott, 2004). The salty/meaty taste of L-glutamate, termed ‘umami’, has recently been added as a separate modality (Zhao et al., 2003). Taste transduction is initiated in the 5000 or so taste-buds of the oropharynx, larynx and upper third of the oesophagus. Ion channels, ligand-gated channels, enzymes and G-protein-coupled receptors serve as receptors for taste sensations and trigger subsequent transduction events within cells (Kristiansen, 2004). Taste buds are innervated by the facial, glossopharyngeal and vagus cranial nerves (Capra, 1995; Northcutt, 2004). In addition, sensation arising from pain (hot spices), food temperature and texture affect taste perception by generating impulses to the trigeminal nerve (Miller, 1982). Peripheral gustatory fibres enter the brainstem and the nucleus tractus solitarius (NTS) before projecting to higher centres. Of interest, it has been shown that interneurons in the NTS can be either excited or inhibited by taste stimuli (Travers and Smith, 1979).
By comparison, anaesthesia, or the removal of sensation, and how it influences swallowing has received rather limited attention. Both Mansson and Sandberg (1974) and Ertekin et al. (2000) have evaluated the effects of topical anaesthesia on swallowing, assessed with videofluoroscopy and EMG, respectively. Both studies demonstrated the importance of sensory input for the initiation of voluntary swallowing, with distinct changes in the physiology being described. In a more recent study, the effects of bilateral lingual and inferior alveolar nerve anaesthesia were examined on masticatory function and early swallowing (Tei et al., 2004). The authors reported an increase in the oral containment time, total number of chews, and swallows to ingest solid and mixed foods. However, Ali et al. (1994) found very little effect of oral and pharyngeal anaesthesia on videofluorographic and manometric measures of swallowing. In support of the former observations, afferent nerve damage (Logemann, 1985, 1996) has been shown to disrupt the normal pattern of volitionally initiated swallowing as measured by videofluoroscopy.
Oral sensory input, including taste, plays a critical role in the normal modulation of volitional swallowing. As a consequence, taste and other sensory stimuli, by activating sensory receptors, are likely to provide significant inputs to the NTS and higher centres in regulating swallowing activity. However, in our study, both taste and anaesthesia produced similar effects, reducing the rate of ingested water per swallow. In order to explain the taste effect, we would argue that the heightened sensory input may have been perceived as an uncharacteristically intense stimulus, with all tastes being rated as strong on the intensity scale. Furthermore, it is interesting to note that the solutions considered most intense produced the largest effects. Nevertheless, the pleasant tasting glucose/sweet solution also altered swallowing. Perhaps all the intense tasting solutions resulted in heightened awareness of an unusually strong flavour in the mouth. Such stimuli may have altered behaviour either by causing the subject to attend more carefully to the task or through a conscious increased perception of the bolus. Indeed, attention and other emotive dimensions associated with the performance of swallowing have been implicated by functional imaging studies, these having demonstrated activation of, for example, the anterior cingulate cortex during the task of swallowing (Hamdy et al., 1999). Further, similar cerebral activations have also been reported in association with intra-oral stimulation with water without swallowing (Zald and Pardo, 2000). The resultant effect may be the elicitation of a protective mechanism that reduces the rate of ingested bolus and lengthens the time between each swallow in order to reduce the possibility of aspiration of a potentially deleterious substance. The lack of change in swallowing capacity may simply be a consequence of fact that all subjects swallowed cold (4°C) water as control or baseline. This additional sensory stimulus may have (unintentionally) reduced the swallowing capacity so that any further changes could not be easily demonstrated (Hamdy et al., 2003).
The effects of anaesthesia to reduce swallowing speed and increase the time between swallows duplicate the changes associated with strong tastes. The effect was short term, and did not parallel the sensory threshold changes which remained reduced despite a return to normal swallowing measurements. One implication is that an acute reduction in sensation in the oropharynx may also result in subjects adapting their swallowing behaviour to focus more carefully on the task, to avoid premature spillage of the bolus into the piriform region of the pharynx. Thus, the slower swallowing speed and increased time between swallows may represent a default compensatory strategy which can be applied when sensory input is reduced or, indeed, when noxious stimuli are being ingested as a safety mechanism. Moreover, the slower swallowing speed for water drinking is consistent with the findings of Tei et al. (2004), who demonstrated that that oral containment time and total (swallow) sequence duration, total number of chews and total number of swallows increased significantly after anaesthesia (via nerve block) for both solid food and a mixture of solid food and liquid. One interpretation of this is that much of the effect of the anaesthesia on water swallowing may have been through changes in oral holding time. Certainly, the increase in ISI would be consistent with this, albeit being only present immediately after anaesthesia and at the highest dose.
The observation of a dose-dependent relationship between the level of oral anaesthesia and the effects of swallowing physiology is of some importance. Few studies have looked specifically at the effects of anaesthetic dose, and as such this may explain the variable results seen across previous reports. Our data now indicate that low levels of anaesthesia will have little or no effect on swallowing physiology, despite altering sensation. One implication is that lower levels of anaesthesia can be given safely to patients in whom oropharyngeal intubation is to be performed, to improve tolerability, but without concerns of swallowing disruption and risk of aspiration.
In relation to the second question concerning the relevance of our findings to the treatment of dysphagia after disease, it is important to consider why increased sensory input might be beneficial. For example, Aviv et al. (1996) have demonstrated consistent sensory abnormalities in patients with dysphagia after stroke. In a study by Kidd et al. (1993), reduced pharyngeal sensation was also found after stroke by using an orange stick and touching the side of the pharyngeal wall. Loss of pharyngeal sensation was shown to be associated with aspiration. Thus, given that sensory loss is a potentially important factor in the development of dysphagia after stroke, it would seem logical to attempt to compensate for the abnormality by increasing (rather than decreasing) sensory information. In support of this notion, previous studies have demonstrated beneficial effects on discrete liquid swallowing and aspiration risk in neurogenic dysphagia when the properties of the swallowed (barium) liquids are altered by sour flavouring (citrus) or carbonation (CO2) during videofluoroscopy (Logemann et al., 1995; Bülow et al., 2003). Of interest, a recent study has also shown a relationship between water swallow measures and awareness of swallowing problems in stroke patients (Parker et al., 2004). Those patients with the greatest awareness of swallowing difficulty were more likely to take smaller volumes per swallow and take less volume per second. Since certain taste stimuli, e.g. citrus, seemed to have similar, albeit direct, effects on swallowing performance, it might be argued that the use of these types of alterations to diet may be beneficial.
In conclusion, we have shown that taste stimuli and anaesthesia substantially alter healthy human swallowing behaviour, the latter in a dose-dependent manner. The ability to slow the volume of liquids and/or foods ingested by patients with dysphagia by altering taste may be useful in their swallowing management. Our data provide new insights into the role of oral chemosensory input on human swallowing physiology and offers the potential to apply these observations in a clinical setting.
S.H. is funded by the MRC (UK) as a Clinician Scientist. S.S. is funded by the Health Foundation (UK).
References
Ali, G.N., Laundl, T.M., Wallace, K.L., Shaw, D.W., deCarle, D.J. and Cook. I.J. (
Aviv, J.E., Martin, J.H., Sacco, R.L., Zagar, D., Diamond, B., Keen, M.S. and Blitzer, A. (
Bülow, M., Olsson, R. and Ekberg, O. (
Car, A., Jean, A. and Roman, C. (
Cook, I.J. and Kahrilas, P.J. (
Ertekin, C., Kiylioglu, N., Tarlaci, S., Keskin, A. and Aydogdu, I. (
Hamdy, S., Jilani, S., Price, V., Parker, L., Hall, N., Power, M. (
Hamdy, S., Rothwell, J.C., Brooks, D.J., Bailey, D., Aziz, Q. and Thompson, D.G. (
Hughes, T.A.T. and Wiles, C.M. (
Kidd, D., Lawson, J., Nesbitt, R. and MacMahon, J. (
Kristiansen, K. (
Logemann, J.A. (
Logemann, J.A. (
Logemann, J.A., Pauloski, B.R., Colangelo, L., Lazarus, C., Fujiu, M. and Kahrilas, P.J. (
Mansson, I. and Sandberg, N. (
Parker, C., Power, M., Hamdy, S., Bower, A., Tyrrell, P., Thompson, D.E. (
Smithard, D., O'Neill, P., Parks, C. and Morris, J. (
Tei, K., Yamazaki, Y., Kobayashi, M., Izumiyama, Y., Ono, M. and Totsuka, Y. (
Travers, J.B. and Smith, D.V. (
Zald, D.H. and Pardo, J.V. (
Author notes
1Manchester Medical School, Stopford Building, University of Manchester, Oxford Road, Manchester M13 9PL, UK and 2Department of GI Sciences, Hope Hospital, Salford M6 8HD, UK
