


Abstract
The Etiology, Risk Factors and Interactions of Enteric Infections and Malnutrition and the Consequences for Child Health and Development (MAL-ED) cohort study communities in Peru are located in Loreto province, in a rural area 15 km from the city of Iquitos. This riverine population of approximately 5000 individuals is fairly representative of Loreto. The province lags behind the rest of the country in access to water and sanitation, per capita income, and key health indicators including infant mortality (43.0 vs 16.0 per 1000 nationwide) and under-5 mortality (60.6 vs 21.0 per 1000). Total fertility rates are higher than elsewhere in the country (4.3 vs 2.6). Nationwide, the prevalence of human immunodeficiency virus is estimated at 0.45%, the prevalence of tuberculosis is 117 per 100 000, and the incidence of malaria is 258 per 100 000. Stunting in this community is high, whereas acute undernutrition is relatively uncommon. The population suffers from high rates of diarrheal disease. Prevalent enteric pathogens include Ascaris, Giardia, enterotoxigenic Escherichia coli, Shigella, and Campylobacter.
The Etiology, Risk Factors and Interactions of Enteric Infections and Malnutrition and the Consequences for Child Health and Development (MAL-ED) cohort study site in Peru is located in 3 rural communities, Santa Clara de Nanay, Santo Tomas, and La Union, in the Department of Loreto. The study site lies approximately 15 km southeast of Iquitos, the departmental capital. Loreto, located in northeastern Peru, is the largest department (365 852 km2). The region has significantly poorer indices for child and infant mortality, higher rates of malnutrition, and high rates of malaria and tuberculosis when compared to the country as a whole [1–5]. Its international borders include Ecuador to the northwest, Colombia to the north, and Brazil to the east (Figure 1). Peru has many distinct climatic zones, which are broadly classified into coastal, Andean, and Amazonian. The Peruvian Amazon may further be subdivided into 2 zones: the selva alta (high jungle) and the selva baja (low jungle), which is properly referred to as a tropical rainforest or equatorial climate (Köppen classification “Af”). Loreto is located in the selva baja. Many rivers cross this region, the most important of which is the Amazon, which begins very near to Iquitos at the confluence of the Ucayali and Marañón rivers. Santa Clara de Nanay, Santo Tomas, and La Union are each located along the Nanay River, which is a tributary of the Amazon.
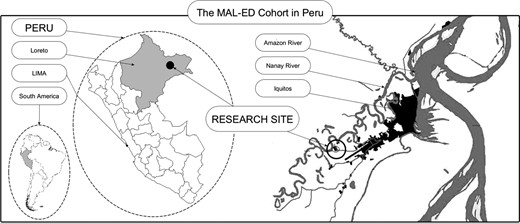
The study site lies approximately 15 km southeast of Iquitos, the departmental capital. Loreto, located in northeastern Peru, is the largest department (365 852 km2). Its international borders include Ecuador to the northwest, Colombia to the north, and Brazil to the east.
The average daily temperature in the region is 25.8°C (minimum 21.9°C, maximum 32.4°C), and the average annual precipitation is 3.4 meters. Rain occurs throughout the year, on about half of all days (51.6%) [6]. The heaviest rain occurs in January, a period during which rivers rise and flooding is common. From March onward, river levels decline; as many members of the community engage in activities including fishing, logging, and farming, the level of the river can be seen as highly relevant to the dietary patterns and daily routines of members of the community.
According to the National Institute of Statistic and Informatics, the population in 2012 for the department of Loreto was 1 006 953 inhabitants, with a population density of 2.73 people/km2 [1, 2]. However, more than half (550 031 individuals) of the population in Loreto is located in the province of Maynas, where the city of Iquitos is situated (population 457 900) [1, 2]. In Loreto, the population density is estimated to be 4.59 people/km2.
Due to the unique climate and environment of Loreto, the city of Iquitos is a hub of research in a variety of fields related to ecology, climatology, and biology, as well as public health. This diversity of scientific expertise makes Loreto a rich and exciting research site. The MAL-ED Peru team, based out of the Johns Hopkins Bloomberg School of Public Health in collaboration with the Asociación Benéfica PRISMA and the United States Naval Medical Research Unit No. 6, has been working in Iquitos for more than a dozen years.
SITE DESCRIPTION
Peru, Loreto, and Santa Clara
The communities of Santa Clara, Santo Tomas, and La Union have been the site of several studies by researchers at Johns Hopkins University and others in the past decades, including studies of dengue [7] and other viral infections such as Oropouche [8]; malaria [9, 10]; tuberculosis [11]; the seroepidemiology of strongyloidiasis [12]; a study of the effects of zinc and iron supplementation on malaria, diarrhea, and respiratory infections [13]; and a cohort study of diarrheal disease [14–16]. Recently completed or currently ongoing studies include those related to topics such as helminthic and human papillomavirus (HPV) coinfections, and clinical trials of probiotics to treat childhood diarrheal disease (unpublished data).
According to a 2010 community census performed by the MAL-ED Peru study team, there were 5134 total individuals living in these 3 communities (1083 households), of whom 2765 individuals (554 households) were living in Santa Clara; 1106 individuals (296 households) in Santo Tomas, and 1263 individuals (296 households) in La Union. The populations of Santa Clara and Santo Tomas have held roughly steady for the past several years, as a 2005 census estimated the population of Santa Clara to be 2751, and a 2007 census performed by PRISMA and Johns Hopkins University's researchers estimated the population of Santo Tomas to be 1571. In contrast, the community of La Union, which was formed in 2003, has been growing rapidly, from 587 reported individuals in 2005, to 891 in 2007, to the 2012 estimate of 1263 individuals (previously unpublished data by the same study team).
Estimates from these 3 communities suggest that they are demographically representative of the department of Loreto in which they are located (Table 1). Access to electricity and to improved water sources are higher in this community, which is close to the provincial capital, than in the (largely rural) population overall. The population also has good access to nearby public health posts, and governmental insurance schemes make basic healthcare available to all children and most adults at low cost.
National and Regional Demographic Indicators
| Indicator | Peru [1] | Loreto [2] | Community Estimates [1] |
|---|---|---|---|
| Population aged <15 y, % | 30.0 | 40.0 | 36.6 |
| Population aged 15–64 y, % | 61.8 | 54.9 | 58.9 |
| Population aged ≥65 y, % | 8.1 | 5.1 | 4.5 |
| Female sex, % | 49.9 [17] | NA | 48.6 |
| Total fertility rate | 4.3 | 2.6 | NA |
| Average household size, No. | 3.7 | 4.6 | 5.9 |
Abbreviation: NA, not applicable.
The most common employment for men in these communities is cultivating vegetables to sell in the city (14.7%), followed by fishing (8.7%), moto-taxi driving (8.3%), and making bricks (6.1%). Other forms of employment include working in the lumber industry, keeping a small shop or stall in the market, and selling ornamental fish. Most women older than age 18 report their employment status as “housewife” (63.5%). A further 18.1% report keeping a shop or stall, and the remaining 18.4% report that they are unemployed (3.6%), working as a maid (2.4%), or receiving other sources of income from activities such as growing vegetables or fishing. Table 2 lists specific demographic characteristics of the MAL-ED cohort population.
MAL-ED Cohort-Specific Demographics
| Characteristics | No. of Study Families (N = 270)a | % |
|---|---|---|
| Maternal level of education | ||
| No education or did not respond | 3 | 1.1 |
| Some primary (1–5 y education) | 57 | 21.1 |
| Primary and some secondary (6–10 y) | 157 | 58.2 |
| Completed secondary | 38 | 14.1 |
| Beyond secondary (some technical school or college) | 15 | 5.6 |
| Source of drinking water | ||
| Tube well or a borehole | 112 | 41.5 |
| Water piped into their homes | 68 | 25.2 |
| Water piped into their yard or plot | 52 | 19.3 |
| Public taps, protected and unprotected wells, surface water | 27 | 14.1 |
| Other, or did not respond | 11 | 4.1 |
| Type of toilet facility | ||
| Pit latrine without flush | 157 | 58.2 |
| Flush toiletb | 65 | 24.1 |
| Bush | 40 | 14.8 |
| Other | 8 | 3.0 |
| Electricity | ||
| Presence of electricity in household | 200 | 74.0 |
| Heating fuel | ||
| Houses in the community are unheated | NA | NA |
| Cooking stove | ||
| Open fire (fuel, charcoal, or wood) | 225 | 83.3 |
| Gas stove | 39 | 14.4 |
| Other cooking sources | 6 | 2.3 |
| Housing material | ||
| Wall material | ||
| Wood | 205 | 75.9 |
| Concrete | 52 | 19.3 |
| Other | 13 | 4.8 |
| Floor material | ||
| Earth | 197 | 73.0 |
| Concrete | 58 | 21.5 |
| Wood | 15 | 5.6 |
| Roof material | ||
| Thatch | 146 | 54.1 |
| Metal | 119 | 44.1 |
| Other | 5 | 1.8 |
| Primary way to distinguish members of the population | ||
| The population is fairly homogenous, without significant ethnic or tribal aggrupation | NA | NA |
Abbreviation: NA, not applicable.
a Source: MAL-ED study data.
b Because there is no sewage system present in the community and septic tanks are uncommon, it is likely that almost all of these flush to a pit latrine.
HIV, Malaria, and Tuberculosis
Human Immunodeficiency Virus
Human immunodeficiency virus (HIV) is of increasing concern in Peru, although HIV prevalence among the general population is low, with an estimated prevalence rate of 0.45% [3, 18]. New infections continue to be localized among at-risk populations, including men who have sex with men [19] and female sexual workers. After the city of Lima, Loreto has the second-highest rate of HIV infection in the country. According to the Regional Epidemiology Office (DIRESA Loreto), 176 new cases of HIV were reported in Loreto in 2011 (private communication, C. Ramal Asayag).
Since 2004, antiretroviral therapy (ART) has been provided for HIV-infected patients at the Hospital Regional de Loreto, which is the main public hospital in the region, and at 5 other healthcare centers. Between these healthcare centers, 1155 individuals are currently receiving ART. An additional 1174 HIV-positive individuals are not receiving ART but are under surveillance (personal communication, C. Ramal Asayag). There are no known or suspected cases of HIV among MAL-ED study participants or within their immediate families.
Malaria
Malaria is a reemerging infection in Peru [20]. Cases are concentrated in the Amazonian regions of the country, particularly in Loreto. In 2012, Loreto reported 3935 cases of Plasmodium falciparum and 21 048 cases of Plasmodium vivax, which collectively comprise >79% of all of the malaria cases reported in Peru during this time period [21].
Malaria is hypoendemic in the area surrounding Iquitos, including the 3 study communities. The majority of malaria in this study area is symptomatic [22, 23], although higher levels of asymptomatic P. vivax occur in clusters around active human malaria cases [24]. A prior study estimated the incidence of vivax malaria among children 0–6 years of age in the study community to be 0.24 episodes per child-year [15]. Falciparum malaria was also present at a low level (<0.04 episodes per child-year) [15].
It is believed that the majority of malaria cases may be related to instances of travel outside of the community by either the children or their family members. Work in this community by Richard and colleagues [13] was among the first to demonstrate an exacerbative effect of iron supplementation on P. vivax infection in children.
Tuberculosis
The incidence of tuberculosis in Peru is 101 per 100 000, and the prevalence is 117 per 100 000 [4]. Despite a robust government response, multidrug-resistant tuberculosis, especially in the shantytowns of Lima, is a concern, with 5.3% of new tuberculosis cases and 24% of previously treated cases being identified as multidrug resistant [25]
Most adults in Iquitos and the surrounding community have evidence of latent tuberculosis, and the reported incidence of diagnosed tuberculosis in Iquitos is 106 per 100 000 in 2009 [11]. A study by Pelly et al [11] that took place partially within our study community found that individuals with protein energy malnutrition were less likely to be tuberculin skin test positive, suggesting that malnutrition is a cause of tuberculin-specific anergy in this population [11]. In Iquitos, delayed care-seeking was found to be associated with the belief that tuberculosis is common and curable [26]. Other work also found that tuberculosis is frequently misperceived as a nutritional rather than an airborne disease. Weight loss, more often than cough, was associated with clinical screening for tuberculosis, and stigma as a result of the disease appeared to be minimal, as risk was perceived to be individual, related to malnutrition, rather than through interpersonal exposure [27].
Dengue
Dengue fever is an emerging infection in Loreto [28]. Since 1990, when the virus was first confirmed in Peru, several large epidemics have occurred in city of Iquitos, the most recent of which was in 2012. At that time, >4159 new cases were reported in Loreto, and 10 cases were registered at the Santa Clara Primary Care Center (personal communication, C. Ramal Asayag). Previous work by Reiskind et al [7] found that in Santa Clara, greater age and more frequent travel to Iquitos were among the risk factors for exposure to dengue, suggesting that most infections in this community were acquired while visiting or working in the nearby city.
Vaccination Coverage
Vaccination rates in Peru are high. Although Loreto has lagged somewhat relative to the rest of the country in childhood vaccinations (Table 3), the vaccination coverage of the study population is expected to be relatively high due to good community access to government health services.
National and Regional Health Indicators
| Indicator | Peru [1, 17] | Loreto [2] | Community Estimates |
|---|---|---|---|
| Life expectancy, y | 72.5a | 69.9a | NA |
| Access to clean water, % of households | 77.1 | 23.8 | 46.7b |
| Access to improved toilet/sanitation, % | 58.4 | 27.1 | 20.2 b,c |
| Children who received third DPT, % | 81.4 | 70.5 | NA |
| Children who received MMR, % | 88.3 | 81.0 | NA |
| Children who received all vaccinations, % | 71.0 | 53.9 | NA |
| Children born underweight (<2.5 kg), % | 6.5 | 9.1 | 10.6d |
| Children under 5 stunted (WHO), % | 19.5 | 31.0 | 46.3e |
| Children under 5 wasted (WHO), % | 0.4 | 1.9 | 0.2e |
| Children under 5 underweight (WHO), % | 0.5 | 8.9 | 5.6e |
| Children under 5 with diarrhea reported in the past week, % | 13.9 | 30.4 | 35.4b |
| Under-5 mortality rate per 1000 live births | 21 | 60.6 | NA |
| Gave birth in a healthcare center, % | 85.1 | 53.1 | 81.3f |
| Some prenatal care, % | 98.2 | 83.9 | NA |
| Postnatal care (first postnatal visit within 4 h of birth), % | 69.9 | 40.9 | NA |
Abbreviations: DPT, diphtheria-pertussis-tetanus; MMR, measles-mumps-rubella; NA, not applicable; WHO, World Health Organization.
a Source: 2010–2015 estimates from [17].
b Source: 2010 census by MAL-ED study team.
c Flush toilet present in household (but not connected to a sewage system).
d Source: Prior cohort study, based on health post records.
e Source: Prior cohort study, children 0–5 y only, unadjusted for age structure of community.
f Source: 2010 census, counting hospital and health post deliveries, for pregnancy among women ≤48 years.
The vaccination schedule in Peru includes Bacillus Calmette-Guerin and the hepatitis B (HepB) vaccination at birth. At 2, 4, and 6 months of age, children receive the pentavalent diphtheria-pertussis-tetanus (DPT), Haemophilus influenzae type B (HiB), HepB, and oral polio vaccines. At 3, 5, and 7 months of age, children receive the pneumococcal vaccine Synflorix. The measles-mumps-rubella (MMR) vaccine is given at 1 year of age, and the yellow fever vaccine is given at 15 months. Seasonal influenza vaccines are also scheduled at 7 and 8 months of age. In 2008, the rotavirus vaccine (Rotarix) was introduced in Peru, with doses given at 2 and 4 months of age. The introduction of this vaccine makes Peru 1 of only 3 MAL-ED study sites in which children are vaccinated against rotavirus. Booster DPT and HiB vaccines are given at 18 months, and additional DPT booster and MMR booster are given at 4 years. Girls from low-income families now also receive free vaccination for HPV at 10 years of age.
Diarrheal Disease and Helminthic Infections in the Study Area
A prior cohort study in Santa Clara found a high incidence of diarrheal disease in the community, peaking at 9.6 episodes per year in children 12–17 months of age [15]. The average duration of these episodes, however, was fairly brief (mean duration, 3.5 days). Children in the cohort spent 4.6% of their time with diarrhea.
In that study, Shigella, Campylobacter, and enterotoxigenic Escherichia coli were frequent bacterial causes of diarrhea, whereas other enteropathogens including Aeromonas, Salmonella, and Vibrio cholerae appeared to be uncommon [14, 29]. Giardia lamblia was present in 18.9% of diarrhea samples and 21.6% of asymptomatic stool samples, and norovirus was found in 21.3% of a tested subset of diarrheal samples and 3% of nondiarrheal stools [16], suggesting norovirus as a significant cause of diarrhea in Santa Clara as well.
As previously discussed, rotavirus vaccination was introduced to Santa Clara in 2008 after the close of the earlier cohort study, but before enrollment in the MAL-ED study began. A subset of 118 diarrheal samples from the previous cohort in which no bacterial agent could be isolated were tested for rotavirus; 3 (2.5%) were positive, suggesting that rotavirus may not have been a major cause of diarrhea at the community level even prior to vaccination.
Intestinal parasites are also common in the community in both children and adults, and have been related to undernutrition in cross-sectional studies at nearby sites [30]. Parasites identified in single stool specimens from 792 residents of Santo Tomas showed that the most prevalent parasitic pathogens were Ascaris lumbricoides (41.9%), Trichuris trichiura (16.9%), Strongyloides stercoralis (8.7%), Hymenolepis nana (7.1%), Giardia intestinalis (5.2%), and hookworm (4.5%) [12]. Interestingly, although helminthic infections are considered to be an important cause of growth faltering in the developing world, very little association was seen in the previous cohort study between these infections and growth. As part of the protocol of the previous study, helminthic infections were treated upon detection. Furthermore, anthelminthic treatment in the absence of a positive stool result was very frequently reported, probably as a result of public clinic or parental initiative, which may explain the lack of observed association [15].
Nutrition in Santa Clara
Dietary Intake
In Loreto, 62.3% of mothers initiate breastfeeding within an hour of birth, and 96.4% initiate it within a day [2]. Almost all infants (99.0%) receive at least some breastfeeding [2]. Regionally, it is estimated that 63.0% of infants in Loreto are exclusively breastfed to 6 months of age [2]. At 12–17 months of age, 24.5% of infants no longer receive any breast milk, and by 24–35 months, 91.6% are weaned [2].
Regionally, it is estimated 94.1% of infants between 6 and 9 months of age are breastfed with complementary foods including porridges and cereals (69.6%), eggs and fish (46.8%), root vegetables (38.3%), and fruits and vegetables (43.5%), including vitamin A–rich foods [2]. Complementary foods given to children 6–8 and 9–11 months of age may not, however, meet the World Health Organization recommendations for iron, zinc, and calcium [31]. Seasonal variations may also lead to fluctuations in food availability, but this is likely to be less intense in the MAL-ED study community than what has been reported in other, relatively more remote communities in the region [31, 32].
Undernutrition
Throughout Peru and in Latin America more generally, children are generally not undernourished at birth, but rapidly become stunted (length-for-age z score <2 ) [33], whereas acute malnutrition (weight-for-height z score <2 ) remains relatively uncommon (Table 3).
Children in Santa Clara fit this trend. In the previously mentioned cohort study, only 10.6% of participants were of low birth weight, defined as <2.5 kg at birth, according to health post records. However, 20.3% of children in the cohort were stunted at 3 months of age; this rose to 38.2% by 12 months, 43.7% by 24 months, and 55.9% by 36 months of age. A very similar pattern has been documented in other communities in Loreto [31].
Similarly, acute malnutrition in the form of wasting, defined as weight-for-length z score <2, was relatively uncommon in the earlier cohort (Table 3). Underweight (weight-for-age z score <2) was also uncommon (<6.0% overall). Thus, the children of Santa Clara fit well into the Latin American phenotype classically described by Martorell as “short and plump” [34, 35].
Programs to Combat Undernutrition
“Vaso de Leche” is an ongoing governmental program designed to combat malnutrition among infants, children <5 years of age, pregnant women, and seniors aged >65 years. The program provides milk and fortified cereals and crackers and is managed by local authorities. Other similar programs, such as Programs Nacional de Alimentos, from the central government provide basic food supplies to low-income families with children. Most MAL-ED study families participate in these programs to some degree.
Overnutrition
As in many parts of Peru, both under- and overnutrition are apparent in this study population. Previously unpublished data by our study team estimates that 20% of adults aged 18–45 in the community are overweight (body mass index [BMI] >25); 10% of these are obese (BMI >30). Obesity appears to be more common among more affluent members of the community, a trend also observed in Lima and in other Latin American countries [36].
MAL-ED Cohort Study Recruitment Scheme
The enrollment of children in the MAL-ED cohort study began in 2009. First, meetings were held with communities' authorities and later with the general population of the community to discuss the objectives of the study and to explain who would be eligible to participate. Eligible participants were infants who would be followed from birth until 2 years of age. A list was requested of expectant mothers who had come to the post for treatment from the local health post. Additionally, each MAL-ED field-worker made a list of expectant mothers who had not gone to the health post within their assigned geographic areas in order to estimate the completeness of prenatal healthcare coverage.
The contact information for all of the pregnant women in the study community was compiled along with their estimated due dates. Once a woman gave birth, she was visited by a field-worker and the field coordinator to invite her to participate in the study. The first part of this invitation involved screening to ensure that the newborn was eligible to participate in the MAL-ED study. Following this screening, the consent form was read to the mother as well as the father and/or grandfather of the newborn. If the family accepted and wished to participate in the study, the mother and father or mother and grandfather of the newborn signed the consent form indicating informed consent. After receiving informed consent, the field-worker took anthropometric measurements of the newborn and left materials to collect the first fecal sample. An appointment was made with the mother for the following day to complete the enrollment information for the newborn. A paper copy of the consent form was left with the family.
A unique identification code (PID) was assigned to each participating newborn, and was used for the entire time that the child was enrolled in the study. A schedule was prepared for continued surveillance child. If the newborn did not satisfy the enrollment requirements or if the family declined to participate, a nonparticipation form was completed, a PID was assigned, and the reason for not enrolling the child was noted.
CONCLUSIONS
The children of Santa Clara are fairly representative of children throughout the province of Loreto and other parts of the Peruvian Amazon. To a lesser extent, the experiences of the children of the MAL-ED cohort in Peru are also likely to be reflective of the experiences of children living in the Brazilian, Colombian, and Ecuadorian Amazon. Among these children, malnutrition tends to be chronic but not acute, and the burden of diarrheal disease is intense. This combination, typical of the South American child living in poverty, is distinct from what is observed in African and Southeast Asian populations with different dietary and enteric stressors, where acute and extreme malnutrition as defined by anthropometric indicators are more common. Thus, the Santa Clara MAL-ED cohort contributes a unique perspective on the South American experience of enteric disease and growth faltering.
Notes
Acknowledgments. The authors thank the staff and participants of the MAL-ED Network for their important contributions.
Financial support. The Etiology, Risk Factors, and Interactions of Enteric Infections and Malnutrition and the Consequences for Child Health and Development Project (MAL-ED) is carried out as a collaborative project supported by the Bill & Melinda Gates Foundation, the Foundation for the National Institutes of Health, and the National Institutes of Health, Fogarty International Center.
Supplement sponsorship. This article is published as part of a supplement entitled “The Malnutrition and Enteric Disease Study (MAL-ED): Understanding the Consequences for Child Health and Development,” sponsored by the National Institutes of Health and the Foundation for the National Institutes of Health.
Potential conflicts of interest. All authors: No potential conflicts of interest.
All authors have submitted the ICMJE Form for Disclosure of Potential Conflicts of Interest. Conflicts that the editors consider relevant to the content of the manuscript have been disclosed.


Comments