


Abstract
An antimicrobial stewardship program (ASP) is one of the core elements needed to optimize antimicrobial use. Although collaboration at the national level to address the importance of ASPs and antimicrobial resistance has occurred in the Asia Pacific region, hospital-level ASP implementation in this region has not been comprehensively evaluated.
We conducted a systematic review and meta-analysis to assess the efficacy of ASPs in inpatient settings in the Asia Pacific region from January 2005 through March 2016. The impact of ASPs on various outcomes, including patient clinical outcomes, antimicrobial prescription outcomes, microbiological outcomes, and expenditure were assessed.
Forty-six studies were included for a systematic review and meta-analysis. The pooled risk ratio for mortality from ASP before–after trials and 2-group comparative studies were 1.03 (95% confidence interval [CI], .88–1.19) and 0.69 (95% CI, .56–.86), respectively. The pooled effect size for change in overall antimicrobial and carbapenem consumption (% difference) was −9.74% (95% CI, −18.93% to −.99%) and −10.56% (95% CI, −19.99% to −3.03%), respectively. Trends toward decreases in the incidence of multidrug-resistant organisms and antimicrobial expenditure (range, 9.7%–58.1% reduction in cost in the intervention period/arm) were also observed.
ASPs in inpatient settings in the Asia Pacific region appear to be safe and effective to reduce antimicrobial consumption and improve outcomes. However, given the significant variations in assessing the efficacy of ASPs, high-quality studies using standardized surveillance methodology for antimicrobial consumption and similar metrics for outcome measurement are needed to further promote antimicrobial stewardship in this region.
Although judicious use of antimicrobial agents is strongly encouraged, their overuse or misuse has become entrenched globally in various settings. In acute care hospitals, it is estimated that approximately 20%–50% of all antimicrobials prescribed are either unnecessary or inappropriately used [1, 2]. Such rampant antimicrobial use has contributed to adverse clinical outcomes, increasing healthcare costs, and, most important, the emergence of multidrug-resistant organisms, which poses a significant threat to public health [3].
An antimicrobial stewardship program (ASP) is one of the core elements needed to optimize antimicrobial use. In acute care settings, “ASP” refers to coordinated interventions by a multidisciplinary team including patient-level stewardship (eg, optimizing antimicrobial therapy for an individual patient, based on culture results and clinical syndrome) and population-level stewardship (eg, decreasing consumption of overall antimicrobials or a particular antimicrobial class by interventions) [2]. Together, these 2 components of an ASP ensure the optimization of antimicrobial use in acute care settings.
Initiatives in developed nations, including the United States and those in Europe, have promoted ASP implementation through the development of practical guidelines for antimicrobial stewardship or by supporting national action plans for antimicrobial resistance [4, 5]. Moreover, collaborative efforts such as the Transatlantic Taskforce on Antimicrobial Resistance (TATFAR) undertaken by the US Centers for Disease Control and Prevention and the European Centre for Disease Prevention and Control have given impetus to develop more detailed ASPs [6].
In the Asia Pacific region, collaboration at the national level to address antimicrobial resistance has been gaining momentum over the past few years. The World Health Organization (WHO) South-East Asian region launched the Jaipur declaration on antimicrobial resistance in 2011, and ministerial conferences on antimicrobial resistance sponsored by the WHO were held in 2016 [7, 8]. However, hospital-level ASP implementation that takes into account the significant variations in medical practices, issues related to antimicrobial use, and targeted drug-resistant organisms across nations in the Asia Pacific region has not been done. We therefore performed a systematic review of the literature and a meta-analysis of inpatient-based ASP intervention in the Asia Pacific region to understand the current state of ASPs in this region and to identify aspects requiring improvement.
METHODS
Review Topics
The primary objective of this systematic review is to investigate the current development of inpatient-based ASPs and to assess the impact on clinical outcomes across the Asia Pacific region. We focused on studies relevant to antimicrobial stewardship, which included prescriber-focused interventions (eg, preauthorization, formulary restriction, prospective audit and feedback, education, implementation of clinical practice guidelines or policies, syndrome-specific interventions, and computerized clinical decision support), involved microbiological and laboratory diagnostics (eg, rapid diagnostic testing), and/or sought to optimize antimicrobial therapy (eg, therapeutic drug monitoring, intravenous to oral conversion, and implementation of β-lactam allergy assessment). These intervention categories were noted in the latest guidelines published by the Infectious Diseases Society of America [4]. We documented the reports in the study following the Preferred Reporting Items for Systematic Reviews and Meta-analyses (PRISMA) statement [9].
Search Strategies
We searched literature released on Medline (Ovid) from January 2005 through March 2016 for published studies relevant to antimicrobial stewardship objectives. Search terms were based on a similar study [10] and included the names of countries in the Asia Pacific region (Supplementary Appendix 1). Countries included in the search were those listed under the East Asia and Pacific region in the World Bank database [11]. The literature search was limited to studies published in English language and enrolling human subjects. We identified additional studies by searching through journal issues, the cited references of retrieved articles, and previous meta-analyses of ASPs.
All titles and abstracts of potentially relevant studies were initially vetted for this study by one author (H. H.) based on eligibility criteria. Abstracts not conforming to the eligibility criteria were excluded. After the screening, all selected research articles were then retrieved for full-text review, and independently vetted by 2 reviewers (H. H. and N. O.) to assess quality. Any article about which the 2 reviewers disagreed was further vetted by a third reviewer (Y. T.), and the disagreement was resolved through discussion with all 3 reviewers (H. H., N. O., and Y. T.).
Inclusion and Exclusion Criteria
Studies that met inclusion were relevant to antimicrobial stewardship for adult populations published in the Asia Pacific region. Studies were excluded for any of the following reasons: (1) the ASP was for the pediatric population; (2) the ASP was outpatient-based; (3) the study mentioned ASP interventions but did not assess the effects; (4) the ASP was for prophylaxis (eg, against surgical site infection); (5) the ASP targeted antiviral and antifungal agents; or (6) interventions targeted antimicrobials for mycobacterial infection, malaria, influenza, human immunodeficiency virus (HIV) infection, melioidosis, or Helicobacter pylori. Case reports, letters to the editor, narrative reviews, and editorials were also excluded. Study designs included for systematic review included randomized controlled trial, before–after trial, or interrupted times series. We categorized included studies as either those comparing the pre- and postintervention periods, or those conducted between the intervention and control/no-intervention arms.
Data Extraction, Statistical Analysis
We created a standard data extraction form, which included the title, year of publication, author, country, study design, description of intervention, risk of biases, findings vs control or prior to intervention, and the description of outcome measurements. Outcome measurements relevant to ASPs were as follows: patient clinical outcomes (ie, mortality, length of hospital stay), antimicrobial prescription outcomes (antimicrobial consumption, duration of therapy, antimicrobial choice, proportion of appropriate therapy, and dosing of antimicrobial agents), microbiological outcomes (resistance pattern at study institutions or incidence of drug-resistant organisms), and expenditure (costs associated with antimicrobial prescription or hospitalization) [4, 10]. Primary outcomes for the systematic review and meta-analysis were to assess the impact of ASPs on these outcome measurements in the Asia Pacific region. The data from the eligible studies that reported the same outcomes were pooled and analyzed using a random-effects meta-analysis model, and pooled estimates were described as a forest plot with a 95% confidence interval (CI). The P value of each study was extracted from the studies or calculated when crude data were available. The percentage change and P value for each study were used to calculate the 95% CI and standard error [12].
A study was excluded if the pooled outcome did not include data samples necessary to conduct a random-effects model. We used the I2 index to assess heterogeneity, and the value was interpreted as follows: 0%–40%, possibly unimportant; 30%–60%, moderate heterogeneity; 50%–90%, substantial heterogeneity; and 75%–100%, considerable heterogeneity [13].
Quality Assessment
Risk of bias in each study meeting final inclusion criteria was assessed by criteria developed for Cochrane Effective Practice and Organization of Care (EPOC) [14]. A study was considered to have low risk of bias if each criterion was scored low, and considered to have high risk of bias if >2 criteria were regarded as unclear or high risk [10].
RESULTS
The initial database search identified 647 studies potentially relevant to antimicrobial stewardship in the Asia Pacific region. After review of titles and abstracts was performed, 107 studies (17%) were retrieved for full text review, from which 29 studies met the inclusion criteria. Seventeen additional studies that met study criteria were found by manual search of issues in which the retrieved articles appeared, review of the cited references of the retrieved articles, and previous meta-analyses of ASPs [1, 2, 15]. A total of 46 studies were included in the systematic review (Figure 1) and are summarized in Supplementary Appendix 2 [16–61]. The studies included are shown by region or country in Figure 2.
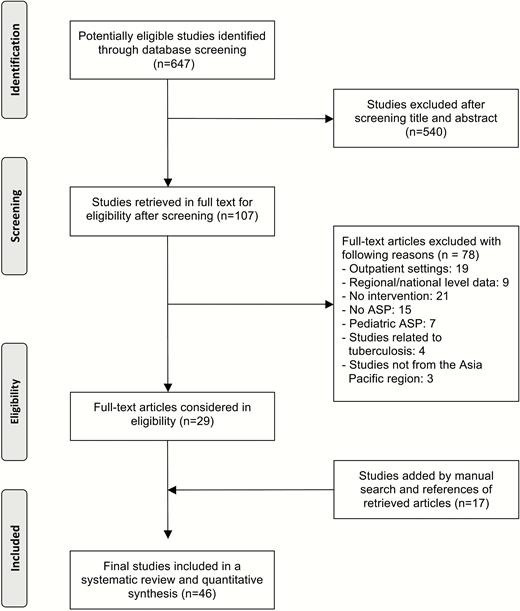
Preferred Reporting Items for Systematic Reviews and Meta-analyses (PRISMA) flow diagram of systematic review and meta-analysis. Abbreviation: ASP, antimicrobial stewardship program.
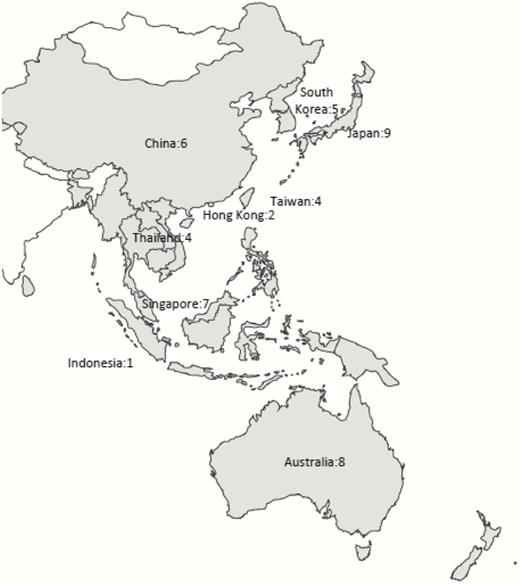
Geographical distribution of 46 studies included for a meta-analysis.
Each antimicrobial stewardship study was categorized by type of primary intervention, including prospective audit and feedback (n = 17 [37.0%]) [16–32], preauthorization or formulary restriction (n = 8 [17.4%]) [33–40], education (n = 7 [15.2%]) [41–47], guideline or policy implementation (n = 5 [10.9%]) [48–52], syndrome-specific intervention (n = 3 [6.5%]) [53–55], optimizing dosing (n = 2 [4.3%]) [56, 57], rapid diagnostic testing (n = 2 [4.3%]) [58, 59], and computerized clinical decision support system (n = 2 [4.3%]) [60, 61]. Of note, many studies implemented multifaceted interventions.
Outcome measurements to assess the efficacy of ASPs varied significantly and included mortality (eg, in-hospital mortality, 30-day mortality, infection-related mortality), length of stay (LOS), overall and selected antimicrobial consumption, duration of therapy, incidence of drug-resistant organisms, incidence of healthcare-associated infection, the rate of compliance with policy, and cost (Supplementary Appendix 3). Most studies used multiple outcome components to assess the efficacy of ASPs.
Ten studies were included for quantitative analysis to assess mortality, and were categorized as either before–after trial (ie, studies comparing the preintervention and postintervention periods) or 2-group comparative studies (ie, those conducted between the intervention and control/no-intervention arms). Individual meta-analyses were separately performed based on the 2 categories. The risk of mortality as extrapolated from selected ASP studies is shown in Figure 3. The pooled risk ratio for mortality from the ASP before–after trials and 2-group comparative studies were 1.03 (95% CI, .88–1.19; I2 = 0%; P = .91) and 0.69 (95% CI, .56–.86; I2 = 38.2%, P = .17), respectively. Length of stay was evaluated in 18 studies [17–21, 25–27, 29, 30, 32, 33, 42, 43, 48, 51, 60, 61] (Supplementary Appendix 3), of which 7 studies reported decreased LOS after ASP implementation [18–20, 27, 42, 43, 51]. The remaining studies showed no change in LOS.
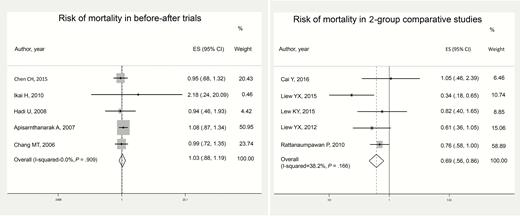
Impact of antimicrobial stewardship programs on mortality in the Asia Pacific region. Abbreviations: CI, confidence interval; ES, effect size.
The impact of ASPs on antimicrobial consumption was also assessed. Because a considerable number of studies targeted carbapenem use, we also conducted a meta-analysis for carbapenem consumption alone. The pooled effect size for change in overall antimicrobial consumption and carbapenem consumption (% difference) were −9.74% (95% CI, −18.93 to −.99; I2 = 81.2%; P < .001), and −10.56% (95% CI, −19.99 to −3.03; I2 = 92.6%; P < .001), respectively (forest plots for antimicrobial consumption are available in Supplementary Appendices 4 and 5). Four other studies that evaluated the duration of antimicrobial therapy reported that patients in ASP intervention groups received a shorter duration of targeted or overall antimicrobial therapy (see Supplementary Appendix 1) [26, 27, 29, 30].
Changes in healthcare cost after ASP implementation were evaluated in 13 studies (Table 1) [16, 18, 20, 21, 25, 27, 30, 37, 43, 45, 48, 53, 59]. Most of these studies focused on changes in the total costs of antimicrobials or audited antimicrobials. However, the methodology for evaluating cost varied significantly in each study. Additionally, 2 studies evaluated the cost of hospitalization [18, 53]. All of the studies demonstrated a reduction in cost after the implementation of ASPs (range, 9.7%–58.1% reduction in cost in the intervention period/arm).
Changes in Cost After the Implementation of Antimicrobial Stewardship Programs
| Study | Country or Region | Type of Costs | Cost Changes Between Intervention vs Control or Prior to Intervention (% Change) | Statistical Significance |
|---|---|---|---|---|
| Two-group comparative study | ||||
| Cai, 2016 [30] | Singapore | Cost of total antimicrobial use | Reduced SGD 90045 after intervention (details NA) | ND |
| Taniguchi, 2015 [59] | Japan | Cost of total antimicrobial use | JPY 5409051 vs JPY 12894159 (58.1% reduction) | ND |
| Shen, 2011 [18] | China | Cost of individual antimicrobial use (mean ± SD) and individual hospital hospitalization (mean ± SD) | Antimicrobial use: USD 832.0 ± 373.0 vs 943.9 ± 412.0 (13.3% reduction) Hospitalization: USD 1442.3 ± 684.9 vs $1729.6 ± 773.7 (16.6% reduction) | P = .01 P < .001 |
| Before–after trial | ||||
| Fukuda, 2014 [25] | Japan | Cost of antimicrobial therapy per 1000 patient-days (mean) | USD 4555.0 vs 6133.5 per 1000 patient- days (25.8% reduction) | P = .005 |
| Lin, 2013 [45] | Taiwan | Cost of antimicrobial therapy per 1000 patient-days (mean) | USD 12146 vs 21464 per 1000 patient- days (43.4% reduction) | P = .02 in trend analysis |
| Teo, 2012 [21] | Singapore | Cost of total and audited antimicrobial use in 12-mo periods | Total antimicrobials: reduced USD 141554 in (7.1% reduction) after intervention Audited antimicrobials: reduced USD 198575 (13.2% reduction) after intervention | P = .15 P = .01 |
| Ikeda, 2012 [37] | Japan | Cost of total antimicrobial use in 14-mo periods | USD 2.73 million vs 3.49 million (21.7% reduction) | ND |
| Niwa, 2012 [20] | Japan | Annual cost of total antimicrobial use | USD 1.86 million vs 2.02 million (11.7% reduction) | ND |
| Miyawaki, 2010 [43] | Japan | Annual cost of total antimicrobial use | JPY 262528000 vs 290596000 (9.7% reduction) | ND |
| Cheng, 2009 [16] | Hong Kong | Annual cost of total antimicrobial use | USD 1.32 million vs 1.50 million (12.0% reduction) | ND |
| Ng, 2008 [48] | Hong Kong | Annual cost of total antimicrobial use Monthly cost of restricted antimicrobial use per 1000 patient-days Monthly cost of nonrestricted antimicrobial use per 1000 patient-days | USD 1.65 million vs 1.96 million (15.8% reduction) USD 3906 vs 7293 (46.4% reduction) USD 3946 vs 4414 (11.9% increase) | ND P < .001 P = .003 |
| Apisarnthanarak, 2007 [53] | Thailand | Mean cost of antibiotics and hospitalization for treatment of VAP per patient | Antibiotics: USD 2378 vs 4769 (45%– 50% reduction) Hospitalization: USD 254 vs 466 (37%–45% reduction) | P < .001 P < .001 |
| Apisarnthanarak, 2006 [41] | Thailand | Total cost saving from the reduction in antimicrobial use | USD 52219 vs 84450 (38.2% reduction) | P < .001 |
Abbreviations: JPY, Japanese yen; NA, not available; ND, not documented; SD, standard deviation; SGD, Singapore dollar; USD, United States dollar; VAP, ventilator-associated pneumonia.
A summary of the effect of ASPs on the incidence and resistance rate of selected microorganisms and healthcare-associated infections in studies from the Asia Pacific region is shown in Table 2. Given the limited number of studies, differences in methods evaluating microbiological outcomes or targeted microorganisms, and strong heterogeneity, meta-analyses of these outcomes could not be performed. Trends in multidrug-resistant or carbapenem-resistant gram-negative organisms were commonly assessed, especially in studies conducted in Southeast Asia. The incidence of Clostridium difficile infection was assessed in fewer studies [26, 29]. An overall trend toward a decrease in incidence and resistance rate after implementation of ASPs was observed in C. difficile infection, methicillin-resistant Staphylococcus aureus, and multidrug-resistant and/or carbapenem-resistant Pseudomonas species and Acinetobacter species, although there were significant variations in the targeted metrics of microbiological outcomes for intervention assessment.
Changes in Incidence and Resistance Rate of Common Microorganisms or Infections After Implementation of Antimicrobial Stewardship Programs in the Asia Pacific Region
| Incidence of Microorganisms or Infections | Range, Absolute Risk Difference After ASP Implementation | Studies, First Author |
|---|---|---|
| Clostridium diffcile infection Incidence | −3.2% to −1.2% | Liew, 2015 (Singapore, [29]); Lew, 2015 (Singapore, [26]) |
| MRSA Overall incidence density Resistance rate | −1.4 to −0.9 per 1000 patient-days −14.5% to 0% | Chen, 2015 (Taiwan, [28]); Fukuda, 2014 (Japan, [25]); Yeo, 2012 (Singapore, [22]); Niwa, 2012 (Japan, [20]); Miyawaki, 2010 (Japan, [43]), Buising, 2008 (Australia, [34]); Apisarnthanarak, 2006 (Thailand, [41]) |
| ESBL-producing Enterobacteriaceae Overall incidence density Proportion of ESBL-producing Enterobacteriaceae | −0.1 per 1000 patient-days −12.0% to +12.5% | Chan, 2011 (Taiwan, [36]); Fukuda, 2014 (Japan, [25]); Kim, 2008 (Korea, [35]); Apisarnthanarak, 2006 (Thailand, [41]) |
| MDR or carbapenem-resistant Pseudomonas spp Overall incidence density Proportion of carbapenem-resistant Pseudomonas spp | −0.5 per 1000 patient-days −22.2% to +1.5% | Fukuda, 2014 (Japan, [25]); Zou, 2015 (China, [51]); Chen, 2015 (Taiwan, [28]); Yeo, 2012 (Singapore, [22]); Niwa, 2012 (Japan, [20]); Ikeda, 2012 (Japan, [37]); Yong, 2010 (Australia, [61]), Kim, 2008 (Korea, [35]) |
| MDR or carbapenem-resistant Acinetobacter spp Overall incidence density | −20.14 to −0.1 per 1000 patient-days −40.0 per person-years per 100000 admissions | Cheon, 2016 (Korea, [31]); Chen, 2015 (Taiwan, [28]), Lew, 2015 (Singapore, [26]); Yeo, 2012 (Singapore, [22]); Kim, 2008 (Korea, [35]) |
| Proportion of MDR or carbapenem- resistant Acinetobacter spp | −7.1% to +37.5% |
Abbreviations: ASP, antimicrobial stewardship program; ESBL, extended-spectrum β-lactamase; MDR, multidrug-resistant; MRSA, methicillin-resistant Staphylococcus aureus.
DISCUSSION
In this systematic review, the impact of ASPs on various outcomes in treatment facilities in the Asia Pacific region was investigated. Because of significant variations in interventions, and outcome measurements in each ASP in the studies, the quantitative and qualitative syntheses of targeted outcomes were crucial in assessing the efficacy of ASPs from various perspectives.
Our meta-analysis demonstrated that the implementation of effective ASPs led to a decrease in mortality in the 2-group comparative studies, and unchanged mortality in before–after trials. This finding corroborates the safety and effectiveness of ASPs without compromising clinical outcomes in this region. Because antimicrobial stewardship strategies include restrictive (eg, preauthorization) and persuasive (eg, prospective audit and feedback) interventions to modify prescribers’ behaviors (ie, de-escalation of broad-spectrum antimicrobials or discontinuation of antimicrobials) [4], ensuring the safety of ASPs is extremely important to promote ASPs further in this region.
Our analysis also suggests that ASP implementation was associated with approximately 10% reduction of both carbapenem and overall antimicrobial consumption, although the finding in the meta-analysis was unconfirmed due to heterogeneity. Variations in intervention, antimicrobials targeted in the ASP, and sample size likely contributed to this heterogeneity. Nevertheless, ASPs in inpatient settings led to decreasing antimicrobial consumption across countries, as consistent with a previous study [15]. However, the previous study also noted that the extent of the decrease in antimicrobial consumption was smaller in the Asian studies compared with studies from the United States or Europe. The obstacles to decreasing antimicrobial consumption in inpatient settings in the Asia Pacific region are likely multifactorial, such as the lack of well-established infectious disease clinical training for hospital pharmacists, and the paucity of infectious diseases specialists to oversee ASPs [27, 62].
Besides limited human resources engaging ASPs, differences in clinical settings or circumstances might be associated with the difficulty of decreasing antimicrobial consumption in the Asia Pacific region. Because of high prevalence of drug-resistant gram-negative organisms, particularly in Southeast Asia [63], multiple, broad-spectrum antimicrobials are frequently administered to treat these pathogens. Among the countries in this region with an aging population, prolonged antimicrobial therapy may be more frequently administered when treating elderly patients. Insufficient clinical infectious diseases training for physicians/general practitioners may lead to overprescription or inappropriate use of antimicrobials, particularly in regions or countries with rapidly advancing medical practice and improving access to broad-spectrum antimicrobials, corresponding with economic development.
There are some limitations in our meta-analysis. We were unable to assess the efficacy of ASPs across all countries in the Asia Pacific region because few published studies were available from these countries. Of note, maximizing access to appropriate antimicrobials remains the most important consideration among the middle- and low-income nations in this region [64]. Furthermore, because some of the included studies were published at the same institutions, portions of the data might have been duplicated and thus led to the overestimation of the efficacy of ASPs. As with many ASPs in other countries or regions, most ASPs in the Asia Pacific region were multifaceted and outcome measurements significantly varied in each study. It is difficult to determine which core elements mostly contributed to the success of the ASPs. As seen in Table 2, some studies evaluated the impact of ASPs on antimicrobial-resistant organisms, but the long-term effects are not clearly understood.
Implementation of successful ASPs is a particularly urgent matter in the Asia Pacific region owing to the high prevalence of multidrug-resistant organisms in countries within this region [62]. Further studies are needed to understand the issues and challenges facing ASPs. High-quality studies using standardized surveillance methodology for antimicrobial consumption and similar metrics for outcome measurement are needed. Additional studies focused on long-term effects of antimicrobial-resistant organisms and economic impacts should be pursued.
Antimicrobial stewardship is acknowledged as one of the important core strategies to reducing antimicrobial resistance. Following the global action plan on antimicrobial resistance by the WHO, national-level antimicrobial resistance action plans have been evolving across countries in the Asia Pacific region [65, 66]. Continued monitoring of the success of ASPs in each country and the effects of international collaborative action of ASPs in the region will contribute to public awareness of antimicrobial resistance and incentivize policymakers to develop sustainable and effective action plans suited best to the Asia Pacific region.
Author contributions. H. H., Y. T., and D. K. W. designed the study protocol. H. H. and O. N. performed the literature search. H. H. and O. N. did data cleaning. Y. T. performed data analysis. H. H. drafted the first version of the manuscript. H. H. drafted the tables and figures, which were revised by C. M.. All authors revised the manuscript and contributed to the final version of manuscript.
Financial support. This work was supported by the Japan Society for the Promotion of Science KAKENHI (grant number 16K09196).
Supplement sponsorship. This article appears as part of the supplement “Infection Prevention in Asia Pacific,” sponsored by the Infectious Diseases Association of Thailand (IDAT).
Potential conflicts of interest. All authors: No potential conflicts. All authors have submitted the ICMJE Form for Disclosure of Potential Conflicts of Interest, and the conflicts that the editors consider relevant to this article are disclosed here.
References
Author notes
Correspondence: H. Honda, Division of Infectious Diseases, Tokyo Metropolitan Tama Medical Center, Tokyo, Japan, Address: 2-8-29, Musashidai, Fuchu, Tokyo, 1838524, Japan (hhhhonda@gmail.com).


Comments