


Abstract
Aims Acute myocardial infarction (AMI) is categorized, according to the presenting electrocardiogram, into non-ST-elevation myocardial infarction (non-STEMI), ST-elevation myocardial infarction (STEMI), or bundle branch block myocardial infarction (BBBMI). Data on the prognostic significance of these categories mainly originate from voluntary based registries or large-scale clinical trials and may be hampered by selection and information bias. The aim of this historical cohort study was to evaluate the prognostic significance of different categories of AMI in an unselected cohort.
Methods and results From 1 November 1999 to 31 October 2001, patient records were reviewed from all admissions to hospitals serving a study region with 139 000 inhabitants. An Endpoint Committee determined whether patients fulfilled the European Society of Cardiology criteria of AMI. A total of 654 patients with AMI were identified. The proportion having non-STEMI, STEMI, and BBBMI was 54, 39 and 6%, and the associated 1 year mortality was 31, 21, and 55%, respectively (log rank 54, P<0.001). The more favourable outcome observed in patients with STEMI remained significant according to multivariable analysis (P=0.044).
Conclusion In an unselected cohort of patients admitted with AMI, the mortality was considerably higher than expected from voluntary-based registries and large-scale clinical trials. The most favourable outcome is observed in patients with STEMI.
for the editorial comment on this article (doi:10.1093/eurheartj/ehi062)
Introduction
Acute myocardial infarction (AMI) is categorized, according to the presenting electrocardiogram (ECG), into non-ST-elevation myocardial infarction (non-STEMI), ST-elevation myocardial infarction (STEMI), or bundle branch block myocardial infarction (BBBMI).1 Treatment is tailored according to these categories. Thus, patients with non-STEMI should be stabilized medically and scheduled for an early (within days) interventional strategy.2,3 Patients with STEMI or BBBMI should be treated acutely with thrombolysis or primary percutanous coronary intervention (primary PCI), if admitted within 12 h of onset of symptoms.1,4–6
Hitherto, data on prognosis according to the different categories of AMI mainly originated from registries based on voluntarily reported cases,7–9 or from large-scale randomized controlled trials with numerous inclusion and exclusion criteria. These registries and trials may be hampered by selection and information bias.
The purpose of this study was to evaluate the prognostic significance of the different categories of AMI in an unselected cohort of patients.
Methods
Population
The study region encompassed 139 000 inhabitants. A local hospital (Randers County Hospital) and an interventional centre with primary PCI facilities (Skejby University Hospital) served the study region. The interventional centre was located 35 km from the local hospital. From 1 November 1999 to 31 October 2001, all hospital admissions were registered to identify: (i) all patients who were admitted as emergencies to the coronary care unit at the local hospital (any hospital diagnosis); (ii) all patients assigned a hospital diagnosis of AMI at other medical departments at the local hospital; and/or (iii) patients transferred acutely to the interventional centre for primary PCI. Patients transferred from other departments due to peri-operative myocardial infarction, or from other hospitals in which they initially had been treated for AMI, were excluded. Patient records and laboratory data were reviewed. ECGs for the first 48 h of admission, and an ECG from a previous admission (if present) were collected for the following patients: (i) patients with a rise in coronary biochemical markers {creatinine kinase (CK) level≥150 U/L, creatinine kinase myocardial band+brain band [CK(M)B+BB] level≥12 U/L, creatinine kinase myocardial band (CKMB) level≥10 µg/L or troponin-T (tnT) level≥0.10 µg/L} within 24 h of admission; (ii) patients treated with thrombolysis or primary PCI; (iii) patients assigned a hospital diagnosis of AMI at discharge; and (iv) patients assigned a pre-hospital or in-hospital working diagnosis of STEMI or BBBMI. To identify patients who fulfilled the European Society of Cardiology (ESC) and American College of Cardiology (ACC) criteria of AMI10 within 24 h of admission, an Endpoint Committee (C.J.T., J.F.L., B.L.N. and J.C.G.) reviewed all the collected material. If agreement was reached between two members of the Endpoint Committee then the diagnosis of AMI was accepted, otherwise additional members were consulted and a majority vote accepted. In addition to the ESC/ACC criteria of AMI, the Endpoint Committee accepted a diagnosis of AMI in patients dying prior to blood sampling or before a possible rise in coronary biochemical markers could be detected, if typical symptoms and ECG signs of AMI were present on admission. A diagnosis of aborted MI was accepted in patients with normal levels of coronary biochemical markers, if the patient presented with typical symptoms of AMI and ST-elevation that disappeared after early initiation of reperfusion therapy.
Based on the presenting ECGs, the Endpoint Committee categorized the type of AMI: STEMI was present if ST-segment elevation occurred in two adjacent leads (≥0.1 mV in lead I, II, III, aVF, aVL, V4–V6 or ≥0.2 mV in leads V1–V3). If new (or presumably new) bundle branch block (BBB) was present (absence of BBB on prior admission or no prior ECG) the AMI was categorized as BBBMI. The remaining patients, including those with pacemaker-rhythm and pre-existing BBB, were categorized as having non-STEMI. If signs of AMI were not present on admission but appeared within 24 h of admission, the subtype of AMI was categorized according to the assumed index ECG.
Data collection
The following variables were registered from the patient files: age, sex, history of hypertension, diabetes, congestive heart failure (CHF), angina pectoris (AP), previous myocardial infarction (MI), coronary artery bypass grafting (CABG), or PCI, smoking (within 1 year), pre-hospital contact with a primary care physician, ambulance transportation or not to hospital, on-scene delay (time from ambulance arrival on-scene to scene departure), transport delay (time from ambulance call to arrival at hospital), pre-hospital delay (time from onset of symptoms to arrival at hospital), medical treatment on admission, heart rhythm and rate in the admission ECG, type of reperfusion therapy (thrombolysis or primary PCI), hyperlipidaemia (treatment with lipid-lowering drugs on admission or at discharge, total cholesterol >5.0, or low-density lipoprotein >3.0), peak level of coronary biochemical markers and plasma creatinine within 72 h of admission, PCI or CABG performed during hospitalization or scheduled at discharge, ejection fraction (by echocardiography or ventriculography), and medication at discharge. The 1 November 2003 available data from the first coronary angiography performed following the index myocardial infarction (number and location of diseased vessels with stenosis >50%) were collected from a central administrative angiography registry, and mortality data were registered using the Civil Registration system registry (CPR registry) in Denmark. Median follow-up time was 2.4 years (inter-quartile range: 0.6–3.1 years).
Statistics
Categorical variables are expressed as % (n) and continuous variables as medians (inter-quartile range). The Fisher Exact test and Kruskal–Wallis test were used for comparison of categorical and continuous variables as appropriate. Unadjusted survival data are plotted as Kaplan–Meier curves, and comparison between groups was performed using log rank statistics. Cox regression analysis was used to evaluate the prognostic significance of the following variables concerning mortality at follow-up: age, sex, history of hypertension, diabetes, CHF, AP, or MI, smoking (within 1 year), pre-hospital contact with primary care physician, ambulance transportation or not to hospital, on-scene delay, transport delay, pre-hospital delay, heart rhythm and rate in the admission ECG, ejection fraction, hyperlipidaemia, peak level of coronary biochemical markers and plasma creatinine within 72 h of admission, medical treatment on admission, and coronary angiography data (number and location of diseased vessels with stenosis >50%). Hazard ratios (95% CI) are presented. The proportional hazard assumption was checked for each categorical variable through visual inspection and by the method described by Grambsch and Therneau,11 using the Schoenfeld residuals. For continuous variables, the linearity assumption was checked graphically for all variables using the Martingale residuals. Analysis of interaction between covariates was made for the categories of AMI vs. coronary biochemical marker rise. Variables with P<0.20 in the univariable Cox regression analysis were included in the multivariable Cox regression model. However, the following variables were not considered for inclusion in the multivariable model since data were only available in a minority of patients: CK, CK(M)B+BB, and coronary angiography data. The number of parameters included in the multivariable model was held below one-tenth of the number of events. Variable selection was performed in the multivariable Cox regression analysis as a stepwise backward elimination method, each time excluding the one variable with the highest P value according to Wald statistics. The final model (Model I) included variables with P<0.05. The importance of the categories of AMI in the final model was tested using a Likelihood Ratio test (LR test) comparing the full model with a sub-model not including the categories of AMI. The final model was refitted in the whole population by replacing missing values with their conditional means (continuous variables) or conditional probabilities (categorical variables) (Model II). These imputed values were obtained as predictions from a regression model or logistic model using all non-missing covariates in each subject.12,13 A third multivariable model (Model III) was presented implementing a fourth category of AMI (non-STEMI with pre-existing BBB). Statistical significance level was P<0.05 (two-sided test). The software packages SPSS 10.0 and STATA 8.0 were used for statistical analyses.
Results
In the 2 year study period, hospital records and laboratory data were reviewed from 4815 patient admissions. The Endpoint Committee identified 727 cases of AMI in 654 patients, and categorized 57.6% (n=419) as non-STEMI, 36.5% (n=265) as STEMI, and 5.9% (n=43) as BBBMI. In 11 cases the Endpoint Committee confirmed a hospital diagnosis of AMI despite the lack of coronary biochemical marker rise: 1 with aborted MI, whereas the remaining 10 presented with classical symptoms and ECG manifestations of AMI, however, death occurred before blood sampling or a rise in biochemical markers could be detected (four with non-STEMI, four with STEMI, and two with BBBMI). Including patients first registered at admission only, 54.1% (n=354) of AMIs were categorized as non-STEMI, 39.4% (n=258) as STEMI, and 6.4% (n=42) as BBBMI.
When compared with patients with non-STEMI and BBBMI, patients with STEMI were younger, more often male, less often with a history of diabetes, CHF, or previous MI, with a shorter pre-hospital delay and lower heart rate on admission, more often with sinus rhythm on admission and hyperlipidaemia, and presenting a higher peak coronary biochemical marker rise and lower peak creatinine level (Table 1). Patients with non-STEMI had a higher ejection fraction compared with patients with STEMI and BBBMI (Table 1). No difference in the number and location of diseased coronary vessels could be demonstrated between patients according to the different categories of AMI (Table 1).
Patients with STEMI were less often treated with angiotensin-converting enzyme inhibitors, angiotensin-2-antagonists, beta-blockers, aspirin or diuretics on admission, and diuretics at discharge, and more often with beta-blockers, clopidogrel and lipid-lowering drugs at discharge, when compared with the rest of the study group (Table 2).
Among patients with STEMI, 79% (n=205) were admitted within 12 h of symptom onset, 70% (n=143) of the latter were treated acutely with reperfusion therapy (Table 3). Median (IQR) age among patients with STEMI receiving reperfusion therapy was 65 (56–73) years, and median (IQR) pre-hospital delay 2.3 (1.1–4.5) h. Among patients with non-STEMI, 48% (n=170) were scheduled for an early interventional strategy (Table 3). The latter patients had a median (IQR) age of 67 (58–76) years and presented with a median (IQR) pre-hospital delay of 4.0 (1.8–7.6) h.
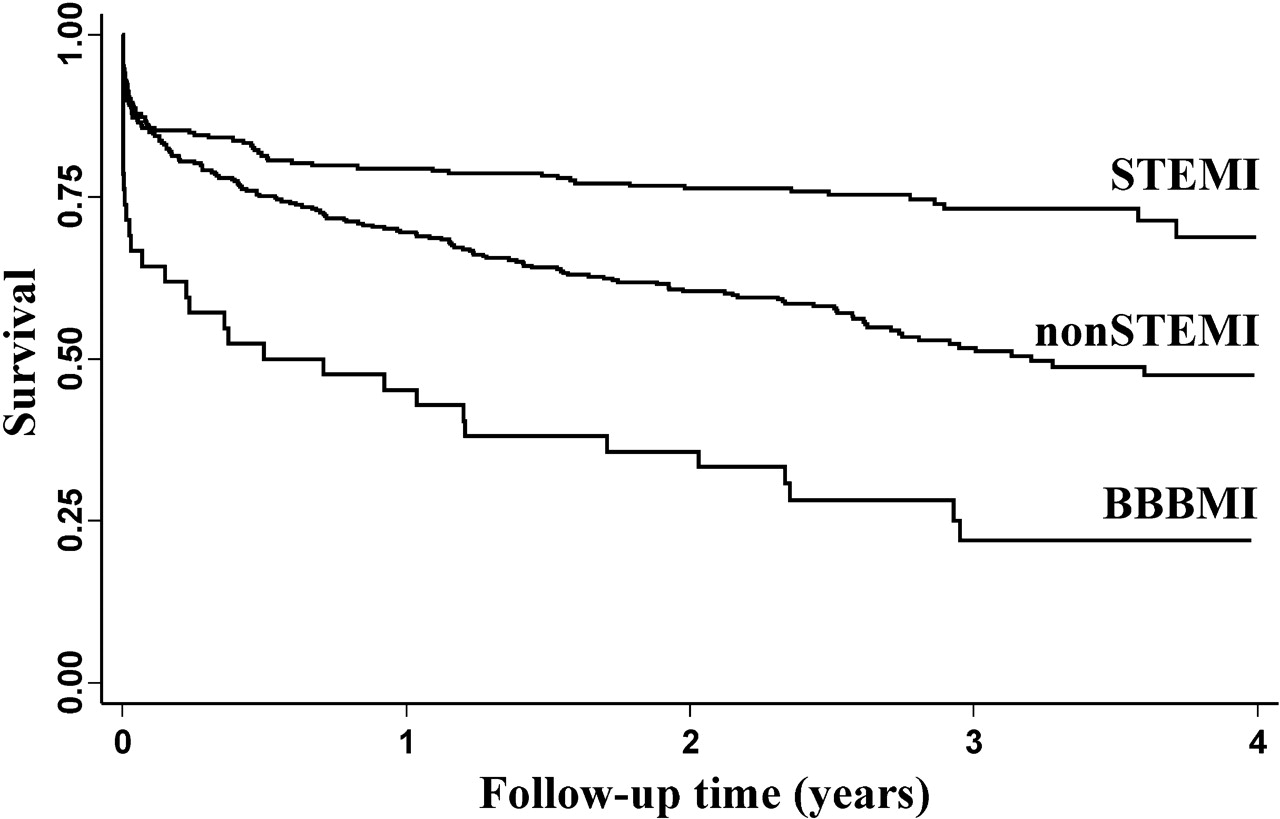
The unadjusted 1 year mortality was 28.1% in the complete cohort, being 30.5%, 20.5%, and 54.8% in patients with non-STEMI, STEMI, and BBBMI, respectively (log rank 54, P<0.001) (Table 3) (Figure 1). Lower 1 year mortality was observed in patients admitted within 12 h of symptom onset (n=433) compared with patients admitted later after the onset of symptoms (n=221) (22.9% vs. 38.5%, log rank 30, P<0.001). Among patients with non-STEMI, lower 1 year mortality was observed in patients scheduled for an early interventional strategy (n=170) compared with patients treated conservatively (n=184) (10.0% vs. 49.5%, log rank 95, P<0.001). Among patients with STEMI admitted within 12 h of symptom onset, lower 1 year mortality was observed in those treated with reperfusion therapy (n=143) compared with those treated conservatively (n=62) (10.5% vs. 33.9%, log rank 18, P<0.001). Among patients with non-STEMI, 10.5% (n=37) had pre-existing BBB. These patients had a higher 1 year mortality compared with non-STEMI without pre-existing BBB (n=317) (50.0% vs. 28.4%, log rank 10, P=0.015).
Variables predicting mortality at follow-up according to univariable Cox regression analyses are presented in Table 4. TnT did not provide prognostic information in the complete study cohort, and high levels of CK, CK(M)B+BB as well as CKMB were associated with an improved clinical outcome (Table 4). Sub-analyses revealed statistical interaction between the categories of AMI and biochemical marker rise, thus, the latter associations were not statistically significant within the different categories of AMI. Within the group of non-STEMI patients high levels of tnT were associated with poor prognosis [hazard ratio=RR=1.124 (1.037–1.219), P=0.005].
The following risk variables provided independent prognostic information in multivariable analysis: age, peak creatinine level within 72 h of admission, history of CHF, pre-hospital delay, ejection fraction, and category of AMI (Model I) (Table 5). When refitting the model in the whole population, based on imputed missing values, pre-hospital delay did not remain significant (Model II) (Table 5). When including a fourth category of AMI, patients with non-STEMI and pre-existing BBB presented an intermediate hazard compared with non-STEMI-patients without pre-existing BBB and patients with BBBMI (Model III) (Table 5).
Discussion
The aim of the present study was to evaluate the prognostic significance of different categories of AMI in an unselected cohort of patients. In these terms it is considered as a ‘confirmative prognostic factor study’.14
We believe that this study is unique in that a total cohort of patients admitted with AMI from the chosen study region was identified, a diagnosis of AMI was only accepted if confirmed by an Endpoint Committee and fulfilling the ESC/ACC criteria of AMI (with minor modifications), and the three categories of AMI (non-STEMI, STEMI, and BBBMI) were accepted as independent entities, thus STEMI and BBBMI were not combined. Thereby, potential selection and information bias was limited.
The present study was performed during the same period as the Global Registry of Acute Coronary Events (GRACE), the Euro Heart Survey of Acute Coronary Syndromes (EHS-ACS), and the third National Registry of Myocardial Infarction (NRMI-3).8,9,15,16 Nonetheless, the proportion of patients with STEMI was 52% in GRACE15 and 63% in EHS-ACS,8 hence considerably higher than the 39% observed in the present study. Moreover, the in-hospital mortality of 5% observed in both GRACE and EHS-ACS,8,15 as well as the in-hospital mortality of 9% observed in NRMI-3,9 were lower than the 14% observed in the present study. These discrepancies may be explained by the fact that all three registries relied on voluntarily reported cases. Thus, it may be that large myocardial infarctions (instantly detectable on admission) were more likely to be registered, resulting in a higher proportion of patients with STEMI being included. Moreover, no methods ensured that consecutive patients were included in these registries. In GRACE and EHS-ACS, some patients were required to give consent to join the registries, a strategy potentially leading to exclusion of high-risk patients who could not receive information or give written consent.8,15 Patients dying within 24 h of admission tended to be excluded from GRACE, which also in part explains the low mortality observed.17,18 In EHS-ACS a high proportion of patients were registered at academic centres with revascularization facilities, hence potentially resulting in selection bias and contributing to the lower mortality observed.8 In GRACE, patients with BBBMI were categorized as STEMI, thus any improved outcome in patients with STEMI as compared to non-STEMI may have been underestimated.19 Finally, in none of the three registries was an Endpoint Committee consulted to reach agreement upon diagnosis, thus potentially leading to information bias.8,9 The mortality observed in the present study was also considerably higher than expected from numerous large-scale clinical trials, in which 1 year mortality consistently is reported as <10%.5,6,20–24 Possible explanations are that numerous inclusion and exclusion criteria are implemented in the latter trials, patients included in the latter trials are admitted in a favourable condition enabling them to give written informed consent, and the proportion of patients receiving optimal reperfusion therapy is considerably higher in the latter trials when compared with the real world scenario.7 Moreover, an inherent selection bias is always present in large-scale clinical trials as evident from the fact that higher mortality is observed among those eligible for inclusion but not included in the trials.25,26 The latter is consistent with the findings in the present study, in which the subgroup of patients with STEMI treated with reperfusion therapy had significantly lower mortality when compared with remaining STEMI patients admitted within 12 h of symptom onset.
The observation in the present study that patients with non-STEMI have higher unadjusted mortality compared with patients with STEMI has previously been explained by the fact that the former patients have more pronounced co-morbidity as well as more frequent multi-vessel disease.16 Indeed, we found several risk factors to be more frequent among non-STEMI patients. However, there were no differences in the number of diseased vessels, and ejection fraction was higher, and coronary biochemical marker release lower, among patients with non-STEMI compared with patients with STEMI. Moreover, the more favourable outcome in patients with STEMI remained significant according to multivariable Cox regression analyses. It may also be speculated that a part of the more favourable outcome in patients with STEMI is influenced by different treatment strategies. In the FRISC-II and TACTICS trials a benefit from an early interventional treatment strategy was documented in patients with non-STEMI.27 However, the present study was performed in a period in which the early interventional strategy was not fully implemented. Nonetheless, one-half of patients with non-STEMI were scheduled for an early interventional strategy, comparable to the findings in GRACE.7,19
The availability in the present study of new biochemical markers such as the troponins in the majority of patients, combined with the Endpoint Committee's implementation of the redefined ESC/ACC criteria of AMI, may also contribute to the lower number of patients categorized as STEMI when compared with GRACE and EHS-ACS, as well as the higher mortality observed in patients with non-STEMI compared with patients with STEMI. Previous findings indicate that changing the AMI diagnostic strategy, from the older WHO to the ESC/ACC criteria introduced in 2000, leads to the identification of nearly 50% additional patients.28 The majority of these patients are categorized as having non-STEMI, and among these higher mortality is observed when compared with patients identified by the WHO criteria.28
The mortality among patients with BBBMI was extremely high in the present study consistent with previous findings.29,30 Likewise, patients with BBBMI were found to have more co-morbid illness than those with non-STEMI or STEMI.29 The proportion of patients with BBBMI was lower than the 13% observed in the Second National Registry of Myocardial Infarction (NRMI-2).29 In the latter registry, however, all patients admitted with AMI and BBB were categorized as BBBMI. In the present study, patients with AMI who had pre-existing BBB (identified on previous admission) were categorized as non-STEMI. This may in part explain the higher in-hospital mortality observed among BBBMI patients when compared with the 23% observed in NRMI-2. The use of reperfusion therapy in patients with BBBMI admitted within 12 h of symptom onset was comparable to the 8% observed in NRMI-2.29 The hesitation to initiate reperfusion therapy in patients with BBBMI probably relies on the fact that the diagnosis is difficult to establish in the acute phase, and it may be speculated whether referral of all chest pain patients with documented or presumably new BBB (normal previous ECG or no previous ECG) to an interventional centre is the optimal diagnostic strategy. Whether patients with AMI and pre-existing BBB should be categorized as having non-STEMI may be a matter of controversy. Certainly, an intermediate hazard was observed in these patients compared with remaining patients with non-STEMI and patients with BBBMI. However, we believe that the implemented categories are the ones used in real life when tailoring therapy. Furthermore, implementation of a fourth category of AMI (non-STEMI with pre-existing BBB) in the multivariable analysis did not seem to change the hazard in patients having non-STEMI without pre-existing BBB. The broader confidence limits observed probably reflect the limited power of the present study, thus indicating the need for larger confirmative prognostic studies in the future.
Rather unexpectedly we found that the tnT level did not provide independent prognostic information in the complete cohort of patients with AMI, but within the group of patients having non-STEMI. This is explained by interaction between variables, i.e. mortality was lower, but the tnT rise higher, in patients with STEMI compared with patients with non-STEMI. In patients with STEMI, the high tnT levels may in part be a mere result of tnT release in relation to reperfusion therapy. Thus, the prognostic information achieved from biochemical markers probably should be interpreted according to the category of AMI.
The higher patient age and more prolonged pre-hospital delay observed in the present study compared with GRACE and EHS-ACS is also expected to reflect the real-life scenario. Thus, among patients with STEMI treated with reperfusion therapy and patients with non-STEMI scheduled for an early interventional strategy, the median age was comparable to previous observations in large-scale European trials.20,27 This is consistent with findings by Jha and colleagues31 reporting a considerably higher age among non-trial patients compared with trial patients. In patients with STEMI treated with reperfusion therapy the median pre-hospital delay was even shorter in the present study compared with EHS-ACS.8
Study limitations
As in any study, potential residual confounding may have been present, i.e. inclusion of other baseline variables could have delivered additional prognostic information. Certainly, Killip class was considered for inclusion in the Cox regression analysis. However, this parameter was not routinely registered in the patient records. Furthermore, Killip class may be considered as a consequence of the category of AMI, i.e. a higher Killip class is expected in patients with STEMI because of a greater deterioration in left ventricular function.32,33 In this setting inclusion of Killip class would result in over-adjustment and thus underestimate the real prognostic information achieved from the AMI categorization. Selection bias was limited. In Denmark, all AMI patients are admitted to public hospitals, and only two hospitals served the study region, hence all hospital-admitted patients should have been identified. However, a small number of patients initially admitted to the emergency care unit may have died immediately following admission before being assigned to a ward. Any such patients would be missed in the present study, but they would be few in number and, if anything, result in an underestimation of mortality. Potential information bias was also limited because the AMI diagnosis was only accepted if confirmed by an Endpoint Committee. Concerning the external study validity, one should always be cautious in extrapolating the results to other regions, and the present findings are at most representative for hospital-admitted patients with AMI since the study did not include non-admitted patients.
Perspectives
The high mortality observed in the present study compared with consistently lower mortality reported in voluntary-based registries and large-scale clinical trials calls for care when extrapolating results and outcomes of voluntary registries and clinical trials to the real world clinical scenario. In planning future trials, one should implement this knowledge and consider limiting the number of inclusion and exclusion criteria to achieve higher event rates and improve the external study validity. Assuming that the strategy of acute reperfusion therapy and adjunctive medication contributes to the more favourable outcome observed in patients with STEMI, further clarification of the role of catheter-based and adjunctive pharmacological interventions in patients with BBBMI and non-STEMI are needed.
Conclusion
In an unselected cohort of patients admitted with AMI, the mortality is considerably higher than expected from voluntary-based registries and large-scale clinical trials, and the most favourable outcome is observed in patients with STEMI.
Acknowledgements
Professor Werner Vach, Department of Statistics, University of Southern Denmark is thanked for statistical support. The study was supported by the Danish Heart Foundation (Grant 01-2-3-28A-22925 and 02-2-3-58-22026), the Laerdal Foundation of Acute Medicine, Karl G Andersons Foundation, The A.P. Møller Foundation for the Advancement of Medical Science, Elin Holms Foundation and Kirsten Anthonius' Foundation.
Figure 1 Unadjusted Kaplan–Meier survival curves for different categories of acute myocardial infarction. STEMI: ST-elevation myocardial infarction. Non-STEMI: non-ST-elevation myocardial infarction. BBBMI: myocardial infarction with newly developed bundle branch block.
Baseline characteristics, in-hospital and post-discharge data according to different categories of acute myocardial infarction
| Non-ST-elevation myocardial infarction | n | ST-elevation myocardial infarction | n | Bundle branch block myocardial infarction | n | P | |
|---|---|---|---|---|---|---|---|
| Age (years) | 75 (65–81) | 354 | 69 (58–77) | 258 | 80 (74–85) | 42 | <0.001 |
| Male sex | 58% (205) | 354 | 67% (172) | 258 | 52% (22) | 42 | 0.043 |
| Medical history of | |||||||
| Hypertension | 25% (89) | 353 | 24% (63) | 258 | 31% (13) | 42 | 0.64 |
| Diabetes | 23% (80) | 354 | 14% (35) | 258 | 40% (17) | 42 | <0.001 |
| Heart failure | 14% (50) | 354 | 2% (4) | 257 | 17% (7) | 42 | <0.001 |
| Angina pectoris | 50% (175) | 353 | 41% (105) | 257 | 38% (16) | 42 | 0.063 |
| Myocardial infarction | 26% (92) | 353 | 11% (29) | 257 | 21% (9) | 42 | <0.001 |
| CABG | 3% (12) | 353 | 1% (3) | 257 | 0% (0) | 42 | 0.17 |
| PCI | 4% (13) | 354 | 3% (7) | 257 | 5% (2) | 42 | 0.65 |
| Smoking (within 1 year) | 68% (202) | 296 | 74% (167) | 225 | 60% (18) | 30 | 0.14 |
| Pre-hospital data | |||||||
| Contact with primary care physician | 73% (260) | 354 | 67% (174) | 258 | 74% (31) | 42 | 0.26 |
| Transported by ambulance | 85% (288) | 339 | 84% (213) | 253 | 88% (35) | 40 | 0.91 |
| On-scene delay (min) | 12 (8–15) | 190 | 12 (8–16) | 158 | 13 (8–17) | 17 | 0.89 |
| Transport delay (min) | 36 (25–49) | 266 | 35 (25–46) | 196 | 30 (21–51) | 32 | 0.29 |
| Pre-hospital delay (h) | 4.8 (2.0–12) | 267 | 3.3 (1.5–8.5) | 240 | 4.5 (2.1–15) | 36 | 0.025 |
| ECG data on admission | |||||||
| Non-sinus rhythm | 27% (95) | 346 | 12% (28) | 243 | 36% (15) | 42 | <0.001 |
| Heart rate (per min) | 91 (70–113) | 344 | 77 (62–93) | 243 | 111 (87–129) | 42 | <0.001 |
| Ejection fraction | 55 (38–60) | 267 | 49 (36–60) | 204 | 35 (25–45) | 27 | <0.001 |
| Hyperlipidaemia | 59% (209) | 352 | 69% (177) | 256 | 60% (24) | 40 | 0.041 |
| Laboratory data | |||||||
| Peak CK (U/L) | 293 (154–564) | 101 | 1353 (566–2840) | 94 | 245 (157–804) | 16 | <0.001 |
| Peak CK(M)B+BB (U/L) | 20 (14–39) | 101 | 76 (31–176) | 93 | 18 (13–26) | 15 | <0.001 |
| Peak CKMB (µg/L) | 19 (8–53) | 297 | 152 (29–435) | 226 | 14 (6–58) | 30 | <0.001 |
| Peak troponin-T (µg/L) | 0.5 (0.2–1.4) | 299 | 3.1 (1.0–6.8) | 226 | 0.5 (0.2–1.4) | 31 | <0.001 |
| Peak creatinine (µmol/L) | 103 (83–141) | 350 | 92 (82–111) | 252 | 133 (97–182) | 41 | <0.001 |
| CAG-data availablea | 55% (198) | 354 | 50% (130) | 258 | 31% (13) | 42 | 0.008 |
| Number of diseased vessels | 2 (1–3) | 198 | 2 (1–3) | 130 | 3 (1–3) | 13 | 0.85 |
| RCA stenosis | 60% (119) | 197 | 61% (79) | 130 | 62% (8) | 13 | 1.00 |
| CX stenosis | 66% (129) | 197 | 55% (72) | 130 | 62% (8) | 13 | 0.17 |
| LAD stenosis | 65% (129) | 197 | 73% (95) | 130 | 77% (10) | 13 | 0.31 |
| Main stem stenosis | 13% (25) | 196 | 11% (14) | 130 | 15% (2) | 13 | 0.72 |
Categorical data are presented as % (n) and continuous data as median values (inter-quartile range).
aAt time of follow-up. CAG: coronary angiography. CABG: coronary artery by pass grafting. CK: creatinine kinase. CK(M)B+BB: creatinine kinase myocardial band+brain band. CKMB: creatinine kinase myocardial band. CX: circumflex artery. LAD: left anterior descending artery. n: number of valid cases. On-scene delay: time from ambulance arrival at the scene of event to ambulance departure. PCI: percutanous coronary intervention. Pre-hospital delay: time from onset of symptoms to arrival at hospital. RCA: right coronary artery. Transport delay: time from ambulance call to arrival at hospital.
Medication on admission and at discharge according to different categories of acute myocardial infarction
| Non-ST-elevation myocardial infarction | ST-elevation myocardial infarction | Bundle branch block myocardial infarction | P | |
|---|---|---|---|---|
| Medication on admission | n=354 | n=257 | n=42 | |
| ACE/AT2 | 22% (77) | 13% (33) | 26% (11) | 0.006 |
| Beta-blocker | 24% (84) | 12% (32) | 29% (12) | 0.001 |
| Aspirin | 50% (176) | 26% (68) | 52% (22) | <0.001 |
| Diuretics | 49% (174) | 22% (56) | 62% (26) | <0.001 |
| Lipid-lowering | 10% (35) | 5% (14) | 7% (3) | 0.14 |
| Medication at discharge | n=307 | n=230 | n=27 | |
| ACE/AT2 | 27% (82) | 35% (80) | 48% (13) | 0.02 |
| Beta-blocker | 69% (211) | 87% (199) | 70% (19) | <0.001 |
| Aspirin | 93% (284) | 97% (223) | 93% (25) | 0.055 |
| Clopidogrel | 17% (53) | 23% (53) | 4% (1) | 0.024 |
| Diuretics | 63% (194) | 41% (95) | 89% (24) | <0.001 |
| Lipid-lowering | 35% (108) | 51% (118) | 30% (8) | <0.001 |
Categorical data presented as % (n).
ACE: angiotensin converting enzyme inhibitor. AT2: angiotensin-II-antagonist. n: number of patients.
Unadjusted mortality according to different categories of acute myocardial infarction
| Number of patients (n) | In-hospital mortality (95% CI) | One-year mortality (95% CI) | |
|---|---|---|---|
| Acute myocardial infarction | 654 | 13.6% (11.0–16.2) | 28.1% (24.9–31.8) |
| Non-ST-elevation myocardial infarction | 354 | 13.3% (9.7–16.8) | 30.5% (26.0–35.6) |
| Admitted ≤12 h after symptom onset | 199 | 9.0% (5.0–13.1) | 23.6% (18.3–30.2) |
| Early interventional strategya | 170 | 1.8% (0–3.8) | 10.0% (6.3–15.6) |
| ST-elevation myocardial infarction | 258 | 10.9% (7.0–14.7) | 20.5% (16.1–26.0) |
| Admitted ≤12 h after symptom onset | 205 | 9.8% (5.7–13.9) | 17.6% (13.0–23.5) |
| Acute reperfusion therapyb | 143 | 4.9% (1.3–8.5) | 10.5% (6.5–16.8) |
| Bundle branch block myocardial infarction | 42 | 33.3% (18.5–48.2) | 54.8% (40.6–70.1) |
| Admitted ≤12 h after symptom onset | 29 | 34.5% (16.1–52.9) | 55.2% (38.4–73.5) |
| Acute reperfusion therapy | 3 | 33.3% (0–100) | 33.3% (5.5–94.6) |
a Coronary angiography performed during index hospitalization or scheduled at discharge.
b Thrombolytic therapy or primary percutaneous coronary intervention.
Prognostic significance of selected variables concerning mortality at follow-up according to univariable Cox regression analyses
| Median (IQR) or % (n) | Valid casesa | P | Hazard ratio=RR (95% CI) | |
|---|---|---|---|---|
| Age (years) | 73 (62–80) | 654 | <0.001 | 1.071 (1.058–1.084) |
| Male sex | 61% (399) | 654 | 0.020 | 0.749 (0.588–0.954) |
| Medical history of | ||||
| Hypertension | 25% (165) | 653 | 0.70 | 1.055 (0.801–1.390) |
| Diabetes | 20% (132) | 654 | 0.004 | 1.516 (1.152–1.994) |
| Heart failure | 9% (61) | 653 | <0.001 | 2.986 (2.180–4.090) |
| Angina pectoris | 45% (296) | 652 | 0.51 | 0.922 (0.724–1.175) |
| Myocardial infarction | 20% (130) | 652 | 0.25 | 1.187 (0.890–1.583) |
| Smoking (within 1 year) | 70% (387) | 551 | 0.029 | 0.719 (0.537–0.961) |
| Pre-hospital data | ||||
| Contact with primary care physician | 71% (465) | 654 | 0.023 | 1.375 (1.038–1.821) |
| Transported by ambulance | 85% (536) | 632 | <0.001 | 1.946 (1.277–2.966) |
| On-scene delay (min) | 12 (8–16) | 365 | 0.71 | 0.994 (0.965–1.025) |
| Transport delay (min) | 35 (25–47) | 494 | 0.20 | 0.999 (0.998–1.000) |
| Pre-hospital delay (h) | 3.8 (1.8–10) | 543 | 0.004 | 1.004 (1.002–1.007) |
| ECG data on admission | ||||
| Non-sinus rhythm | 22% (138) | 631 | <0.001 | 1.975 (1.518–2.569) |
| Heart rate (per min) | 85 (66–107) | 629 | <0.001 | 1.008 (1.004–1.011) |
| Ejection fraction | 50 (35–60) | 498 | <0.001 | 0.960 (0.950–0.971) |
| Hyperlipidaemia | 63% (410) | 648 | <0.001 | 0.425 (0.333–0.542) |
| Laboratory data | ||||
| Peak CK (U) | 520 (191–1500) | 211 | 0.009 | 1.000 (1.000–1.000) |
| Peak CK(M)B+BB (U) | 32 (16–89) | 209 | <0.001 | 0.995 (0.991–0.999) |
| Peak CKMB (µg/L) | 33 (11–154) | 553 | <0.001 | 0.999 (0.998–1.000) |
| Peak troponin-T (µg/L) | 0.97 (0.32–3.3) | 556 | 0.22 | 0.984 (0.958–1.011) |
| Peak creatinine (µmol/L) | 99 (83–130) | 643 | <0.001 | 1.004 (1.003–1.005) |
| Category of AMI (reference: STEMI) | 654 | <0.001 | ||
| Non-STEMI | 354 | 1.953 (1.472–2.590) | ||
| BBBMI | 42 | 4.307 (2.827–6.563) | ||
| Medication on admission | ||||
| ACE/AT2 | 19% (121) | 653 | 0.002 | 1.587 (1.197–2.103) |
| Beta-blocker | 20% (128) | 653 | 0.65 | 1.072 (0.793–1.448) |
| Aspirin | 41% (266) | 653 | <0.001 | 1.549 (1.217–1.971) |
| Diuretics | 39% (256) | 653 | <0.001 | 2.605 (2.040–3.326) |
| Lipid-lowering agents | 8% (52) | 653 | 0.051 | 0.617 (0.367–1.039) |
| Coronary angiography datab | ||||
| Number of diseased vessels | 2 (1–3) | 341 | 0.002 | 1.418 (1.128–1.784) |
| Right coronary artery stenosis | 61% (206) | 340 | 0.072 | 1.516 (0.953–2.411) |
| Circumflex artery stenosis | 61% (209) | 340 | 0.025 | 1.700 (1.051–2.750) |
| Left anterior descending artery stenosis | 69% (234) | 340 | 0.009 | 1.974 (1.143–3.401) |
| Main stem stenosis | 12% (41) | 339 | 0.80 | 1.086 (0.576–2.050) |
aWithout missing values.
bInformation available at time of follow-up.
ACE: angiotensin converting enzyme inhibitor. AMI: acute myocardial infarction. AT2: angiotensin-II-antagonist. BBBMI: bundle branch block myocardial infarction. CK: creatinine kinase. CKMB: creatinine kinase myocardial band. CK(M)B+BB: creatinine kinase myocardial band+brain band. IQR: inter-quartile range. Non-STEMI: non-ST-elevation myocardial infarction. On-scene delay: time from ambulance arrival at the scene of event to ambulance departure. Pre-hospital delay: time from onset of symptoms to arrival at hospital. STEMI: ST-elevation myocardial infarction. Transport delay: time from ambulance call to arrival at hospital.
Variables retained in the final multivariable Cox regression models
| P | Hazard ratio=RR (95% CI) | |
|---|---|---|
| Model I, n=421 | ||
| Age (years) | <0.001 | 1.062 (1.042–1.083) |
| Creatinine level (µmol/L) | <0.001 | 1.003 (1.002–1.004) |
| History of heart failure | <0.001 | 2.448 (1.527–3.925) |
| Pre-hospital delay (h) | <0.001 | 1.006 (1.003–1.010) |
| Ejection fraction | 0.003 | 0.978 (0.964–0.992) |
| Category of AMI (reference: STEMI) | 0.044* | |
| Non-STEMI | 1.612 (1.036–2.506) | |
| BBBMI | 2.071 (1.062–4.038) | |
| Model II, n=654 (model based on imputed missing values) | ||
| Age (years) | <0.001 | 1.061 (1.047–1.075) |
| Creatinine level (µmol/L) | <0.001 | 1.002 (1.001–1.003) |
| History of heart failure | 0.001 | 1.801 (1.264–2.567) |
| Ejection fraction | 0.003 | 0.983 (0.972–0.994) |
| Category of AMI (reference: STEMI) | 0.018* | |
| Non-STEMI | 1.337 (0.988–1.810) | |
| BBBMI | 1.858 (1.200–2.880) | |
| Model III, n=654 (model based on imputed missing values) | ||
| Age (years) | <0.001 | 1.061 (1.047–1.075) |
| Creatinine level (µmol/L) | <0.001 | 1.002 (1.001–1.003) |
| History of heart failure | 0.002 | 1.775 (1.241–2.549) |
| Ejection fraction | 0.003 | 0.983 (0.972–0.994) |
| Category of AMI (reference: STEMI) | 0.038* | |
| Non-STEMI without pre-existing BBB | 1.321 (0.973–1.792) | |
| Non-STEMI with pre-existing BBB | 1.534 (0.917–2.564) | |
| BBBMI | 1.866 (1.204–2.892) | |
*Likelihood ratio test comparing the full model with a sub-model not including the categories of AMI.
BBB: bundle branch block. BBBMI: bundle branch block myocardial infarction. Non-STEMI: non-ST-elevation myocardial infarction. Non-STEMI with pre-existing BBB: non-STEMI with BBB in previous ECG. Non-STEMI without pre-existing BBB: non-STEMI without BBB in previous ECG. Pre-hospital delay: time from onset of symptoms to admission. STEMI: ST-elevation myocardial infarction.
References
Van de Werf F, Ardissino D, Betriu A, Cokkinos DV, Falk E, Fox KA, Julian D, Lengyel M, Neumann FJ, Ruzyllo W, Thygesen C, Underwood SR, Vahanian A, Verheugt FW, Wijns W. Management of acute myocardial infarction in patients presenting with ST-segment elevation.
Braunwald E, Antman EM, Beasley JW, Califf RM, Cheitlin MD, Hochman JS, Jones RH, Kereiakes D, Kupersmith J, Levin TN, Pepine CJ, Schaeffer JW, Smith EE 3rd, Steward DE, Theroux P, Gibbons RJ, Alpert JS, Faxon DP, Fuster V, Gregoratos G, Hiratzka LF, Jacobs AK, Smith SC Jr. ACC/AHA guideline update for the management of patients with unstable angina and non-ST-segment elevation myocardial infarction—2002: summary article: a report of the American College of Cardiology/American Heart Association Task Force on Practice Guidelines (Committee on the Management of Patients with Unstable Angina).
Braunwald E. Application of current guidelines to the management of unstable angina and non-ST-elevation myocardial infarction.
Boersma E, Maas AC, Deckers JW, Simoons ML. Early thrombolytic treatment in acute myocardial infarction: reappraisal of the golden hour.
Fibrinolytic Therapy Trialists' (FTT) Collaborative Group. Indications for fibrinolytic therapy in suspected acute myocardial infarction: collaborative overview of early mortality and morbidity results from all randomised trials of more than 1000 patients.
Keeley EC, Boura JA, Grines CL. Primary angioplasty versus intravenous thrombolytic therapy for acute myocardial infarction: a quantitative review of 23 randomised trials.
Eagle KA, Goodman SG, Avezum A, Budaj A, Sullivan CM, Lopez-Sendon J. Practice variation and missed opportunities for reperfusion in ST-segment-elevation myocardial infarction: findings from the Global Registry of Acute Coronary Events (GRACE).
Hasdai D, Behar S, Wallentin L, Danchin N, Gitt AK, Boersma E, Fioretti PM, Simoons ML, Battler A. A prospective survey of the characteristics, treatments and outcomes of patients with acute coronary syndromes in Europe and the Mediterranean basin. The Euro Heart Survey of Acute Coronary Syndromes (Euro Heart Survey ACS).
Rogers WJ, Canto JG, Lambrew CT, Tiefenbrunn AJ, Kinkaid B, Shoultz DA, Frederick PD, Every N. Temporal trends in the treatment of over 1.5 million patients with myocardial infarction in the US from 1990 through 1999: the National Registry of Myocardial Infarction 1, 2 and 3.
The Joint European Society of Cardiology/American College of Cardiology Committee. Myocardial infarction redefined—a consensus document of The Joint European Society of Cardiology/American College of Cardiology Committee for the Redifinition of Myocardial Infarction.
Grambsch PM, Therneau TM. Proportional hazards tests and diagnostics based on weighted residuals.
Schemper M, Smith TL. Efficient evaluation of treatment effects in the presence of missing covariate values.
Simon R, Altman DG. Statistical aspects of prognostic factor studies in oncology.
Goldberg RJ, Currie K, White K, Brieger D, Steg PG, Goodman SG, Dabbous O, Fox KA, Gore JM. Six-month outcomes in a multinational registry of patients hospitalized with an acute coronary syndrome (The Global Registry of Acute Coronary Events [GRACE]).
Goldberg RJ, Steg PG, Sadiq I, Granger CB, Jackson EA, Budaj A, Brieger D, Avezum A, Goodman S. Extent of, and factors associated with, delay to hospital presentation in patients with acute coronary disease (the GRACE registry).
Granger CB, Goldberg RJ, Dabbous O, Pieper KS, Eagle KA, Cannon CP, Van de Werf F, Avezum A, Goodman SG, Flather MD, Fox KAA, for the Global Registry of Acute Registry of Acute Coronary Events Investigators. Predictors of hospital mortality in the global registry of acute coronary events.
Armstrong PW. Coronary reperfusion: numerators searching for denominators.
Steg PG, Goldberg RJ, Gore JM, Fox KA, Eagle KA, Flather MD, Sadiq I, Kasper R, Rushton-Mellor SK, Anderson FA. Baseline characteristics, management practices, and in-hospital outcomes of patients hospitalized with acute coronary syndromes in the Global Registry of Acute Coronary Events (GRACE).
Andersen HR, Nielsen TT, Rasmussen K, Thuesen L, Kelbaek H, Thayssen P, Abildgaard U, Pedersen F, Madsen JK, Grande P, Villadsen AB, Krusell LR, Haghfelt T, Lomholt P, Husted SE, Vigholt E, Kjaergard HK, Mortensen LS. A Comparison of coronary angioplasty with fibrinolytic therapy in acute myocardial infarction.
The GUSTO V Investigators. Reperfusion therapy for acute myocardial infarction with fibrinolytic therapy or combination reduced fibrinolytic therapy and platelet glycoprotein IIb/IIIa inhibition: the GUSTO V randomised trial.
Assessment of the Safety and Efficacy of a New Thrombolytic (ASSENT-2) Investigators. Single-bolus tenecteplase compared with front-loaded alteplase in acute myocardial infarction: the ASSENT-2 double blind randomised trial.
Sinnaeve P, Alexander J, Belmans A, Bogaerts K, Langer A, Diaz R, Ardissino D, Vahanian A, Pehrsson K, Armstrong P, Van de Werf F. One-year follow-up of the ASSENT-2 trial: a double-blind, randomized comparison of single-bolus tenecteplase and front-loaded alteplase in 16,949 patients with ST-elevation acute myocardial infarction.
Lincoff AM, Califf RM, Van de WF, Willerson JT, White HD, Armstrong PW, Guetta V, Gibler WB, Hochman JS, Bode C, Vahanian A, Steg PG, Ardissino D, Savonitto S, Bar F, Sadowski Z, Betriu A, Booth JE, Wolski K, Waller M, Topol EJ. Mortality at 1 year with combination platelet glycoprotein IIb/IIIa inhibition and reduced-dose fibrinolytic therapy vs conventional fibrinolytic therapy for acute myocardial infarction: GUSTO V randomized trial.
Brown N, Melville M, Gray D, Young T, Skene AM, Wilcox RG, Hampton JR. Relevance of clinical trial results in myocardial infarction to medical practice: comparison of four year outcome in participants of a thrombolytic trial, patients receiving routine thrombolysis, and those deemed ineligible for thrombolysis.
Bahit MC, Cannon CP, Antman EM, Murphy SA, Gibson CM, McCabe CH, Braunwald E. Direct comparison of characteristics, treatment, and outcomes of patients enrolled versus patients not enrolled in a clinical trial at centers participating in the TIMI 9 Trial and TIMI 9 Registry.
Wallentin L, Lagerqvist B, Husted S, Kontny F, Stahle E, Swahn E. Outcome at 1 year after an invasive compared with a non-invasive strategy in unstable coronary-artery disease: the FRISC II invasive randomised trial. FRISC II investigators. Fast revascularisation during instability in coronary artery disease.
Pell JP, Simpson E, Rodger JC, Finlayson A, Clark D, Anderson J, Pell AC. Impact of changing diagnostic criteria on incidence, management, and outcome of acute myocardial infarction: retrospective cohort study.
Go AS, Barron HV, Rundle AC, Ornato JP, Avins AL. Bundle-branch block and in-hospital mortality in acute myocardial infarction.
Sgarbossa EB, Pinski SL, Topol EJ, Califf RM, Barbagelata A, Goodman SG, Gates KB, Granger CB, Miller DP, Underwood DA, Wagner GS. Acute myocardial infarction and complete bundle branch block at hospital admission: clinical characteristics and outcome in the thrombolytic era.
Jha P, Deboer D, Sykora K, Naylor CD. Characteristics and mortality outcomes of thrombolysis trial participants and nonparticipants: a population-based comparison.
Holmes DR, Jr, Berger PB, Hochman JS, Granger CB, Thompson TD, Califf RM, Vahanian A, Bates ER, Topol EJ. Cardiogenic shock in patients with acute ischemic syndromes with and without ST-segment elevation.

