


Abstract
Aims We aimed to develop prognostic models for patients with chronic heart failure (CHF).
Methods and results We evaluated data from 7599 patients in the CHARM programme with CHF with and without left ventricular systolic dysfunction. Multi-variable Cox regression models were developed using baseline candidate variables to predict all-cause mortality (n=1831 deaths) and the composite of cardiovascular (CV) death and heart failure (HF) hospitalization (n=2460 patients with events).
Final models included 21 predictor variables for CV death/HF hospitalization and for death. The three most powerful predictors were older age (beginning >60 years), diabetes, and lower left ventricular ejection fraction (EF) (beginning <45%). Other independent predictors that increased risk included higher NYHA class, cardiomegaly, prior HF hospitalization, male sex, lower body mass index, and lower diastolic blood pressure. The model accurately stratified actual 2-year mortality from 2.5 to 44% for the lowest to highest deciles of predicted risk.
Conclusion In a large contemporary CHF population, including patients with preserved and decreased left ventricular systolic function, routine clinical variables can discriminate risk regardless of EF. Diabetes was found to be a surprisingly strong independent predictor. These models can stratify risk and help define how patient characteristics relate to clinical course.
Introduction
Chronic heart failure (CHF) is a major cause of death and disability. Mortality rates approach 20% per year in spite of current medical therapy, and nearly one million patients are hospitalized with CHF per year in the USA alone.1 However, the clinical course of patients with CHF is variable. Understanding what factors relate to subsequent mortality and morbidity may help in identifying which patients are in need of more intense monitoring and therapy. Moreover, insights into which factors relate to poor outcome may help generate hypotheses for additional interventions.
Although a variety of individual factors are known to relate to heart failure (HF) outcome, multiple factors must be taken into account simultaneously in a multi-variable model to refine and quantify their predictive ability. A number of such models have been reported in CHF,2–8 although most of these have included neither a broad spectrum of CHF with respect to left ventricular function nor a substantial proportion of patients taking contemporary evidence-based treatments, including angiotensin-converting enzyme (ACE)-inhibitors, beta-blockers, spironolactone, and angiotensin receptor blockers.
The Candesartan in Heart Failure: Assessment of Reduction in Mortality and morbidity (CHARM) programme enrolled 7601 patients (7599 with data) with a clinical diagnosis of CHF, irrespective of left ventricular ejection fraction (EF). Patients were randomized to the angiotensin receptor blocker candesartan or placebo and were followed for a median of 38 months. We used the large database from CHARM to develop prognostic models, which included patients with the full spectrum of left ventricular systolic function. These models were developed both to gain insight into what factors have an independent influence on outcome and to quantify that influence.
Methods
The CHARM programme has been described previously,9 and the results were reported.10 Patients aged 18 or older who had symptomatic CHF of at least 4 weeks duration were eligible. The major exclusion criteria were serum creatinine ≥265 µmol/L, serum potassium ≥5.5 mmol/L, myocardial infarction or stroke in the prior 4 weeks, or non-cardiac disease judged to limit 2-year survival. The programme consisted of three component trials that shared these inclusion and exclusion criteria, endpoint definitions, and follow-up methods. Patients were enrolled with (i) left ventricular EF>40% (CHARM-Preserved) (ii) ACE-inhibitor intolerance (CHARM-Alternative) and left ventricular EF≤40%, and (iii) ACE-inhibitor (CHARM-Added) and left ventricular EF≤40%. Patients were enrolled following informed consent at 618 sites with ethical board approval in 26 countries between March 1999 and March 2001, and patients were followed until March 2003 for a median follow-up of 38 months (range 2–4 years).
The primary combined endpoint of each constituent trial was time to cardiovascular (CV) death or hospitalization for the management of worsening HF (adjudicated by a clinical events committee), and the primary endpoint of the overall programme was all-cause mortality. At the end of the trial, vital status was known for all but ten patients.
Standard criteria were used for demographic, medical history, and clinical examination variables. Diabetes was defined as a medical history of diabetes, and treatment with insulin, oral hypoglycaemics, or diet alone was collected. Blood pressure was measured after resting for at least 5 min. Cardiomegaly was defined by current or prior chest X-ray having cardiothoracic ratio of ≥0.5. Investigators were asked to indicate whether each patient experienced a list (modified Boston criteria11) of current or prior symptoms of HF. We did not collect blood laboratory parameters in the overall CHARM population.
Statistical methods
From the baseline case record forms used for all patients in CHARM, an extensive list of baseline variables that might be related to patient prognosis was identified (Table 1). Excluded from this list were variables containing information on concomitant or past medical or procedural treatments, as it is impossible to distinguish causality of treatment effects from selection bias. In addition, blood biochemical and haematological variables were not included, because they were only obtained for the subset of patients in North America.
The two outcomes studied here are time to death from any cause and time to CV death or first hospitalization for CHF. For each outcome, Cox proportional hazards models were built using a forward stepwise procedure with P<0.01 set as the inclusion criterion. The two final models presented include the same set of variables, i.e. variables that achieved P<0.01 for at least one of the two outcomes. In recognition that CHARM is a randomized trial, a dummy variable for candesartan vs. placebo was included in all models. There was no stratification by component trial (CHARM-Added, -Alternative, or -Preserved) so that the relation of EF to risk could be correctly modelled.
For binary variables (e.g. gender) and categorical variables (e.g. NYHA class), appropriate dummy variables were used. Quantitative variables (e.g. heart rate) were fitted as a single continuous measurement, unless there was clear evidence of non-linearity, as occurred with age, EF, and body mass index. To account for digit preference in some centres, EF was rounded to the nearest 0 or 5, e.g. EF 33 to 37 all became 35.
Each variable's statistical strength of contribution to prediction of outcome was expressed as the χ2 statistic with one degree of freedom. The larger the χ2, the smaller the P-value for that variable: for variables with a one degree of freedom, χ2 of 6.64, 10.83, 15.1, 28.4, and 37.3 are associated with P-values of 0.01, 0.001, 0.0001, 0.0000001, and 0.000000001, respectively.
Interactions that have been reported to be significant from prior studies were evaluated. These included the interaction of diabetes with aetiology of HF12,13 and the interaction of gender with left ventricular EF.14
Model calibration and ability to separate populations of patients into differing risk groups were evaluated by assessing predicted vs. actual outcomes in deciles. The models' discrimination abilities were assessed by the c-statistic. The internal validity of the final predictive models in Tables 2 and 3 was assessed by the bootstrap re-sampling technique.15 For each of 100 bootstrap samples, the model was re-fitted and tested on the original sample to obtain a bias-corrected estimate of predictive accuracy.
Results
The CHARM programme included 7599 patients. During follow-up, 1831 died and 2460 had a CV death or HF hospitalization.
Table 1 shows the baseline variables that were considered as candidates for inclusion in the prognostic models. Baseline characteristics are shown for patients who died and who survived and also for patients who did and did not suffer CV death or hospitalization for worsening HF (CV death or HF hospitalization).
The final prognostic models for CV death or HF hospitalization and for all-cause mortality are shown in Tables 2 and 3. For each model, the variables are listed in order of their statistical strength of contribution to prediction of outcome, as represented by the χ2 statistic.
Predicting CV death or HF hospitalization
Simultaneously considering all the variables in Table 2, the most powerful predictor of the CV death or HF hospitalization is age, with χ2 of 182. As shown in Figure 1, there appears to be no substantial increasing risk up to age 60. The model estimates a 46% increase in hazard for every 10 years of age >60, with 95% CI 38–54% increase.
Diabetes is also a very powerful predictor of risk, with a total χ2 (for both insulin-treated and other) of 220. For diabetic patients on insulin (9.3% of all patients in CHARM), there is a doubling in risk (hazard ratio, 2.03) compared with non-diabetics, whereas other diabetics (19.1% of CHARM patients) have a 58% increase in hazard.
The next strongest predictor is EF with χ2 of 120. Figure 1 shows that there is a steady monotonic increase in risk for EF values <45%. For every 5% decrease in EF, there is a 13% increase in hazard, 95% CI 11–16% increase. However, for EF values ≥45%, there is no further relationship of increasing EF with change in risk.
A previous hospitalization for HF had occurred in 52.7% of patients and increased the hazard by 73% if within the past 6 months, 22% otherwise. Cardiomegaly (21.9% of patients) increased the hazard ratio by 35%. There was a gradient of risk with increasing NYHA class, with classes III and IV (52.4 and 2.6% of patients, respectively) increasing the hazard by 32 and 54% relative to patients in class II.
There is a strong inverse relationship between diastolic blood pressure and risk, whereby every 10 mmHg decrease in pressure is associated with an 11% increase in hazard. Systolic blood pressure did not have a significant independent association with risk. The risk associated with heart rate was relatively less, with only an 8% increase in hazard for every 10 b.p.m. increase.
There was a 3% increase in risk per 1 kg/m2 decrease in body mass index (BMI) below the median value of 27.5 kg/m.2
In decreasing order of importance, bundle branch block, pulmonary crackles, dependent oedema, atrial fibrillation, rest dyspnoea, mitral regurgitation, and previous myocardial infarction were further independent and highly significant predictors of CV death and HF hospitalization. After allowing for all the aforementioned variables, there was still a gender difference with females having a 17% lower risk of CV death or HF hospitalization relative to males. Randomization to candesartan was associated with an adjusted risk reduction of 18%, 95% CI 11–24%, (P<0.00001), for CV death or HF hospitalization.
Predicting all-cause mortality
Table 3 shows that many of the same baseline variables are also independent predictors of death from any cause. The association with age is even stronger (Figure 1), although EF and diabetes are the next two most important predictors of mortality.
Next in statistical strength of prediction is BMI. There is an inverse association between BMI and mortality, while appeared confined to patients whose BMI is below the median of 27.5 kg/m2. Such low weight patients have a 9.3% increase in mortality hazard for each 1 kg/m2 reduction, P<0.000000001. Thus, compared with BMI of ≥27.5 kg/m2, a BMI of 20 kg/m2 carries a 67% increased risk.
Many of the other predictors of the primary endpoint also predict mortality, although their rankings of relative importance change somewhat. Previous hospitalization for HF within the past 6 months and previous myocardial infarction are associated with a 44 and 23% increase in mortality hazard, respectively. The gender difference is still present for mortality with 23% hazard reduction for females. Two additional predictors are current cigarette smoking (14.7% of patients) with a 34% higher risk of death and pulmonary oedema (2.8% of patients) with a 37% increase in hazard.
There was no evidence of interaction of the impact of diabetes or of gender according to HF aetiology or of gender according to EF either for CV death and HF hospitalization or for all-cause mortality.
Predicting an individual's risk
The models in Tables 2 and 3 can be used to predict any individual's risk of each outcome. For any patient, one forms a risk score that is a linear combination of their variable values multiplied by coefficients. For ease of presentation, that risk score has been multiplied by 10. Examples of how to use the risk score for risk prediction in individual patients are presented in the appendix.
Figure 2(A) shows both the distribution of the risk score for CV death or HF hospitalization and the relationship between risk score and estimated probability of a primary event within 2 years of follow-up. Figure 2(B) shows the corresponding distribution and probability curve for the all-cause mortality risk score.
Figure 3 further illustrates the predictive power of each of the two risk scores, by showing Kaplan–Meier plots for CV death or HF hospitalization and for all-cause mortality for patients classified into 10 equal sized groupings of the risk score.
Figure 4 demonstrates the two models' goodness-of-fit by comparing the observed and expected probabilities of CV death or HF hospitalization, and mortality within 2 years, for patients classified into 10 consecutive equal sized groups. For both outcomes, we see a very strong gradient in risk with patients in the top 10th of the risk score, having over 10 times and over 15 times the risk of patients in the bottom 10th of risk.
The discrimination abilities of the models were moderately strong, with C-indices (areas under the receiver operating characteristics curve) for predicting the 2-year incidence of CV death or HF hospitalization, and death of 0.75 and 0.75, respectively. Results of internal validation revealed no ‘over-optimism’ in the predictive discrimination with C-indices of 0.75 and 0.74, respectively, using the re-fitted model.
Model performance was equally good in the low and the preserved left ventricular EF populations, with C-indices of 0.74 for CV death and HF hospitalization and 0.73 for all-cause death in CHARM-low EF (Alternative and Added) and 0.76 for CV death and HF hospitalization and 0.73 for all-cause death in CHARM-Preserved.
Discussion
This study identifies 21 independent predictors of mortality or morbidity in CHF. Although many of these have been identified previously, the models reported here are the first to be developed in a single cohort spanning the full range of left ventricular systolic function, including a substantial proportion of patients with preserved left ventricular EF. The model performed equally well in patients with low and preserved EFs.
For predicting either the composite (CV death or HF hospitalization) or the all-cause mortality, the variables with the most prognostic information were older age, lower EF, and diabetes.
Older age has consistently been related to worse outcome.2,4,7,16–18 With the large number of deaths in the CHARM data set, we were able to further define the relationship as a non-linear one, where age had relatively little impact on outcome until after age 60, and then the risk of death increases nearly two-fold every 10 years. As the CHARM programme included over 1700 patients age 75 or over, this data set is well suited to define the impact of advancing age. This is particularly important given the ageing of both the overall and the HF populations.
In CHARM, by design, over one-quarter of the population had EF >50%. As expected, EF was a strong predictor of outcome. The relationship of worsening outcome to lower EF was evident when EF was <45%, with around a 15% increase in risk for each 5% drop in EF. However, in patients with HF and preserved systolic function, there was no trend for risk to decrease further when left ventricular EF was ≥45%.
An important finding in CHARM was the very powerful impact of diabetes on risk. Diabetes was associated with around a doubling of risk of either death or the composite outcome when insulin-treated, and a 50% increase in risk in generally less severe, non-insulin-treated diabetes. Although diabetes has been recognized as an important modulator of HF outcome,13,14,19 previous studies have not defined diabetes to be so important in multi-variable modelling. In spite of prior studies suggesting an impact of diabetes on outcome limited to patients with ischaemic aetiology of HF,7,12,13 we found a similar major impact in ischaemic and non-ischaemic aetiologies. Given the epidemic of both CHF and diabetes, this observation has major public health implications and suggests that prevention and modification of diabetes may be especially important in patients with or at risk of CHF of any aetiology.
Low body mass is often associated with a poor prognosis in chronic disease,20 as we found to be the case for risk of death in CHARM. In spite of the risk of obesity for CV disease and the expectation that fluid retention due to worse HF would increase weight, low body mass below a threshold was the dominant factor, perhaps partly related to poor nutrition or general poor state of health that had resulted in weight loss.
Cardiomegaly on chest X-ray was strongly associated with worse outcome. Cardiomegaly has previously been shown to be significantly, albeit weakly, associated with left ventricular EF,21 and in CHARM, these factors provided independent and complementary information. Previous studies have likewise found cardiothoracic ratio of greater than 0.5 to be an independent predictor of mortality.7,18
Blood pressure is known to be an independent predictor of outcome in HF, although systolic blood pressure has generally been the focus.22 We found that lower diastolic blood pressure was the stronger (and only significant) independent prognostic blood pressure measure. This may be a surprising finding to clinicians who tend to focus on systolic blood pressure as the more informative measure.
Female gender was an independent predictor of better outcome, both total mortality and combined CV death and HF hospitalization. This was true regardless of whether systolic dysfunction was present. Unlike one prior report,14 gender had similar prognostic significance regardless of HF aetiology, suggesting that the borderline significant interaction in the BEST trial analysis may have been due to the play of chance. Similar to the DIG trial report of predictors of outcome among patients with preserved systolic function,17 we found that female gender was associated with better outcome.
Prior myocardial infarction, an indicator of ischaemic aetiology of HF, was a statistically significant independent predictor of worse outcome, but it was not one of the more powerful predictors. Although QRS duration was not collected, bundle branch block was an important independent predictor of both outcomes, consistent with other studies finding conduction delay to be associated with higher risk.23
Overall, the models that we have developed add important information to previous predictive models in HF populations. They are based on a large number of patients and events across a broad spectrum of HF, thus allowing a more detailed, precise, and generalizable evaluation of predictors and their independent contributions. Although clinical trial databases have limitations of being selective compared with general practice, they provide the advantage of systematic data collection and complete, high quality follow-up. In the CHARM programme, patients were at high risk, with one in four patients dead with a median follow-up of 38 months. The relatively long follow-up in CHARM makes it more relevant to clinicians interested in how patients will fare over a horizon of years. Moreover, only 0.1% of patients lacked vital status at the final visit.
One limitation is that we do not have systematic measurements of blood laboratory tests, including haemoglobin, creatinine, and b-type natriuretic peptide, known to be important predictors of outcome in CHF.24–26 We have depended on clinical diagnoses, for example, of diabetes, and rigorous testing and definition may have increased the importance of some variables. We do have such blood biochemistry data only in the 2681 North American patients, but we will be reporting on them separately because they comprise a smaller subset. Because the focus of this study was to report on associations in the CHARM database rather than to develop a generalizable clinical prediction tool, our model was not validated in a separate data set, although internal validation was excellent as would be expected given the robust nature of the CHARM database.
In conclusion, the two models presented provide detailed information about factors that relate to mortality and morbidity in CHF and highlight the importance of diabetes. They provide tools to stratify risk and define risk relationships across the full spectrum of left ventricular systolic function and advancing age.
Acknowledgement
The CHARM programme was supported by AstraZeneca R&D, Molndal, Sweden.
Conflict of interest: S.J.P, M.A.P, S.Y, J.J.V.M., K.B.S., J.O. and C.B.G. have received research grants, received honoraria and served as consultants to several pharmaceutical companies, including AstraZeneca. E.L.M is an employee of AstraZeneca.
Appendix
Examples of risk prediction using the models presented in Tables 2 and 3
It is useful to illustrate the use of Tables 2 and 3 and Figure 2 for predicting risk of specific patients, as follows:
For instance, consider a male patient aged 60 (or less) with EF of 45 (or more) who has diastolic blood pressure of 76 mmHg, heart rate of 73 b.p.m., BMI of 22.5 kg/m2, and NYHA class II, and has none of the other risk factors in our predictive model in Table 2.
Then, using the coefficients in Table 2 each multiplied by 10, this patient's risk score for the primary endpoint is 3.79×6−1.23×9−1.07×7.6+0.78×7.3−0.26×22.5=3.38.
Note age is in decades, hence 60 becomes 6, EF is in steps of 5, EF≥45 becomes 9.
From Figure 2(A), we see that this is a low risk patient who has a 5.3% chance of CV death or HF hospitalization within 2 years.
Consider another male patient with the same blood pressure, heart rate, and body mass, who is aged 75 has EF of 30% and is an insulin-treated diabetic with NYHA class III. This increases their risk score by a further 3.79×1.5+1.23×3+7.07+2.78=19.22 to a total score of 22.61.
Note the patient is 1.5 decades older, and EF is 15/5=3 steps less.
Figure 2(A) indicates that this patient is at much higher risk with a 31% chance of CV death or HF hospitalization within 2 years.
If this patient also had cardiomegaly and a previous hospitalization for HF within 6 months, his risk score increases by a further 2.97+5.47 to 31.05.
He would then be among the highest risk patients in the CHARM database with a 58% chance of CV death or HF hospitalization within 2 years.
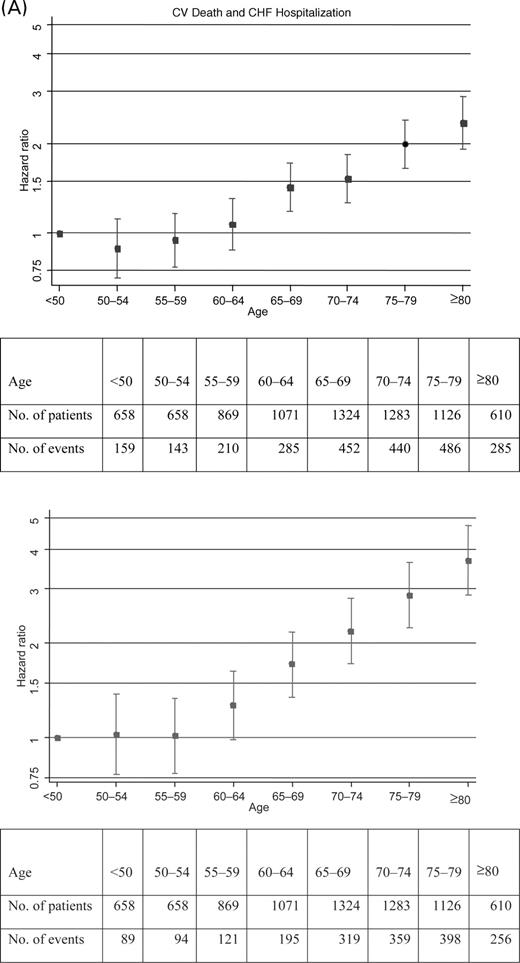
Figure 1 Relationships of age and ejection fraction to risk of (A) CV death or HF hospitalization and (B) all-cause death. Hazard ratios are shown with 95% CIs.
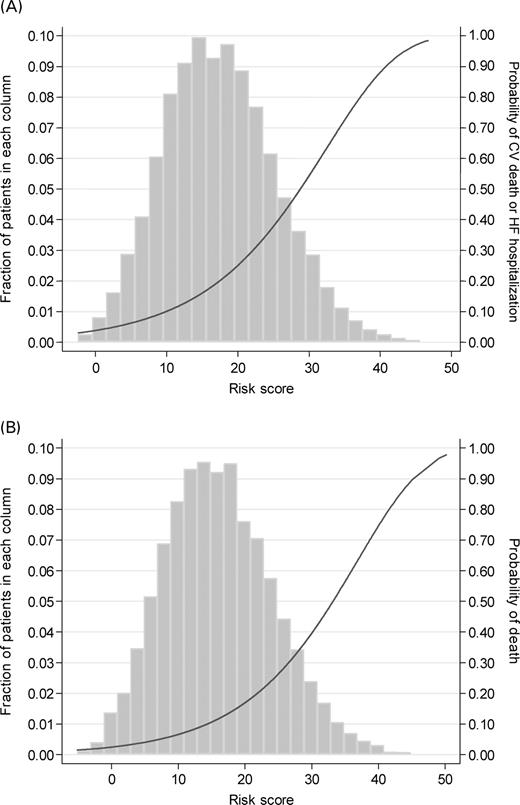
Figure 2 Distributions of risk scores for (A) CV death and HF hospitalization and (B) all-cause death, and their relation to probabilities of occurrence within 2 years.
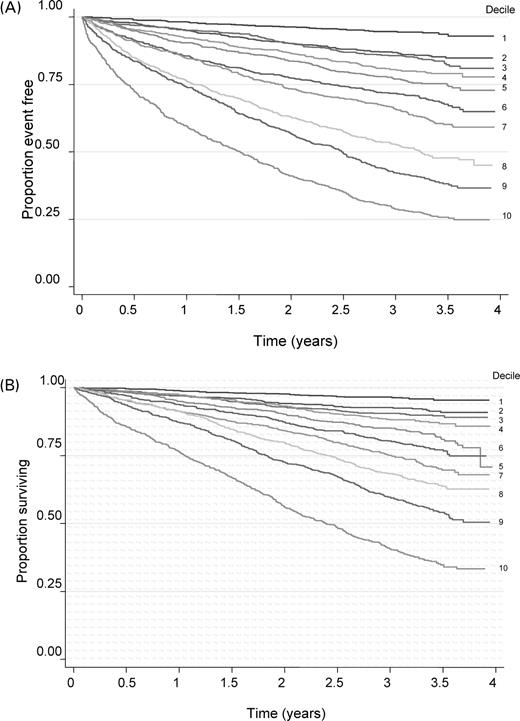
Figure 3 Kaplan–Meier plots for (A) CV death and HF hospitalization and (B) all-cause death by deciles of their risk scores.
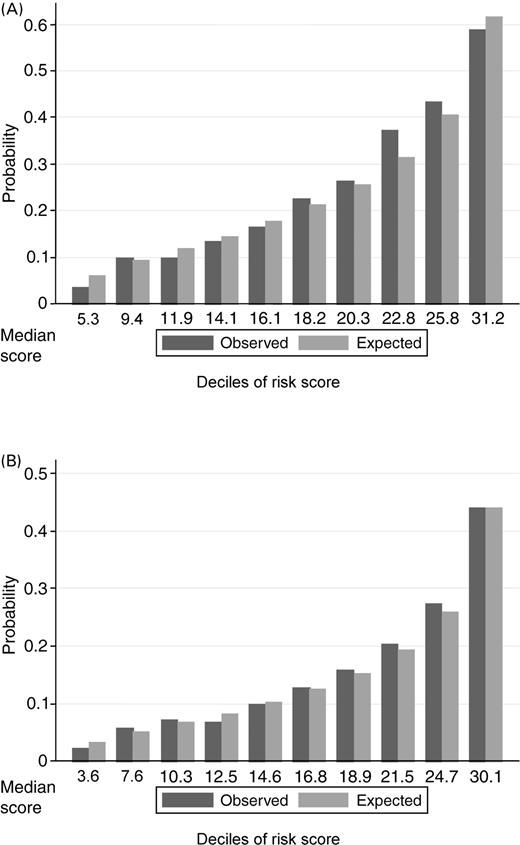
Figure 4 Comparisons of observed and expected rates after 2 years of (A) CV death or HF hospitalization and (B) all-cause death, for patients categorized by tenths of their risk scores. Observed, as read off each 10th Kaplan–Meier plot at 2 years; expected, as estimated from Cox model in each 10th.
Descriptive statistics for baseline variables considered for inclusion in prognostic models for 7599 subjects
| Variable | CV death/HF hospitalization | All-cause death | ||||||
|---|---|---|---|---|---|---|---|---|
| Without event (n=5139) | With event (n=2460) | Alive (n=5768) | Dead (n=1831) | |||||
| Mean or % | SD | Mean or % | SD | Mean or % | SD | Mean or % | SD | |
| Demographic and clinical characteristics | ||||||||
| Age (year) | 64.3 | 10.9 | 67.9 | 10.9 | 64.2 | 11.0 | 69.5 | 10.4 |
| Ejection fraction (%) | 40.8 | 14.6 | 34.9 | 14.7 | 40.3 | 14.7 | 34.3 | 14.6 |
| Heart rate (b.p.m) | 72.1 | 13.0 | 74.6 | 13.0 | 72.4 | 13.1 | 74.3 | 12.7 |
| Systolic blood pressure (mmHg) | 132.0 | 18.9 | 128.5 | 19.6 | 131.7 | 19.0 | 128.2 | 19.6 |
| Diastolic blood pressure (mmHg) | 77.6 | 10.5 | 74.6 | 11.0 | 77.4 | 10.6 | 74.2 | 10.9 |
| Weight (kg) | 82.3 | 18.0 | 79.9 | 18.5 | 82.8 | 18.3 | 77.8 | 17.5 |
| Height (cm) | 169.8 | 9.7 | 169.2 | 9.9 | 169.8 | 9.6 | 169.2 | 10.1 |
| BMI (kg/m2) | 28.5 | 5.4 | 27.8 | 5.5 | 28.6 | 5.4 | 27.1 | 5.3 |
| Time since CHF diagnosis (months) | 40.1 | 50.5 | 51.7 | 55.7 | 41.1 | 50.6 | 52.6 | 57.3 |
| Female (%) | 32.5 | 29.7 | 32.7 | 28.1 | ||||
| Non-smoker (%) | 37.5 | 34.7 | 37.3 | 34.4 | ||||
| Previous smoker (%) | 47.6 | 51.2 | 48.4 | 49.9 | ||||
| Current smoker (%) | 14.9 | 14.1 | 14.3 | 15.7 | ||||
| NYHA class II (%) | 51.4 | 31.5 | 49.5 | 30.7 | ||||
| NYHA class III (%) | 47.3 | 63.3 | 48.9 | 63.6 | ||||
| NYHA class IV (%) | 1.3 | 5.3 | 1.6 | 5.7 | ||||
| Dependent oedema (%) | 21.4 | 30.6 | 22.6 | 30.1 | ||||
| Medical history | ||||||||
| Any previous HF hospitalization (%) | 67.2 | 80.2 | 69.0 | 79.0 | ||||
| Prior HF hospitalization within 6 months (%) | 33.0 | 44.6 | 34.5 | 43.9 | ||||
| Previous myocardial infarction (%) | 51.1 | 56.1 | 50.7 | 59.0 | ||||
| Angina pectoris (%) | 57.1 | 57.6 | 57.3 | 57.2 | ||||
| Stroke (%) | 7.7 | 10.8 | 7.9 | 11.3 | ||||
| Atrial fibrillation (%) | 24.4 | 33.6 | 25.4 | 33.9 | ||||
| Cancer (%) | 6.5 | 7.3 | 6.3 | 8.3 | ||||
| Pharmacologically treated hypertension (%) | 48.4 | 48.3 | 49.3 | 45.4 | ||||
| Diabetes mellitus (any) (%) | 23.3 | 39.2 | 25.7 | 37.2 | ||||
| Diabetes: insulin-treated (%) | 6.6 | 14.9 | 8.0 | 13.4 | ||||
| Aetiology of heart failure | ||||||||
| Ischaemic heart disease (%) | 68.7 | 72.1 | 68.2 | 75.0 | ||||
| Idiopathic-dilated cardiomyopathy (%) | 20.1 | 18.5 | 20.6 | 16.2 | ||||
| Hypertension (%) | 50.1 | 51.8 | 51.4 | 48.6 | ||||
| Mitral regurgitation (%) | 15.5 | 22.2 | 16.1 | 22.6 | ||||
| Mitral stenosis (%) | 1.0 | 1.3 | 1.0 | 1.3 | ||||
| Aortic regurgitation (%) | 3.1 | 5.0 | 3.3 | 5.0 | ||||
| Diabetes mellitus (%) | 18.2 | 31.2 | 20.1 | 29.4 | ||||
| Alcohol-related (%) | 5.0 | 5.0 | 4.9 | 5.4 | ||||
| Atrial fibrillation (%) | 19.6 | 25.2 | 20.1 | 25.6 | ||||
| Clinical evidence of heart failure | ||||||||
| Dyspnoea when walking (%) | 60.1 | 72.0 | 61.4 | 72.1 | ||||
| Any dyspnoea (%) | 96.4 | 96.6 | 96.6 | 96.2 | ||||
| Rest dyspnoea (%) | 25.1 | 36.7 | 26.7 | 35.9 | ||||
| Venous congestion (%) | 30.5 | 42.3 | 32.0 | 41.8 | ||||
| S3 gallop (%) | 10.3 | 16.4 | 11.3 | 15.5 | ||||
| Pulmonary oedema (%) | 1.9 | 4.7 | 2.0 | 5.1 | ||||
| Bilateral pleural effusions (%) | 0.7 | 2.2 | 0.8 | 2.5 | ||||
| Cardiomegaly (%) | 17.9 | 30.4 | 19.2 | 30.7 | ||||
| Pulmonary crackles (%) | 13.0 | 22.9 | 14.1 | 23.0 | ||||
| Pulmonary wheezes (%) | 2.3 | 4.6 | 2.6 | 4.5 | ||||
| ECG | ||||||||
| Atrial fibrillation/flutter (%) | 13.4 | 18.7 | 13.6 | 19.9 | ||||
| Bundle branch block (%) | 20.2 | 31.3 | 21.2 | 32.1 | ||||
| Paced rhythm (%) | 4.8 | 9.3 | 5.5 | 8.8 | ||||
| Pathological Q-wave (%) | 26.1 | 23.6 | 25.3 | 25.3 | ||||
| Left ventricular hypertrophy (%) | 15.1 | 17.0 | 15.3 | 16.8 | ||||
NYHA, New York Heart Association; SD, standard deviation.
Final prognostic model for CV death or HF hospitalization based on forward stepwise Cox proportional hazard regression
| Standard variable | Hazard ratio | Lower 95% CI | Upper 95% CI | χ2-value | Coefficient | Standard error |
|---|---|---|---|---|---|---|
| Age (per 10 years over age 60) | 1.46 | 1.38 | 1.54 | 181.8 | 0.379 | 0.028 |
| Diabetes: insulin-treated | 2.03 | 1.80 | 2.29 | 134.7 | 0.707 | 0.061 |
| Diabetes: other | 1.58 | 1.43 | 1.74 | 85.2 | 0.455 | 0.049 |
| Ejection fraction (per 5% decrease below 45) | 1.13 | 1.11 | 1.16 | 119.9 | −0.123 | 0.011 |
| Prior HF hospitalization within 6 months | 1.73 | 1.55 | 1.93 | 94.9 | 0.547 | 0.056 |
| Prior HF hospitalization but not within 6 months | 1.22 | 1.09 | 1.37 | 11.9 | 0.200 | 0.058 |
| Cardiomegaly | 1.35 | 1.23 | 1.47 | 42.0 | 0.297 | 0.046 |
| Diagnosis of CHF over 2 years ago | 1.31 | 1.20 | 1.43 | 36.2 | 0.268 | 0.045 |
| NYHA class III | 1.32 | 1.20 | 1.45 | 33.7 | 0.278 | 0.048 |
| NYHA class IV | 1.54 | 1.25 | 1.89 | 16.8 | 0.430 | 0.105 |
| DBP (per 10 mmHg decrease) | 1.11 | 1.07 | 1.16 | 28.9 | −0.107 | 0.020 |
| Bundle branch block | 1.26 | 1.15 | 1.38 | 26.3 | 0.231 | 0.045 |
| Heart rate (per 10 b.p.m.) | 1.08 | 1.05 | 1.11 | 25.7 | 0.078 | 0.015 |
| Candesartan (vs. placebo) | 0.82 | 0.76 | 0.89 | 23.7 | −0.197 | 0.041 |
| Dependent oedema | 1.23 | 1.12 | 1.35 | 20.2 | 0.208 | 0.046 |
| Pulmonary crackles | 1.25 | 1.13 | 1.38 | 18.0 | 0.221 | 0.052 |
| Rest dyspnoea | 1.20 | 1.10 | 1.31 | 16.0 | 0.182 | 0.045 |
| Female | 0.83 | 0.76 | 0.91 | 15.5 | −0.183 | 0.047 |
| Atrial fibrillation | 1.16 | 1.07 | 1.27 | 11.3 | 0.151 | 0.045 |
| BMI (per 1 kg/m2 decrease below 27.5) | 1.03 | 1.01 | 1.04 | 9.2 | −0.026 | 0.009 |
| Mitral regurgitation | 1.16 | 1.05 | 1.28 | 9.1 | 0.150 | 0.050 |
| Previous myocardial infarction | 1.11 | 1.02 | 1.21 | 6.3 | 0.108 | 0.043 |
| Pulmonary oedema | 1.26 | 1.03 | 1.54 | 5.1 | 0.231 | 0.102 |
| Current smoker | 1.09 | 0.97 | 1.22 | 1.9 | 0.083 | 0.060 |
See the appendix for explanation of how to use coefficients in this table to predict an individual patient's risk. DBP, diastolic blood pressure; BMI, body mass index.
Final prognostic models for all-cause mortality based on forward stepwise Cox proportional hazard regression
| Variable | Hazard ratio | Lower 95% CI | Upper 95% CI | χ2-value | Coefficient | Standard error |
|---|---|---|---|---|---|---|
| Age (per 10 years over age 60) | 1.73 | 1.62 | 1.84 | 284.6 | 0.547 | 0.032 |
| Ejection fraction (per 5% decrease below 45) | 1.14 | 1.12 | 1.17 | 107.6 | −0.134 | 0.013 |
| Diabetes: insulin-treated | 1.80 | 1.56 | 2.08 | 64.4 | 0.589 | 0.073 |
| Diabetes: other | 1.50 | 1.34 | 1.68 | 49.1 | 0.403 | 0.058 |
| BMI (per 1 kg/m2 decrease below 27.5) | 1.07 | 1.05 | 1.09 | 52.2 | −0.068 | 0.009 |
| Female | 0.77 | 0.69 | 0.86 | 22.3 | −0.260 | 0.055 |
| NYHA class III | 1.30 | 1.16 | 1.45 | 21.8 | 0.260 | 0.056 |
| NYHA class IV | 1.68 | 1.33 | 2.11 | 19.0 | 0.517 | 0.118 |
| Current smoker | 1.34 | 1.18 | 1.53 | 19.0 | 0.293 | 0.067 |
| Bundle branch block | 1.25 | 1.13 | 1.39 | 18.8 | 0.226 | 0.052 |
| Cardiomegaly | 1.26 | 1.13 | 1.40 | 18.8 | 0.231 | 0.053 |
| Prior HF hospitalization within 6 months | 1.44 | 1.27 | 1.64 | 32.9 | 0.367 | 0.064 |
| Prior HF hospitalization but not within 6 months | 1.10 | 0.97 | 1.26 | 2.2 | 0.099 | 0.066 |
| DBP (per 10 mmHg decrease) | 1.10 | 1.05 | 1.15 | 17.1 | −0.095 | 0.023 |
| Diagnosis of CHF over 2 years ago | 1.24 | 1.12 | 1.37 | 17.0 | 0.212 | 0.051 |
| Previous myocardial infarction | 1.23 | 1.11 | 1.35 | 16.8 | 0.205 | 0.050 |
| Dependent oedema | 1.22 | 1.10 | 1.36 | 13.5 | 0.199 | 0.054 |
| Heart rate (per 10 b.p.m.) | 1.07 | 1.03 | 1.10 | 12.7 | 0.064 | 0.018 |
| Pulmonary crackles | 1.18 | 1.05 | 1.33 | 8.0 | 0.169 | 0.060 |
| Pulmonary oedema | 1.37 | 1.10 | 1.71 | 7.8 | 0.313 | 0.112 |
| Mitral regurgitation | 1.15 | 1.02 | 1.28 | 5.7 | 0.137 | 0.057 |
| Atrial fibrillation | 1.11 | 1.00 | 1.23 | 3.9 | 0.103 | 0.052 |
| Rest dyspnoea | 1.11 | 1.00 | 1.23 | 3.8 | 0.104 | 0.053 |
| Candesartan (vs. placebo) | 0.91 | 0.83 | 1.00 | 3.8 | -0.091 | 0.047 |
See the appendix for explanation of how to use coefficients in this table to predict an individual patient's risk. NYHA New York Heart Association; DBP diastolic blood pressure; BMI, body mass index.
References
American Heart Association.
Gradman A, Deedwania P, Cody R, Massie B, Packer M, Pitt B, Goldstein S. Predictors of total mortality and sudden death in mild to moderate heart failure.
Aaronson KD, Schwartz JS, Chen TM, Wong KL, Goin JE, Mancini DM. Development and prospective validation of a clinical index to predict survival in ambulatory patients referred for cardiac transplant evaluation.
Kearney MT, Nolan J, Lee AJ, Brooksby PW, Prescott R, Shah AM, Zaman AG, Eckberg DL, Lindsay HS, Batin PD, Andrews R, Fox KA. A prognostic index to predict long-term mortality in patients with mild to moderate chronic heart failure stabilised on angiotensin converting enzyme inhibitors.
Varadarajan P, Pai RG. Prognosis of congestive heart failure in patients with normal versus reduced ejection fractions: results from a cohort of 2,258 hospitalized patients.
Bouvy ML, Heerdink ER, Leufkens HG, Hoes AW. Predicting mortality in patients with heart failure: a pragmatic approach.
Brophy JM, Dagenais GR, McSherry F, Williford W, Yusuf S. A multivariate model for predicting mortality in patients with heart failure and systolic dysfunction.
O'Connor CM, Gattis WA, Shaw L, Cuffe MS, Califf RM. Clinical characteristics and long-term outcomes of patients with heart failure and preserved systolic function.
Swedberg K, Pfeffer M, Granger C, Held P, McMurray J, Ohlin G, Olofsson B, Östergren J, Yusuf S. Candesartan in heart failure--assessment of reduction in mortality and morbidity (CHARM): rationale and design. Charm-Programme Investigators.
Pfeffer MA, Swedberg K, Granger CB, Held P, McMurray JJV, Michelson EL, Olofsson B, Östergren J, Yusuf S, for the CHARM Investigators and Committees. Effects of candesartan on mortality and morbidity in patients with chronic heart failure: the CHARM-Overall Programme.
Mosterd A, Deckers JW, Hoes AW. Classification of heart failure in population based research: an assessment of six heart failure scores
Dries D, Sweitzer N, Drazner M, Stevenson LW, Gersh BJ. Prognostic impact of diabetes mellitus in patients with heart failure according to the etiology of left ventricular dysfunction.
Domanski M, Krause-Steinrauf H, Deedwania P, Follmann D, Ghali JK, Gilbert E, Haffner S, Katz R, Lindenfeld J, Lowes BD, Martin W, McGrew F, Bristow MR; BEST Investigators. The effect of diabetes on outcomes of patients with advanced heart failure in the BEST trial.
Ghali JK, Krause-Steinrauf HJ, Adams KF, Khan SS, Rosenberg YD, Yancy CW, Young JB, Goldman S, Peberdy MA, Lindenfeld J. Gender differences in advanced heart failure: insights from the BEST study.
Harrell FE Jr, Lee KL, Califf RM, Pryor DB, Rosati RA. Regression modelling strategies for improved prognostic prediction.
Rich MW, McSherry F, Williford WO, Yusuf S. Effect of age on mortality, hospitalizations and response to digoxin in patients with heart failure: the DIG study.
Jones RC, Francis GS, Lauer MS. Predictors of mortality in patients with heart failure and preserved systolic function in the Digitalis Investigation Group trial.
Das SR, Drazner MH, Yancy CW, Stevenson LW, Gersh BJ, Dries DL. Effects of diabetes mellitus and ischemic heart disease on the progression from asymptomatic left ventricular dysfunction to symptomatic heart failure: a retrospective analysis from the Studies of Left Ventricular Dysfunction (SOLVD) Prevention trial.
Landi F, Onder G, Gambassi G, Pedone C, Carbonin P, Bernabei R. Body mass index and mortality among hospitalised patients.
Philbin EF, Garg R, Danisa K, Denny M, Gosselin G, Hassapoyannes C, Horney A, Johnstone DE, Lang RM, Ramanathan K, Safford RE, Sarma RJ, Weiss R, Williford WO, Fleg JL. The relationship between cardiothoracic ratio and left ventricular ejection fraction in congestive heart failure. Digitalis Investigation Group.
Lee DS, Austin PC, Rouleau JL, Liu PP, Naimark D, Tu JV. Predicting mortality among patients hospitalised for heart failure. Derivation and validation of a clinical model.
Iuliano S, Fisher SG, Karasik PE, Fletcher RD, Singh SN. Department of Veterans Affairs Survival Trial of Antiarrhythmic Therapy in Congestive Heart Failure. QRS duration and mortality in patients with congestive heart failure.
Ezekowitz JA, McAlister FA, Armstrong PW. Anemia is common in heart failure and is associated with poor outcomes: insights from a cohort of 12 065 patients with new-onset heart failure.
Al Ahmad A, Rand WM, Manjunath G, Konstam MA, Salem DN, Levey AS, Sarnak MJ. Reduced kidney function and anemia as risk factors for mortality in patients with left ventricular dysfunction.

