


Abstract
Aims To determine whether sex differences of in-hospital and after-discharge mortality differ according to the age.
Methods and results Data of 4347 consecutive patients hospitalized within 48 h of the onset of acute myocardial infarction (AMI) were analysed. Patients were classified according to median age (68 years): Group 1 (G1) (308 women, 30–67 years), G2 (1878 men, 30–67 years), G3 (860 women, 68–89 years), and G4 (1301 men, 68–89 years). In both age groups, women were older, had more frequent co-morbidities, lower rate of reperfusion therapy, and received less anti-platelet agents, β-blockers, and statins than men. The overall 1-year mortality was higher in women (25% vs. 16% in men, P<0.0001). After adjustment, in-hospital mortality was higher only for the women in the younger age group. (G1 vs. G2: OR=2.2, 95%CI=1.3–3.8; G3 vs. G4: OR=1.1, 95%CI=the risk of death, after hospital discharge, was no longer related to gender in any age group.
Conclusion The higher 1-year mortality following AMI in women is explained by the higher risk of death in young women during the first days of hospitalization. Further investigations are crucial to determine the cause in order to improve the chance of survival in younger women.
Introduction
Cardiovascular disease (CVD) remains the leading cause of death in men and women despite research-based advances in its management and treatment. Mortality from CVD has been steadily decreasing for men, but the same is not true for women.1,2 As coronary heart disease accounts for the majority of CVD deaths in women, it represents the prime target for prevention.3
Several studies have found that women hospitalized with an acute myocardial infarction (AMI) had higher unadjusted short-term mortality rates than men.4–11 Older age, more frequent comorbidities, and less aggressive management are hypothesized as the major reasons contributing to the poorer prognosis in women. Controlling for these factors eliminates the association between female gender and increased mortality in most,4–7 though not all,8–11 studies.
Among studies investigating an association between sex and age and early mortality after AMI, results differed with either no association;10,12 a worse prognosis only for older women,13 or surprisingly only in younger women.7,14 There are important differences in event rates and management between populations, and this is also true within the European countries.15,16 The USIC (Unité de Soins Intensifs Coronaires) I-II registry database, a nation-wide registry of AMI, was an opportunity to assess in France the early and 1-year mortality of unselected men and women after AMI, where event rates are among the lowest in western countries. The current study aimed at analyzing whether the risk of death after AMI during hospitalization and after hospital discharge was related to the sex and, if so, to determine gender differences according to the age after taking into account comorbidities, severity of AMI, and treatment strategies.
Methods
Patients
Details of the study design and results of USIC I-II registry database have been reported previously.17,18 Briefly, 4472 consecutive patients hospitalized within 48 h of the onset of AMI in intensive care units during a 1-month period (November) were included in the registry and had a 1-year follow-up. Informed consent was obtained from all participants. Patients ≥90 years (n=102) and those <30 years of age (n=18) were excluded from the present study, as AMI is rare in this age group, particularly among women. Also excluded were five patients as data were missing regarding their age or gender. A total of 4347 patients (USIC 1995, n=2086, USIC 2000, n=2261) were therefore included for the present analysis. The participating intensive care units represented more than 80% of the units accustomed to treating patients for AMI in France.
Data collection
One investigator in each center collected on pre-specified forms the demographic, historical, and medical data, including management, procedures, and treatments following hospital admission. All included patients have given informed consent for participation in the registries. Oral consent was obtained in the 1995 survey, as written consent was not requested for a survey in France at that time. Written consent was obtained in the USIC 2000 survey. The time from onset of symptom to hospital-admission was recorded as within 3 h, between 3–6 h, 6–12 h, 12–24 h, and later than 24 h.
The diagnosis of AMI was based on clinical, ECG, and enzymatic findings. Previous history of CVD and risk factors; the clinical course following admission, including maximal Killip class; as well as the initial diagnostic and therapeutic management were recorded for each patient. Early reperfusion therapy was defined as the use of intravenous thrombolysis and percutaneous transluminal coronary angioplasty (PTCA) during the first 24 h following admission. The presence of atrial or ventricular fibrillation (AF, VF), and type II and III atrioventricular (AV) block during hospitalization were also assessed for each patient. When available, the value of left ventricular ejection fraction (LVEF) measured during the first 5 days following admission was recorded. Follow-up data were obtained by telephone or direct interviews of the patients and their referring physicians during the year following the index hospitalization.
Statistical analysis
The data were analysed by classifying the patients enrolled into four groups according to median age (67.8 years) and sex: Group 1 (n=308 women, 30–67 years), Group 2 (n=1878 men, 30–67 years), Group 3 (n=860 women, 68–89 years) and Group 4 (n=1301 men, 68–89 years).
Base-line characteristics, treatment factors, therapeutic management during hospitalization, and characteristics of the hospitals were compared among women and men in each age group by using χ2 test and non-parametric tests. Continuous variables are described as their mean values±standard deviation.
Follow-up was available for all the patients initially included. The end of the follow-up in the protocol was 12±1 month. The number of subjects at risk at 335 days of follow-up was high (3292 subjects with 774 deaths at 335 days), whereas the number of patients with no follow-up data at that time was 281 patients (6.5%).
The early mortality (i.e. up to day 15 of hospitalization), the 1-year mortality for those who survived, and the overall 1-year mortality were compared between women and men according to median age groups. Survival curves were estimated by the Kaplan–Meier method and compared by log-rank tests.
Each predictor identified through the univariate analysis with a P-value<0.20, and variables considered likely to have an important prognostic value were tested in a multivariable logistic regression model for death during hospitalization. Final adjustment in the logistic model was performed in each age group with the following variables: gender, body mass index, Killip class, current smoker, hypertension, diabetes, previous history of stroke, myocardial infarction, heart failure, dyslipidemia, previous family history of coronary disease, and time to admission.
Similarly, Cox proportional hazards model for time to death was used for the 1-year mortality among hospital survivors, adjusted on each predictor identified through the univariate analysis with a P-value<0.20 and on variables considered likely to have an important prognostic value. Final adjustment in each age group was performed with the following variables: gender, medical history (infarction, congestive heart failure, stroke, peripheral arterial disease, diabetes, hypertension, dyslipidemia), clinical characteristics of AMI (anterior, ST-elevation), Killip class, reperfusion therapy at acute stage, AF, VF, AV-block, and discharge treatments (anti-platelet, anti-arrhythmic agents, β-blockers, diuretics, digoxin, ACE-inhibitors, statins, nitrates). The assumption of proportional hazards assumed in the Cox proportional hazards model was assessed graphically. We then generated time-dependent covariates by creating interactions of the predictors and a function of survival time and included them in the model.
Results are expressed as odds ratios (OR) for logistic regression and as relative hazard (RH) for Cox models with 95% confidence intervals (CI). Analyses were performed using SAS® statistical software version 8.2.
Results
Baseline characteristics and in-hospital management of patients
In both age groups, women were significantly older than men, had a more frequent history of hypertension or diabetes mellitus, but fewer of them were current smokers or had a previous history of AMI (Table 1). Although signs of heart failure following admission (Killip class>1) were found more often in women, LVEF, when assessed, was similar among groups. The time from onset of symptoms to hospital admission was similar among younger men and women, but significantly longer for older women compared to men. On admission, the type of MI (Q-wave, vs. non-Q-wave) as well as its location was similar in the older age group of men and women. In contrast, the prevalence of anterior MI was higher for women in the younger age groups (Table 1).
Baseline characteristics of patients and hospitals according to sex and age
| 30–67 years | 68–89 years | |||||
|---|---|---|---|---|---|---|
| Group 1 (Women) n=308 | Group 2 (Men) n=1878 | P | Group 3 (Women) n=860 | Group 4 (Men) n=1301 | P | |
| Age | 57.4±8.5 | 53.9±9.0 | <0.0001 | 78.6±5.9 | 76.0±5.7 | <0.0001 |
| Cardiovascular history | ||||||
| Previous stroke | 13 (4.3%) | 55 (2.9%) | 0.22 | 64 (7.5%) | 110 (8.5%) | 0.41 |
| Previous congestive heart failure | 12 (3.9%) | 46 (2.5%) | 0.14 | 118 (13.8%) | 146 (11.3%) | 0.09 |
| Previous myocardial infarction | 31 (10.1%) | 275 (14.6%) | 0.03 | 144 (16.7%) | 335 (25.8%) | <0.0001 |
| Previous peripheral arterial disease | 19 (6.2%) | 118 (6.3%) | 0.96 | 71 (8.3%) | 217 (16.8%) | <0.0001 |
| Hypertension | 154 (50.3%) | 586 (31.3%) | <0.0001 | 575 (67.0%) | 668 (51.7%) | <0.0001 |
| Dyslipidaemia | 112 (37.5%) | 792 (42.8%) | 0.08 | 303 (35.9%) | 468 (36.4%) | 0.83 |
| Diabetes | 82 (26.9%) | 245 (13.1%) | <0.0001 | 223 (26.1%) | 274 (21.2%) | 0.009 |
| Current smoker | 101 (33.1%) | 1037 (55.5%) | <0.0001 | 35 (4.1%) | 204 (15.9%) | <0.0001 |
| Family history of coronary disease | 74 (24.3%) | 394 (21.2%) | 0.21 | 78 (9.3%) | 140 (11.1%) | 0.18 |
| Time from symptom onset to hospital-admission | 0.93 | 0.03 | ||||
| ≤3 h | 115 (40.8%) | 704 (39.0%) | 220 (27.7%) | 408 (33.8%) | ||
| >3 h to ≤6 h | 66 (23.4%) | 439 (24.3%) | 195 (24.6%) | 309 (25.6%) | ||
| >6 h to ≤12 h | 41 (14.5%) | 273 (15.1%) | 166 (20.9%) | 215 (17.8%) | ||
| > 12 h to ≤24 h | 35 (12.4%) | 246 (13.6%) | 125 (15.8%) | 161 (13.3%) | ||
| >24 h | 25 (8.9%) | 144 (8.0%) | 87 (11.0%) | 116 (9.6%) | ||
| Characteristics at admission | ||||||
| Anterior AMI | 126 (40.9%) | 586 (31.2%) | 0.008 | 293 (34.2%) | 432 (33.3%) | 0.68 |
| AMI with ST-elevation | 255 (83.1%) | 1483 (79.4%) | 0.14 | 623 (73.1%) | 938 (73.2%) | 0.98 |
| LVEF ≤35% | 30 (11.3%) | 148 (9.2%) | 0.30 | 122 (18.9%) | 216 (21.0%) | 0.31 |
| Killip class 1 (no heart failure) | 216 (70.1%) | 1547 (82.6%) | <0.0001 | 438 (51.0%) | 765 (58.9%) | 0.008 |
| Killip class 2–3 (heart failure/pulmonary oedema) | 70 (22.7%) | 272 (14.5%) | 331 (38.5%) | 404 (31.1%) | ||
| Killip class 4 (cardiogenic chock) | 22 (7.1%) | 54 (2.9%) | 90 (10.5%) | 131 (10.1%) | ||
| Registry | 0.62 | 0.74 | ||||
| USIC I (November 1995) | 147 (47.7%) | 868 (46.2%) | 430 (50.0%) | 641 (49.3%) | ||
| USIC II (November 2000) | 161 (52.3%) | 1010 (53.8%) | 430 (50.0%) | 660 (50.7%) | ||
| Type of Intensive Care Units | 0.15 | 0.72 | ||||
| University hospitals | 35 (23.8%) | 256 (29.5%) | 81 (18.8%) | 119 (18.6%) | ||
| Community hospitals | 94 (64.0%) | 480 (55.3%) | 275 (64.0%) | 423 (66.0%) | ||
| Private clinics | 18 (12.2%) | 132 (15.2%) | 74 (17.2%) | 99 (15.4%) | ||
| Facilities available for PTCA | 67 (45.6%) | 425 (49.0%) | 0.45 | 161 (37.4%) | 248 (38.7%) | 0.08 |
No difference was observed among groups regarding the type of intensive care units or the presence of facilities for PTCA (Table 1). However, reperfusion therapy by either thrombolysis or primary angioplasty was less often used at the acute stage for women (Table 2). Women of both age groups also received less anti-platelet agents, β-blockers, and statins than men during hospitalization (Table 2).
Characteristics of patients during hospitalization and at discharge according to sex and age
| 30–67 years | 68–89 years | |||||
|---|---|---|---|---|---|---|
| Group 1 (Women) n=308 | Group 2 (Men) n=1878 | P | Group 3 (Women) n=860 | Group 4 (Men) n=1301 | P | |
| ECG complications | ||||||
| Atrial fibrillation | 18 (5.6%) | 81 (4.3%) | 0.23 | 142 (16.7%) | 190 (14.7%) | 0.21 |
| Ventricular fibrillation | 14 (4.6%) | 56 (3.0%) | 0.15 | 26 (3.0%) | 64 (4.9%) | 0.03 |
| Type II or III auriculoventricular block | 9 (2.9%) | 64 (3.4%) | 0.66 | 71 (8.3%) | 98 (7.5%) | 0.53 |
| Procedures | ||||||
| Reperfusion therapy at acute stage | 163 (52.9%) | 1094 (58.3%) | 0.08 | 236 (27.4%) | 472 (36.3%) | <0.0001 |
| Thrombolysis | 104 (33.8%) | 698 (37.2%) | 0.25 | 141 (16.4%) | 294 (22.6%) | 0.0004 |
| PTCA | 128 (41.7%) | 932 (50.1%) | 0.007 | 223 (26.5%) | 416 (32.6%) | 0.002 |
| CABG | 4 (1.3%) | 42 (2.3%) | 0.28 | 11 (1.3%) | 28 (2.2%) | 0.13 |
| Treatments during hospitalization | ||||||
| Anti-platelet | 285 (92.5%) | 1810 (96.4%) | 0.002 | 773 (89.9%) | 1194 (91.8%) | 0.1321 |
| Heparin | 143 (97.3%) | 838 (96.5%) | 0.81 | 408 (94.9%) | 612 (95.5%) | 0.6556 |
| β-blockers | 217 (70.5%) | 1438 (76.6%) | 0.02 | 508 (59.1%) | 801 (61.6%) | 0.2359 |
| Statins | 88 (28.6%) | 698 (37.2%) | 0.004 | 160 (18.6%) | 304 (23.4%) | 0.0083 |
| ACE-inhibitors | 118 (38.3%) | 766 (40.8%) | 0.41 | 388 (45.1%) | 586 (45.0%) | 0.973 |
| Treatments at discharge | ||||||
| Antiplatelet | 276 (89.6%) | 1786 (95.1%) | 0.0001 | 732 (85.1%) | 1111 (85.4%) | 0.8575 |
| Anti-arrythmic agents | 26 (8.4%) | 122 (6.5%) | 0.21 | 89 (10.4%) | 157 (12.1%) | 0.2182 |
| β-blockers | 221 (71.8%) | 1538 (81.6%) | <0.0001 | 462 (53.7%) | 724 (55.7%) | 0.3778 |
| Digitalic | 6 (2.0%) | 27 (1.4%) | 0.45 | 52 (6.1%) | 57 (4.4%) | 0.0834 |
| Calcium channel blockers | 41 (13.3%) | 205 (10.9%) | 0.22 | 152 (17.7%) | 239 (18.4%) | 0.6808 |
| Diuretics | 62 (20.1%) | 269 (14.3%) | 0.008 | 356 (41.4%) | 469 (36.1%) | 0.0123 |
| Fibrate | 12 (3.9%) | 59 (3.1%) | 0.49 | 19 (2.2%) | 39 (3.0%) | 0.267 |
| Statins | 111 (36.0%) | 864 (46.0%) | 0.001 | 210 (24.4%) | 374 (28.8%) | 0.0266 |
| Nitrates | 163 (52.9%) | 986 (52.5%) | 0.89 | 518 (60.2%) | 782 (60.1%) | 0.9537 |
| ACE-inhibitors | 139 (45.1%) | 857 (45.6%) | 0.87 | 401 (46.6%) | 630 (48.4%) | 0.4132 |
Mortality after AMI: evidence of an age-gender interaction
The overall 1-year mortality was higher in women (25±1.3% vs. 16±0.7% in men, P<0.0001). The probability of death at 1 year was different in the four groups (P<0.0001) (Figure 1A). It was significantly higher in women than in men in the younger age groups (14±2% vs. 8±0.6%, respectively, P=0.0005), but no difference was observed in the older groups (29±2% vs. 27±1% for women and men respectively, P=0.31). The interaction between age and gender was significant on the overall and in-hospital mortality (P=0.05 and P=0.002, respectively), but not when the analysis was restricted to hospital survivors (P=0.1225). Moreover, in all groups, the overall mortality curves showed two different slopes with a high probability of death during the early phase followed by a lower probability of mortality thereafter (Figure 1A). Therefore, we analysed the in-hospital and out-of-hospital periods in order to determine whether gender differences according to age were still observed in both periods separately (Figure 1B and C).
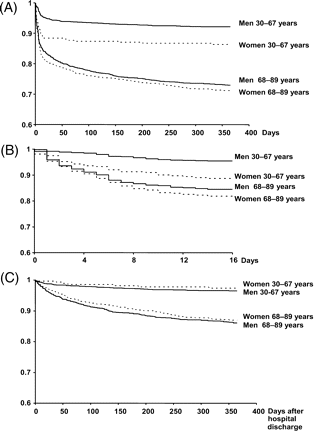
Kaplan–Meier survival curves in young and old men (line) and women (dotted line). (A) During the overall 1-year follow-up. (B) During hospitalization. (C) During 1-year follow-up among those discharged from hospital.
Early Mortality and in-hospital complications
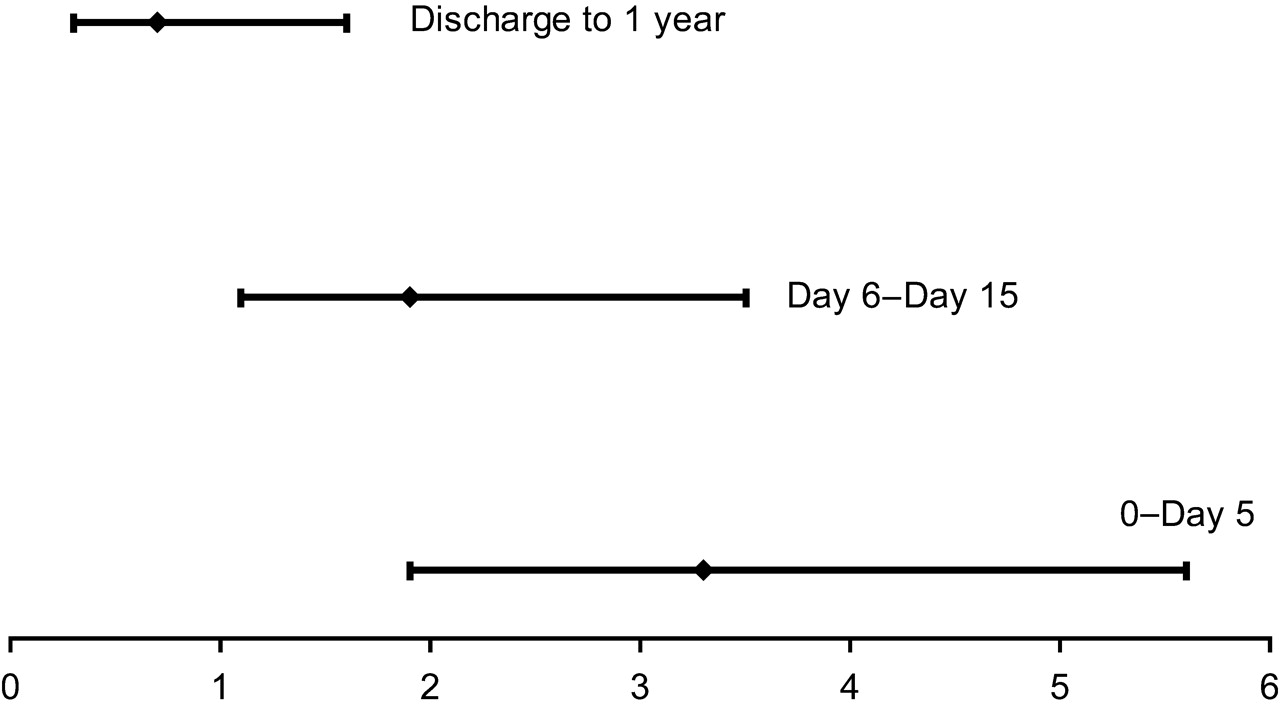
Among the 4347 patients included, 480[192 (16%) women vs. 288 men (9%)] died during hospitalization. The in-hospital complications were similar among men and women (Table 2). VF was similar (though slightly higher in women) in the younger age groups. In contrast, VF was significantly higher in older men compared to older women (Table 2). The probability of death during hospitalization was also higher for women in each age group, as shown in Figure 1B (11±2% and 5±0.5% in younger women and men; 18±1% and 16±1% in the older groups of women and men, respectively). However, after adjustment in the multivariable logistic regression model, the higher risk of hospital mortality in women was not similar among age groups: in the younger group, the risk of death in women was twice that of men (OR: 2.4, 95%CI: 1.4–4.3, P=0.003) whereas no difference between men and women was found in the older age group (OR: 1.2, 95%CI 0.9–1.7, P=0.3). In the younger age group (30–67 years), the women/men death ratio was the highest in the very first days of hospitalization (Figure 2). Besides gender, the other significant predictor of hospital mortality was the higher Killip class on admission.
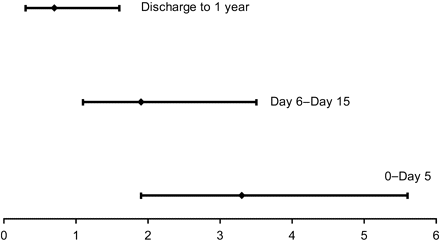
Women/men death ratio and 95% CI during the early phase (day 0 to day 5), and later phase of hospitalization (day 6 to day 15) and after hospital discharge.
Hospital survivors
Among the 3857 patients discharged from the hospital, women were also significantly older than men, had more often anterior MI, previous history of hypertension or diabetes, but fewer previous MI, and were less frequently smokers. At hospital discharge, women in both age groups received more diuretics and less statins than men, and prescription of anti-platelet agents and β-blockers was less often present in younger women compared to younger men (Table 2).
During the 1-year follow-up, 305 patients of the whole population [208 men (7%) and 97 women (10%)] died after hospital discharge. When classified by age groups, however, the probability of death at 1 year was similar in women in each age group than in men in each age group (Figure 1C): (3±1% and 4±0.4% in younger women and men; 13±1% and 14±1% in the older groups of women and men, respectively). Control for age in combination with baseline characteristics and hospital and discharge treatments confirmed the lack of sex differences. The adjusted risk of dying, after the initial hospital stay, in women compared to men was 0.45 (95% CI: 0.19–1.07, P=0.07) and 0.93 (95%CI: 0.70–1.25, P=0.23) in the younger and older age groups, respectively. The significant predictors of out-of-hospital mortality were higher Killip class at admission, previous history of myocardial infarction, peripheral arterial disease, anterior myocardial infarction, and absence of β-blockers at discharge in both the younger and older age groups, and reperfusion at acute stage and absence of diuretics at discharge only in the older age group. The results were similar in USIC I and II registries.
Discussion
The present study, covering over 80% of the intensive care units in charge of AMI in France, shows that the excess overall 1-year mortality observed in women after AMI is exclusively because of the higher risk of death during hospitalization. However, the worse prognosis in women is limited to the younger age group during the early phase, regardless of any clinical or severity characteristics, as well as hospital treatments and procedures. In contrast, at ages over 67 years, the risk of dying, during and after hospitalization, is related to the severity of the disease but not to gender.
Frequency of AMI
The frequency of AMI was significantly lower among women than men, parallel to previous findings.7,19 The lower incidence of AMI in southern European countries seems to be inversely correlated with a high female/male ratio. In our study, women below the age of 68 represented 7% of all AMI cases as compared with 43% for men under 68. The relative difference between women and men decreased with age but the frequency remained lower in women (20% vs. 30% in women and men aged 68–89 years).
Early mortality after AMI
In several previous studies,4–7 the higher short-term mortality in women was explained by older age alone or combined with a higher frequency of comorbidities. Women in our study were also older with more frequent heart failure at admission than men, although LVEF, when assessed, appeared to be similar. This may be related to a slightly higher frequency of prior heart failure and/or diastolic dysfunction in women.19 Some studies have suggested that diabetes may play a key role in the difference of mortality in women.7,20 In the present study, women in both age groups were more likely to have diabetes than men, and the difference within each age group was higher among the younger groups. However, in line with the findings of Vaccarino et al.,14 the effect of diabetes on sex-based mortality differences was not significant and did not explain the worse outcome in women. Moreover, the higher risk of death persisted after adjustment with prognostic factors suggesting that traditional prognostic factors do not explain per se the higher risk for women at younger ages. It is not possible, however, to rule out the hypothesis that some residual confounding factors may account in part for the elevated risk among younger women.
Several studies investigating the association of sex and age on early mortality have found no differences.10,12 However, using age-adjustment on the whole population may mask a specific difference for younger women, as their proportion among the whole population of women sustaining an AMI is extremely low. A worse in-hospital mortality was found only in younger but not older women in the American National Registry of MI, with a linear increase in risk with decreasing age14. A higher mortality during hospitalization for AMI was also observed in younger women below 70 years of age in the Swedish AMI register.7 Inversely, in a Spanish database, a worse outcome was observed in older women, but not in younger, compared to men.13 The authors hypothesized that young women develop AMI with lower frequency and less severe characteristics in southern Europe than in the US or northern Europe. Our results, remarkably similar to those reported by Vaccarino et al.,14 do not confirm this hypothesis. The Spanish study was a smaller database performed in a single region with 447 women, of whom only 175 were aged below 65. A first Q-wave MI in women aged 25–74 was a pre-requisite in the Spanish study, while other studies also included, over a wider age range (30–89 years), women with non-Q wave or with a previous history of AMI.
In our study, the early risk of death in women increased with decreasing age. Compared to men, the adjusted risk of death was 2.73 (95%CI=1.31–5.69, P=0.007) among the 161 women aged 30–59 years and 1.45 (95%CI=0.71–2.97, P=0.30) among women aged 60–69 (n=202).
Long term mortality after AMI
In line with several studies,21,22 the long-term outcome in our study was similar among male and female survivors of the acute phase. Few studies have investigated the age–sex differences on long-term mortality, beyond the initial hospital stay. Two studies7,23 observed a higher risk of death among women aged below 60 years23 or only in those below 50.7 A third study found no difference between sex and four age groups as regards death rates.24 In our study, no increased risk persisted in the younger women after adjustment; if anything, the trend was in the opposite direction. Compared with men, the risk of death was 0.14 (95%CI=0.03–0.67, P=0.01) among the women aged 30–59 years and 0.56 (95%CI=0.23–1.41, P=0.0.2) among women aged 60–69.
Sex–age differences in mortality
The reasons for the sex–age differences in the early mortality remain unclear. Gender differences in the management after AMI have been reported. Reperfusion therapy, anti-platelet agents, β-blockers, and statins were less often used at the acute stage for both younger and older women compared with men, and the sex–age differences observed persisted after adjustment. Therefore, it is not clear why only the younger women appeared to have a substantially higher risk of death than men, and this only during the first days following the acute episode.
Referral bias is possible as the lower incidence of AMI in young women increases the probability of unrecognized AMI for milder cases in this population.7 Moreover, the higher rate of in-hospital death in women might be balanced with a higher rate of pre-hospital death in men.7 However, in the WHO MONICA project that evaluated populations aged 35–64 years, a higher rate of age adjusted pre-hospital death was observed in women in 13 countries, including France.25 The age-adjusted women/men ratio for 28-day mortality ranged from 1.48 (95%CI=1.35–1.63) to 1.15 (95%CI=1.06–1.23) in the south and north of France, respectively.25 Therefore, it is unlikely that accounting for out-of-hospital deaths would have eliminated the higher incidence of mortality from MI among younger women in the present study.
The incidence of coronary heart disease is low before menopause and steadily increases after menopause. Bilateral oophorectomy before natural menopause increases the risk for coronary heart disease.26 This pattern of risk suggests that endogenous oestrogens may play a cardioprotective role before menopause. The genomic effects of oestrogen are mediated through activation of oestrogen-receptor α (ESR1) and β. The presence of ESR1 haplotype1 has been associated with a 2-fold increased risk of AMI and fatal AMI27 and in-stent re-stenosis28 in women. Younger women with AMI may have a lower expression of ESR1 and/or a higher frequency of ESR1 haplotype1, but this hypothesis remains to be investigated. In addition, women have smaller hearts than men, which might expose them to complications such as free wall rupture, particularly when the heart is not hypertrophic or fibrotic, which might then explain why the excess in early mortality would be limited to younger women. In the present study, the frequency of free-wall rupture was higher among young women; however, the small number of cases did not allow any statistical comparisons. The mechanism underlying the excess mortality in younger women does not seem to be related to a lower fibrillatory threshold, as episodes of VF were as frequent in women as in men.
The present study is limited by the post-hoc nature of its analyses and the use of multivariable models in order to adjust baseline differences within groups.
Conclusion
The higher observed mortality rate following MI in women is limited to young women, during the initial stage of the acute episode. Obviously, only a small number of deaths from AMI occur in young women, but the improvement of survival after MI over the last decade has been observed in men aged 25–64 but not in women.2 Further studies are warranted to investigate the reasons for this poorer initial outcome but, whatever the cause, preventive actions and aggressive medical care are crucial for improving the chance of survival in young women at risk of MI.
Acknowledgements
The USIC registries were supported by an unrestricted grant from Aventis, France.
Conflict of interest: none declared.

