


Abstract
Aims Plasma brain natriuretic peptide (BNP) concentration increases in proportion to heart failure (HF) severity. Although plasma BNP decreases to a certain level by optimal treatment, there is significant heterogeneity in the baseline value among individuals. The underlying mechanism of the steady-state plasma BNP levels remains still controversial. We investigated the hypothesis that myocardial stiffness (Km) is a major determinant of the plasma BNP level.
Methods and results In 19 patients with diastolic HF [DHF; left ventricular ejection fraction (LVEF)≥45%], 18 with systolic HF (SHF; LVEF<45%), and 12 controls, left ventricular (LV) performance variables and the results of the stress–strain analyses were obtained by the combined simultaneous measurement of echocardiographic and haemodynamic data, and compared with the plasma BNP level. In DHF, a significant correlation was observed between plasma BNP and fractional shortening (P=0.010), pulmonary capillary wedge pressure (P=0.030), end-diastolic pressure (P=0.006), time constant of the LV isovolumic-pressure decline (P=0.049), end-diastolic stress (P=0.012), and Km (P=0.004), respectively. In SHF, a significant correlation was observed between plasma BNP and end-diastolic stress (P=0.036), chamber stiffness (P=0.048), and Km (P=0.003), respectively.
Conclusion In stable conditions, Km may be the most important determinant of the plasma BNP production in patients with both DHF and SHF.
Introduction
Brain or B-type natriuretic peptide (BNP) is a 32-amino acid polypeptide containing a 17 amino acid ring structure.1,2 It was originally discovered in porcine brain tissue,3 and later found in the human heart.4 BNP is a cardiac neurohormone that is specifically secreted from the cardiac ventricles in response to ventricular volume expansion, pressure overload, and the resultant increased wall tension.5–7 BNP has a minimal presence in storage granules,5–7 but is released in response to the degree of myocardial stretch, damage, and ischaemia.8 Many clinical studies have shown that the plasma BNP level is increased in patients with congestive heart failure (CHF), and therefore BNP is regarded as a hallmark of disease severity.9–11 When vasodilators, diuretics, or angiotensin-converting enzyme (ACE)-inhibitors are administered to patients, and the volume and/or pressure overload to the LV is attenuated, the plasma BNP level decreases to a certain level. However, the baseline value for BNP at steady-state varies widely among individuals. The baseline BNP concentration may be affected by the degree of underlying haemodynamic abnormalities, including myocardial systolic or diastolic properties. When the major determinant of the plasma BNP level has been clarified, we are confident of understanding the heart failure (HF) state in relation to the measured BNP level.
A recent study reported that the plasma BNP level is closely related to LV diastolic dysfunction in patients with preserved LV systolic function, independent of LV hypertrophy.12 As myocardial stiffness is considered to be an essential myocardial diastolic property independent of the loading conditions, it may be a powerful determinant of the plasma BNP concentration.
To elucidate whether LV myocardial stiffness is a major determinant of the plasma BNP level, we employed a stress–strain analysis using two-dimensional echocardiography with simultaneous measurement of the LV pressure. With this method, echocardiographic and haemodynamic variables, including myocardial stiffness, were obtained, and the relationships of these variables with the plasma BNP level were analysed.
Methods
Study population
In the study, patients underwent diagnostic catheterization for the evaluation of the suspected ischaemic heart disease or myocardial disease who met the following criteria were enrolled: (i) hospitalized due to acute CHF; (ii) stable condition after optimal medical therapy including diuretics, vasodilators, ACE-inhibitors; (iii) no prior Q-wave myocardial infarction; (iv) no renal dysfunction (defined as a creatinine value ≥2.0 mg/dL); (v) no significant valve diseases; (vi) no atrial fibrillation; (vii) no significant coronary artery stenosis (>50%).
Initially, 57 patients of CHF who met the criteria were enrolled. Twelve patients were excluded from the analysis because they did not give the informed consent. Eight patients were excluded because of the poor echocardiographic images. Finally, 37 (65%) patients (63±12 years, range 33–80 years) were analysed. The patients were divided into two groups according to their history of HF and cardiac function. Nineteen patients (64±14 years) with pressure overload HF due to hypertensive heart disease who had an angiographic LV ejection fraction (LVEF) of ≥45% were assigned to diastolic HF group (DHF). Eighteen patients (61±9 years) with non-ischaemic dilated cardiomyopathy, who had an LVEF of <45% were assigned to systolic HF group (SHF). Also, 12 patients (60±11 years) who underwent cardiac catheterization for the evaluation of atypical chest pain were assigned to controls (CONT). They had no history of cardiovascular disease, and all had angiographically normal epicardial coronary arteries and normal LV volume, LVEF, and wall motion. The baseline characteristics of the study subjects are shown in Table 1. All the HF patients had been given optimal treatment to reduce the overloading condition and were clinically stable. Twenty-eight patients were in New York Heart Association (NYHA) class II, and 9 were in class III. All patients gave written informed consent, and the study was approved by the local Ethics Committee.
BNP assays
Blood samples were obtained before examination. The samples were withdrawn into plastic syringes, transferred to chilled siliconized disposable tubes containing aprotinin (1000 kallikrein inactivator units/mL) (Ohkura Pharmaceutical, Kyoto, Japan) and ethylenediaminetetraacetic acid (1 mg/mL), immediately placed on ice, and then centrifuged at 4°C. An aliquot of the plasma was immediately frozen at −80°C and thawed only once at the time of the assay within 1 week. The plasma BNP concentration was measured using a specific immunoradiometric assay kit (Shionogi Co., Osaka, Japan) as previously reported.13
Study protocol
After right heart catheterization to measure the pulmonary capillary wedge pressure (PCWP), left ventriculography was performed to measure the LVEF and LV end-diastolic and end-systolic volume index (LVEDVI, LVESVI, respectively), which were derived from the single-plane angiogram using the area–length method. And then, LV dimensions and wall thickness were assessed echocardiographically, while simultaneously measuring the LV pressure, during intravenous injection of phenylephrine hydrochloride (0.1–0.5 mg) to alter the blood pressure. This injection was repeated until the LV end-systolic pressure (LVESP) increased to ≥15–20 mmHg. All data were recorded on high-speed paper for off-line analysis.
Echocardiographic measurement
M-mode recordings were obtained with commercially available instruments (SONOS 5500™; Agilent Technologies Inc., Palo Alto, CA, USA) operating at 2.5 MHz. Two-dimensional imaging examinations were performed in the standard manner from parasternal long- and short-axis views and the LV dimensions were measured from M-mode images according to standard criteria.14 LV mass was calculated according to a formula derived from the method of Devereux et al.15
LV pressure measurement
A 6F high-fidelity micromanometer catheter (CENTRON™; Centron International Inc., Mineral Wells, TX, USA) was inserted into the middle of the LV cavity for measurement of the LVESP, LV end-diastolic pressure (LVEDP), and the time constant of the LV isovolumic-pressure decline (τ). τ was calculated by the method of Weiss et al.,16 and active myocardial relaxation was supposed to be 97% completed after a time interval of 3.5×τ (ms) starting from dP/dTmin.17
Data analyses
Chamber stiffness can be quantified by examining the relationship between the diastolic pressure and volume. The operating stiffness at any point along a given pressure–volume curve is equal to the slope of a tangent drawn to the curve at that point (dP/dV). As the diastolic pressure–volume relationship is curvilinear and generally exponential, the relationship between dP/dV and pressure is linear. Its slope is called the modulus of chamber stiffness (diastolic chamber stiffness constant, Kc) and can be used as a single numerical value to quantify chamber stiffness.
stress–strain relationships were calculated using a cylindrical model of LV geometry. We used a simplified echocardiographic and haemodynamic method to assess the stress–strain relationships in humans. Determination of the stress–strain relationships was carried out using the modified method of Esposito et al.18,19 Meridional stress (σ) of the LV mid-wall was calculated by σ=P×Dm/[h×(1+h/Dm)], where P is the LV pressure, Dm is the instantaneous mid-wall short-axis diameter of the LV, and h is the LV wall thickness.20 Natural strain (ε) is defined as ε=ln(Dm/Dom), where Dom is the zero-stress mid-wall short-axis diameter.
Myocardial stiffness can be quantified by examination of the relationship between myocardial stress (σ) and strain (ε) during diastole. At any given strain, myocardial stiffness is equal to the slope (dσ/dε) of a tangent drawn to the stress–strain relationship at that strain. As the stress–strain relationship is curvilinear and exponential, the relationship between (dσ/dε) and stress is linear, and the slope of this relationship is the modulus of myocardial stiffness (diastolic myocardial stiffness constant, Km). Thus, Km is a dimensionless constant that represents the myocardial passive diastolic properties.21 When myocardial stiffness is increased, the stress–strain relationship shifts to the left, such that for any given change in myocardial length (strain), there is a greater increase in force (wall stress) that develops to resist this deformation. In addition, the slope of (dσ/dε) vs. the stress relationship becomes steeper and Km increases when myocardial stiffness is increased.
Statistics
The sample size was based on the preliminary data obtained in our laboratory and was determined on the basis of the following assumptions: Type I error of 0.05 (two-sided), power of 80%, difference on the Km between the controls and heart failure group of 1.2, SD of 1.0. Therefore, a minimum of 12 patients would yield 80% power to detect a difference in the Km. A P-value <0.05 was considered to indicate statistical significance. All reported P values are two-sided. Group comparisons of the plasma BNP level and echocardiographic or haemodynamic variables were carried out using one-way analysis of variance with Scheffe's post hoc multiple comparisons. Because the distribution of the plasma BNP levels was positively skewed, the natural log transformation was used. The associations of log BNP with each echocardiographic and haemodynamic variable that are known to affect the plasma BNP levels with epidemiological approach were assessed by Spearman's correlation coefficient (r). Normally distributed continuous data are expressed as mean±SD. The plasma BNP level is expressed as the median with interquartile range (IQR; 25–75th percentiles).
Results
Baseline echocardiographic and haemodynamic variables
The LV end-diastolic and end-systolic diameters (LVDd, LVDs), LVEDVI, and LVESVI in SHF were larger than those in CONT and in DHF (all P<0.0001, respectively). End-diastolic and end-systolic posterior wall thicknesses (PWtd, PWts) in DHF were larger than those in CONT (P=0.002 and 0.021, respectively) and in SHF (P<0.0001 and <0.0001, respectively). Fractional shortening (FS) and LVEF in SHF were smaller than those in CONT and in DHF (all P<0.0001, respectively). The ratio of LV mass to body surface area (LV mass index, LVMI) was larger in SHF than in CONT (P=0.009). PCWP and LVEDP were larger in DHF than in CONT (P=0.029 and 0.019, respectively) and in SHF (P=0.007 and 0.011, respectively), whereas LVESP did not differ among the three groups. τ was larger in DHF (P=0.036) and SHF (P=0.029) than in CONT (Table 2).
Plasma BNP level
The plasma BNP level in SHF was significantly higher than in CONT (P=0.009), and the level in DHF was higher than that in CONT [CONT: 20 (IQR 17–23), DHF: 179 (IQR 27–254), SHF: 230 (IQR 90–330) pg/mL] (Figure 1).
Haemodynamic changes by phenylephrine injection
The increase in LVEDP (CONT: 7±4, DHF: 10±5, SHF: 11±4 mmHg) and LVESP (CONT: 38±8, DHF: 45±19, SHF: 36±17 mmHg) induced by phenylephrine in each group showed no difference among the three groups. The expected myocardial relaxation time (3.5×τ) was shorter than the observed time interval from dP/dTmin to end-diastole both in the baseline and after phenylephrine injection in the three groups. Thus, delayed and incomplete myocardial relaxation was not likely to be present both in the baseline and after phenyleprine injection (Table 3).
stress–strain relationships
End-diastolic and end-systolic stress in SHF were larger than in DHF (P<0.0001) and in CONT (P<0.0001). Kc was larger in DHF than in CONT (P=0.036) and in SHF (P=0.002). Km was larger in DHF (P=0.004) and SHF (P=0.0004) than in CONT and did not differ between DHF and SHF (Table 4).
Correlations between the plasma BNP level and haemodynamic variables
Table 5 summarizes the correlations between the plasma BNP level and haemodynamic variables in DHF and SHF. In DHF, a significant correlation was observed between plasma BNP and FS (P=0.010), PCWP (P=0.030), LVEDP (P=0.006), τ (P=0.049), end-diastolic stress (P=0.012), and Km (P=0.004), respectively. In SHF, a significant correlation was observed between plasma BNP and end-diastolic stress (P=0.036), Kc (P=0.048), and Km (P=0.003), respectively. Figure 2 shows the correlations between log BNP and haemodynamic variables both in DHF and SHF.
Discussion
The results of the current study revealed a strong correlation between passive diastolic myocardial stiffness and the plasma BNP level both in DHF and SHF. Although the underline diseases of DHF and SHF are different, myocardial stiffness and end-diastolic stress were the common determinants of the plasma BNP level in both groups. Also, FS, PCWP, LVEDP, and τ were the weak determinants of the plasma BNP level, but these relations were only found in DHF and not in SHF. These discrepancies may be attributable to the complexity of BNP increasing factors and also to the heterogeneity of the study subjects. To the best of our knowledge, this is the first study to systematically examine the relationships between the plasma BNP level and LV myocardial properties in patients with chronic HF.
Heart failure and BNP
The recent guidelines for the evaluation and management of CHF explain the role of the plasma BNP level in evaluating patients with CHF and recommend a BNP-guided strategy for managing HF.22 However, it is well recognized that the baseline value of the plasma BNP level at steady-state after optimal therapy varies widely among individuals in clinical settings. These facts lead us to the hypothesis that myocardial factors besides the volume and/or pressure overload to the LV should exist. In order to develop a BNP-guided strategy for managing HF, we believe that it is necessary to explore the mechanisms of the heterogeneity in cardiac BNP expression.
Elevation of the plasma BNP level is considered to reflect LV structural and functional alterations. On the contrary, a reduction in the plasma BNP level is usually observed after optimal therapy with vasodilators, diuretics, and ACE-inhibitors. Plasma BNP level is a more sensitive and specific indicator of ventricular disorders than other substances, such as endothelin and norepinephrine. Previous in vitro studies have reported that BNP gene expressions are regulated by mechanical stretching of myocytes,23 wall stress,1 and myocyte hypertrophy.24 End-diastolic stress incorporates LV pressure and geometry so that it serves as a measure of the loading on myocardial wall. Vanderheyden et al.25 reported that diastolic load such as end-diastolic stress modulated BNP production in symptomatic patients with pressure overload cardiomyopathy without overt LV systolic dysfunction. These suggest that an increase in the plasma BNP level is a direct counter-regulatory response to myocardial wall in the failing myocardium. They also reported that FS and PCWP correlated with the plasma BNP, but their study subjects were limited to aortic stenosis. In our study, DHF patients showed the same results. In DHF, the plasma BNP level had a correlation with FS and PCWP. On the other hand, in SHF, the plasma BNP level had no correlation with FS and PCWP. The FS and PCWP are the index of LV systolic performance being dependent on LV loading conditions. Thus, we speculate that FS and PCWP could not be the strong determinants of the plasma BNP level, especially when overloading condition had been removed. Therefore, in SHF, steady-state plasma BNP level showed no correlation with FS and PCWP.
Myocardial stiffness and BNP
One may raise a question why myocardial stiffness has an essential correlation with the plasma BNP level in patients with both SHF and DHF. Some may claim that patients with elevated myocardial stiffness have significant LV hypertrophy leading to an increased plasma BNP level. Earlier studies clarified that the plasma BNP levels were increased in hypertensive heart disease26 or aortic stenosis,27 suggesting that elevation of the plasma BNP level is related to LV hypertrophy. On the other hand, Yamaguchi et al.12 reported that the plasma BNP level was elevated in patients with DHF due to hypertensive heart diseases independent of LV hypertrophy. Hence, it is still unclear whether the increased BNP level at steady-state after optimal therapy is due to LV hypertrophy.
There is a possibility that the patients associated with increased myocardial stiffness in the present study may also have elevated LVEDP, which leads to an elevated plasma BNP level. Many clinical studies have shown that LVEDP is one of the major determinants of the plasma BNP level.6,10,28 It is well known that a reduction in the plasma BNP level is usually observed after optimal therapy with vasodilators, diuretics, and ACE-inhibitors, which often reduce LVEDP in patients with chronic HF. An important question is whether or not the baseline plasma BNP value after optimal treatment is closely correlated with LVEDP. In the present study, LVEDP showed a weak correlation with the plasma BNP level in DHF and no correlation in SHF. These observations may be attributed to the presence of a group of SHF patients with preserved LVEDP. LVEDP is influenced by several factors including LV chamber stiffness. It must be emphasized that LV remodeling and enlargement in SHF patients decreases LV chamber stiffness, and leads to a decreased LVEDP. Thus, LVEDP may not be a major determinant of the baseline plasma BNP level after optimal therapy.
Elevation of the plasma BNP level at steady-state may reflect the presence of progressive LV fibrosis12 that leads to an increase in myocardial stiffness.29,30 The area of intense BNP expression in the ventricle was associated with regions of fibrosis, suggesting that an intimate role between the fibrotic process and local natriuretic peptide production.31 Tsuruda et al.32 reported that BNP is produced in cultured cardiac fibroblasts and induces matrix metalloproteinases. Those studies together with our findings suggest that, myocardial fibrosis associated with elevated myocardial stiffness, may be a possible mechanism of the elevated plasma BNP level at steady-state in patients with HF after optimal therapy.
Limitations
There are several potential limitations of this study. First, we applied a simple cylindrical model of LV geometry to calculate the stress–strain relationships using only the short-axis view. Due to the technical difficulty involved in the catheterization procedure, long-axis parameters could not be obtained for calculating the stress–strain relationships. Secondly, the intravenous injection of phenylephrine hydrochloride may have some influence on cardiac function. However, as we administered the phenylephrine hydrochloride to all patients using the same protocol, there were no differences in the increase in LVESP and LVEDP among the three groups; any potential influence by phenylephrine injection probably had little effect on each patient in this study. Thirdly, none of the patients enrolled into our study received beta-blockers. We administered beta-blockers to the patients after the diagnostic catheterization. It is of interest to investigate the changes in plasma BNP levels and myocardial stiffness after beta-blocker therapy associated with reverse remodelling of LV. Also, according to the limited number of the study subjects, we could not assess the primary factor for increasing LV myocardial stiffness. It warrants further study.
Clinical implications and conclusions
Comparing myocardial stiffness among patients with heart disease may have clinical implications. The correlation between myocardial stiffness and the plasma BNP level revealed in the present study suggests that elevated myocardial stiffness in patients may precipitate decompensated HF, regardless of their LVEF or LVEDP. On the other hand, depressed LVEF and/or the presence of LV hypertrophy and preserved passive myocardial stiffness in patients may be less likely to exacerbate HF. Heterogeneity in the symptoms of HF and prognosis among patients with impaired diastolic and/or systolic function is well recognized. Our method to assess passive myocardial stiffness in the clinical setting may facilitate exploration of the mechanism of the transition from any form of pressure and/or volume overload LV hypertrophy to decompensated HF.
In conclusion, a good correlation was observed between passive diastolic myocardial stiffness and the plasma BNP level both in DHF and SHF. Passive myocardial stiffness may be a major determinant of the plasma BNP level in patients with both DHF and SHF.
Conflict of interest: no conflict of interest exists.
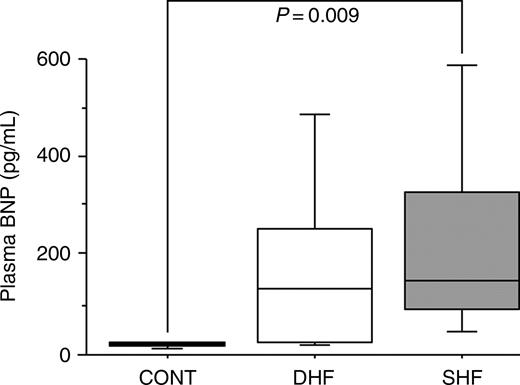
Figure 1 Boxplots depiction of the plasma BNP level; bars in each group represent 10th, 25th, 50th, 75th, and 90th percentile BNP values.
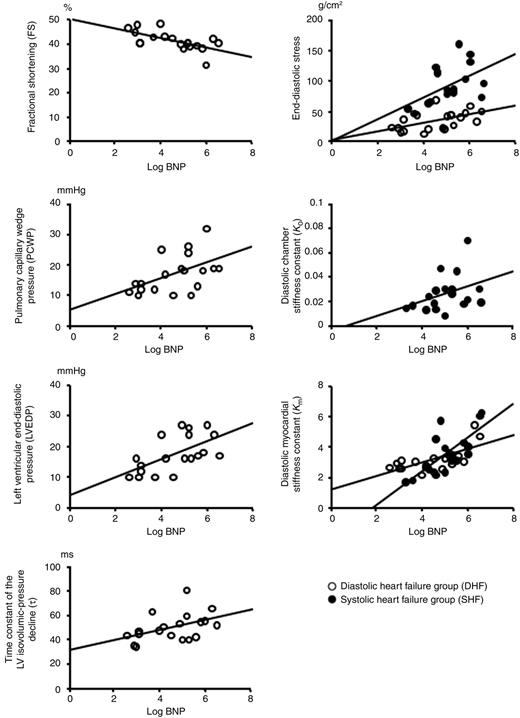
Figure 2 Scatterplots (DHF, open circles; SHF, closed circles) depicting the correlations between the log BNP and each haemodynamic variable.
Patient characteristics
| CONT | DHF | SHF | |
|---|---|---|---|
| (n=12) | (n=19) | (n=18) | |
| Age (years) | 60±11 | 64±14 | 61±9 |
| Gender (M/F) | 6/6 | 14/5 | 13/5 |
| NYHA classification II/III | 0/0 | 18/1 | 10/8 |
| Medication | |||
| ACE-inhibitors, n (%) | 0 (0) | 7 (37) | 14 (78) |
| Diuretics, n (%) | 0 (0) | 2 (11) | 11 (61) |
| Nitrates, n (%) | 0 (0) | 6 (32) | 4 (22) |
| Beta-blockers, n (%) | 0 (0) | 0 (0) | 0 (0) |
| Calcium channel blockers, n (%) | 0 (0) | 7 (37) | 0 (0) |
Data are presented as mean±SD or number of patients (%).
Baseline echocardiographic and hemodynamic variables
| CONT | DHF | SHF | |
|---|---|---|---|
| LVDd (mm) | 46.1±4.2 | 45.1±5.7 | 62.1±7.5a |
| LVDs (mm) | 28.8±4.2 | 30.0±5.1 | 52.0±7.8a |
| PWtd (mm) | 9.5±0.9 | 12.0±2.4a | 8.1±1.3 |
| PWts (mm) | 13.7±1.8 | 16.3±3.0a | 10.6±2.4 |
| FS (%) | 38±5 | 41±4 | 16±7b |
| LVMI (g/m2) | 98±25 | 123±37 | 139±34c |
| LVEDVI (mL/m2) | 76±15 | 82±17 | 121±28a |
| LVESVI (mL/m2) | 32±8 | 30±9 | 84±29a |
| LVEF (%) | 60±4 | 61±6 | 31±7b |
| PCWP (mmHg) | 12±4 | 17±6a | 12±4 |
| LVEDP (mmHg) | 12±4 | 18±6a | 12±5 |
| LVESP (mmHg) | 135±19 | 148±32 | 131±35 |
| τ (ms) | 35±4 | 50±11c | 51±23c |
aLargest when compared with the other groups.
bSmallest when compared with the other groups.
cLarger than in CONT.
Evaluation of the completion of myocardial relaxation
| CONT | DHF | SHF | |
|---|---|---|---|
| LVEDP (mmHg) | 12±4/19±6a | 18±6/25±8a | 12±5/25±8a |
| LVESP (mmHg) | 135±19/173±17a | 148±32/178±28a | 131±35/159±29a |
| Observed time from dP/dTmin to end-diastole (ms) | 484±140/477±151 | 434±93/468±116 | 457±146/459±184 |
| Predicted completion of relaxation (ms) | 121±14b/166±40b | 175±40b/190±61b | 179±81b/208±49b |
Data are presented as baseline/after phenylephrine injection.
aThe increase in LVEDP and LVESP induced by phenylephrine in each group showed no difference among the three groups. The predicted completion of relaxation was computed as 3.5×τ.
bP<0.0001, compared predicted completion of relaxation with observed time from dP/dTmin to end-diastole.
Stress–strain relationships
| CONT | DHF | SHF | |
|---|---|---|---|
| End-diastolic stress (g/cm2) | 29±11 | 37±16 | 92±35a |
| End-systolic stress (g/cm2) | 135±31 | 175±50 | 399±102a |
| Kc | 0.035±0.031 | 0.071±0.049a | 0.026±0.015 |
| Km | 1.943±0.320 | 3.263±0.813b | 3.549±1.400b |
| CONT | DHF | SHF | |
|---|---|---|---|
| End-diastolic stress (g/cm2) | 29±11 | 37±16 | 92±35a |
| End-systolic stress (g/cm2) | 135±31 | 175±50 | 399±102a |
| Kc | 0.035±0.031 | 0.071±0.049a | 0.026±0.015 |
| Km | 1.943±0.320 | 3.263±0.813b | 3.549±1.400b |
aLargest when compared with the other groups.
bLarger than in CONT.
Correlations of hemodynamic variables to log-transformed BNP in DHF and SHF
| DHF | SHF | |||
|---|---|---|---|---|
| r | P-value | r | P-value | |
| FS (%) | −0.609 | 0.010 | −0.333 | 0.170 |
| LVMI (g/m2) | 0.349 | 0.139 | 0.072 | 0.765 |
| LVEDVI (mL/m2) | 0.017 | 0.943 | 0.298 | 0.219 |
| PCWP (mmHg) | 0.511 | 0.030 | 0.412 | 0.090 |
| LVEDP (mmHg) | 0.654 | 0.006 | 0.412 | 0.089 |
| τ (ms) | 0.464 | 0.049 | −0.305 | 0.209 |
| End-diastolic stress (g/cm2) | 0.592 | 0.012 | 0.508 | 0.036 |
| Kc | 0.101 | 0.670 | 0.480 | 0.048 |
| Km | 0.684 | 0.004 | 0.726 | 0.003 |
References
Stein BC, Levin RI. Natriuretic peptides: physiology, therapeutic potential, and risk stratification in ischemic heart disease.
Cheung BM, Kumana CR. Natriuretic peptides–relevance in cardiovascular disease.
Sudoh T, Kangawa K, Minamino N, Matsuo H. A new natriuretic peptide in porcine brain.
Mukoyama M, Nakao K, Hosoda K, Suga S, Saito Y, Ogawa Y, Shirakami G, Jougasaki M, Obata K, Yasue H, Kambayashi Y, Inouye K, Imura H. Brain natriuretic peptide as a novel cardiac hormone in humans. Evidence for an exquisite dual natriuretic peptide system, atrial natriuretic peptide and brain natriuretic peptide.
Nakagawa O, Ogawa Y, Itoh H, Suga S, Komatsu Y, Kishimoto I, Nishino K, Yoshimasa T, Nakao K. Rapid transcriptional activation and early mRNA turnover of brain natriuretic peptide in cardiocyte hypertrophy. Evidence for brain natriuretic peptide as an ‘emergency’ cardiac hormone against ventricular overload.
Maeda K, Tsutamoto T, Wada A, Hisanaga T, Kinoshita M. Plasma brain natriuretic peptide as a biochemical marker of high left ventricular end-diastolic pressure in patients with symptomatic left ventricular dysfunction.
Yoshimura M, Yasue H, Okumura K, Ogawa H, Jougasaki M, Mukoyama M, Nakao K, Imura H. Different secretion patterns of atrial natriuretic peptide and brain natriuretic peptide in patients with congestive heart failure.
Sabatine MS, Morrow DA, de Lemos JA, Omland T, Desai MY, Tanasijevic M, Hall C, McCabe CH, Braunwald E. Acute changes in circulating natriuretic peptide levels in relation to myocardial ischemia.
Tsutamoto T, Wada A, Maeda K, Hisanaga T, Maeda Y, Fukai D, Ohnishi M, Sugimoto Y, Kinoshita M. Attenuation of compensation of endogenous cardiac natriuretic peptide system in chronic heart failure: prognostic role of plasma brain natriuretic peptide concentration in patients with chronic symptomatic left ventricular dysfunction.
McDonagh TA, Robb SD, Murdoch DR, Morton JJ, Ford I, Morrison CE, Tunstall-Pedoe H, McMurray JJ, Dargie HJ. Biochemical detection of left-ventricular systolic dysfunction.
Cowie MR, Struthers AD, Wood DA, Coats AJ, Thompson SG, Poole-Wilson PA, Sutton GC. Value of natriuretic peptides in assessment of patients with possible new heart failure in primary care.
Yamaguchi H, Yoshida J, Yamamoto K, Sakata Y, Mano T, Akehi N, Hori M, Lim YJ, Mishima M, Masuyama T. Elevation of plasma brain natriuretic peptide is a hallmark of diastolic heart failure independent of ventricular hypertrophy.
Yasue H, Yoshimura M, Sumida H, Kikuta K, Kugiyama K, Jougasaki M, Ogawa H, Okumura K, Mukoyama M, Nakao K. Localization and mechanism of secretion of B-type natriuretic peptide in comparison with those of A-type natriuretic peptide in normal subjects and patients with heart failure.
Sahn DJ, DeMaria A, Kisslo J, Weyman A. Recommendations regarding quantitation in M-mode echocardiography: results of a survey of echocardiographic measurements.
Devereux RB, Alonso DR, Lutas EM, Gottlieb GJ, Campo E, Sachs I, Reichek N. Echocardiographic assessment of left ventricular hypertrophy: comparison to necropsy findings.
Weiss JL, Frederiksen JW, Weisfeldt ML. Hemodynamic determinants of the time-course of fall in canine left ventricular pressure.
Leite-Moreira AF, Correia-Pinto J, Gillebert TC. Afterload induced changes in myocardial relaxation: a mechanism for diastolic dysfunction.
Esposito G, Santana LF, Dilly K, Cruz JD, Mao L, Lederer WJ, Rockman HA. Cellular and functional defects in a mouse model of heart failure.
Takaoka H, Esposito G, Mao L, Suga H, Rockman HA. Heart size-independent analysis of myocardial function in murine pressure overload hypertrophy.
Grossman W, Jones D, McLaurin LP. Wall stress and patterns of hypertrophy in the human left ventricle.
Mirsky I, Tajimi T, Peterson KL. The development of the entire end-systolic pressure–volume and ejection fraction-afterload relations: a new concept of systolic myocardial stiffness.
Hunt SA, Baker DW, Chin MH, Cinquegrani MP, Feldman AM, Francis GS, Ganiats TG, Goldstein S, Gregoratos G, Jessup ML, Noble RJ, Packer M, Silver MA, Stevenson LW, Gibbons RJ, Antman EM, Alpert JS, Faxon DP, Fuster V, Jacobs AK, Hiratzka LF, Russell RO, Smith SC Jr. American College of Cardiology/American Heart Association. ACC/AHA guidelines for the evaluation and management of chronic heart failure in the adult: executive summary. A report of the American College of Cardiology/American Heart Association Task Force on Practice Guidelines (Committee to revise the 1995 Guidelines for the Evaluation and Management of Heart Failure).
Mantymaa P, Vuolteenaho O, Marttila M, Ruskoaho H. Atrial stretch induces rapid increase in brain natriuretic peptide but not in atrial natriuretic peptide gene expression in vitro.
Liang F, Gardner DG. Mechanical strain activates BNP gene transcription through a p38/NF-kappaB-dependent mechanism.
Vanderheyden M, Goethals M, Verstreken S, De Bruyne B, Muller K, Van Schuerbeeck E, Bartunek J. Wall stress modulates brain natriuretic peptide production in pressure overload cardiomyopathy.
Yasumoto K, Takata M, Ueno H, Tomita S, Tomoda F, Inoue H. Relation of plasma brain and atrial natriuretic peptides to left ventricular geometric patterns in essential hypertension.
Qi W, Mathisen P, Kjekshus J, Simonsen S, Bjornerheim R, Endresen K, Hall C. Natriuretic peptides in patients with aortic stenosis.
Haug C, Metzele A, Kochs M, Hombach V, Grunert A. Plasma brain natriuretic peptide and atrial natriuretic peptide concentrations correlate with left ventricular end-diastolic pressure.
Conrad CH, Brooks WW, Hayes JA, Sen S, Robinson KG, Bing OH. Myocardial fibrosis and stiffness with hypertrophy and heart failure in the spontaneously hypertensive rat.
Yamamoto K, Masuyama T, Sakata Y, Nishikawa N, Mano T, Yoshida J, Miwa T, Sugawara M, Yamaguchi Y, Ookawara T, Suzuki K, Hori M. Myocardial stiffness is determined by ventricular fibrosis, but not by compensatory or excessive hypertrophy in hypertensive heart.
Ellmers LJ, Knowles JW, Kim HS, Smithies O, Maeda N, Cameron VA. Ventricular expression of natriuretic peptides in Npr1(−/−) mice with cardiac hypertrophy and fibrosis.

