


Abstract
Aims We tested the hypothesis that dyssynchrony of left ventricular (LV) myocardial deformation evaluated by ultrasound can predict success of cardiac resynchronization therapy (CRT) in patients with heart failure (HF).
Methods and results Thirty-seven patients with dilated cardiomyopathy, New York Heart Association class III–IV, LV ejection fraction (EF) ≤35%, QRS>120 ms were studied before, at pre-discharge, and after 3 and 6 months of CRT. The M-mode peak septal-to-posterior wall motion and thickening delay (SPWMD and SPWTD, ms) and the standard deviation of the averaged time-to-peak strain (TPS-SD, ms) of 12 middle and basal LV segments obtained from the three standard apical views were calculated. Responders were defined at month 6 by ≥20% EF increase and/or ≥15% end-systolic volume (ESV) decrease with respect to baseline. Baseline SPWTD (not SPWMD) and TPS-SD differentiated responders from non-responders with good accuracy and reproducibility. A value ≥194 ms for SPWTD and ≥60 ms for TPS-SD was significantly associated with responder identification. Baseline dyssynchrony parameters correlated significantly with EF (r=0.53 for SPWTD and r=0.86 for TPS-SD) and ESV variations (r=−0.42 for SPWTD and r=−0.73 for TPS-SD).
Conclusion Patients with chronic HF should undergo ultrasound evaluation to quantify dyssynchrony of LV myocardial deformation, which would help identifying CRT responders.
Introduction
Cardiac resynchronization therapy (CRT) has proven helpful in patients with heart failure (HF) and ventricular desynchronization. However, CRT is not a successful approach in all patients and clear recognition of responders to such treatment is still problematic. The ECG criteria, including the presence of left bundle branch block (LBBB) and QRS duration, are poor predictors because they might underestimate intraventricular dyssynchrony.1 Several ultrasound parameters based on conventional M-mode echocardiography and tissue Doppler techniques have been proposed to overcome the above limitations.2 However, current application of these techniques is conceptually limited in that both radial (by M-mode echo) and longitudinal wall motion (by tissue Doppler velocities) or displacement (by tissue tracking) cannot differentiate active from passive myocardial movements. CRT is expected to be successful in patients with dyssynchrony of active regional myocardial deformation as this is directly related to the left ventricular (LV) contractile function.3,4 We report results of the Evaluation of VEntricular Resynchronization by Biventricular Pacing (EVER-Pacing) Study that assesses whether dyssynchrony of LV regional myocardial deformation measured by ultrasound can be associated with CRT success in patients with HF.
Methods
Study population
We studied 37 patients with the following inclusion criteria: chronic HF (>6 weeks duration) refractory to optimal and maximally tolerated medical therapy (i.e. ACE-inhibitors, β-blockers, diuretics, and digoxin); New York Heart Association (NYHA) functional class III–IV; LV end-diastolic diameter (EDD) ≥3.0 cm/m2 and LV ejection fraction (EF) ≤35% by standard M-mode and B-mode echocardiography, respectively; sinus rhythm; age >18 years. The presence of LBBB with QRS duration >120 ms was not considered as an inclusion criterion. Exclusion criteria were (i) acute HF, (ii) the presence of a pacemaker or any indication for one, (iii) permanent atrial fibrillation, (iv) hypertrophic, restrictive, obstructive cardiomyopathy, (v) primitive and haemodynamically significant valve disease (defined as valvular stenosis greater than mild and/or primitive valvular regurgitation ≥3+/4+), (vi) previous valve replacement or reconstruction, (vii) constrictive pericarditis, (viiii) primitive pulmonary hypertension, (ix) uncorrected congenital heart disease, (x) patients candidate to heart surgery (heart transplantation not considered if time to transplant >6 months), (xi) acute myocardial infarct, unstable angina and stroke within 6 weeks prior the study enrollement, (xii) coronary artery bypass graft surgery within the previous 3 months, (xiii) patients with life expectation <1 year due to known concomitant disease unrelated to HF, (xiv) pregnancy, (xv) patient refusal to sign the informed consent form, (xvi) inability to perform a technically acceptable echocardiogram. At the moment of the study, no need for coronary revascularization procedures had to be present. The study was approved by the Ethics Committee and all patients gave written informed consent.
Protocol
Within 7 days before implantation of the biventricular pacemaker, all patients underwent the following evaluations: The above mentioned evaluations were repeated at pre-discharge, 3 and 6 months after the implantation. During the post-implantation period, care was taken to keep the drug treatment maximized, with the patients paced using the optimal VDD pacing mode and atrioventricular (AV) delay settings.
clinical examination;
exercise tolerance by the 6-minute walking test (6-MWT);
quality of life (QoL) by the Minnesota Living with HF questionnaire;
12-lead standard electrocardiography (ECG) with QRS duration measured as the maximum of leads II, V1, and V6 and PR (PQ) interval duration calculated as the longest one; the aspecific intraventricular conduction delay was considered as a prolongation of the QRS which was not associated with the typical features of bundle branch block;
echocardiographic examination. (a) Image acquisition: echocardiographic M-mode, B-mode, Doppler, and colour Doppler data acquisition were performed using a GE-Vingmed System 5 (n=2), Vivid 5 (n=1), or Vivid 7 (n=3) echo scanner, equipped with a 2.5 MHz probe. Briefly, after 10 min rest, standard parasternal short- and long-axis views as well as the standard three apical views of the LV were acquired in both grey-scale and tissue colour Doppler B-mode modality. Sector angle, depth, and Doppler pulse repetition frequency were optimized to obtain the highest possible frame rate (>100 fps) avoiding loss of spatial data and aliasing in the tissue Doppler modality. The standard colour Doppler examination was performed in the apical four- and two-chamber views for the study of mitral regurgitation (MR). The mitral valve pulsed Doppler examination was performed positioning the sample volume at the level of the valve tips in the apical four-chamber view. Also, the CW Doppler tracing of the MR was recorded in the apical four-chamber view. All grey-scale and colour Doppler B-mode images were acquired in a cine-loop format and stored in a magneto-optical device for subsequent analysis. (b) Measurements: LV size was evaluated measuring the EDD and calculating the end-diastolic and end-systolic volumes (EDV, ESV) using the biplane Simpson's rule. The EDD and ESV were indexed for body surface area. LV systolic function was evaluated using both the EF calculated from volumes and the Doppler dP/dt. MR severity was evaluated by: (1) the maximal regurgitant jet area visualized by colour Doppler in the apical four- and two-chamber views (the average value of the two views was calculated); (2) the duration of the CW Doppler tracing of the regurgitant flow.
Ultrasound evaluation of dyssynchrony
Dyssynchrony of myocardial deformation was evaluated both radially and longitudinally using the following parameters. Baseline SPWTD, SPWMD, and TPS-SD data were obtained by two skilled and independent observers, who were unaware of the patients' characteristics, including ECG data.
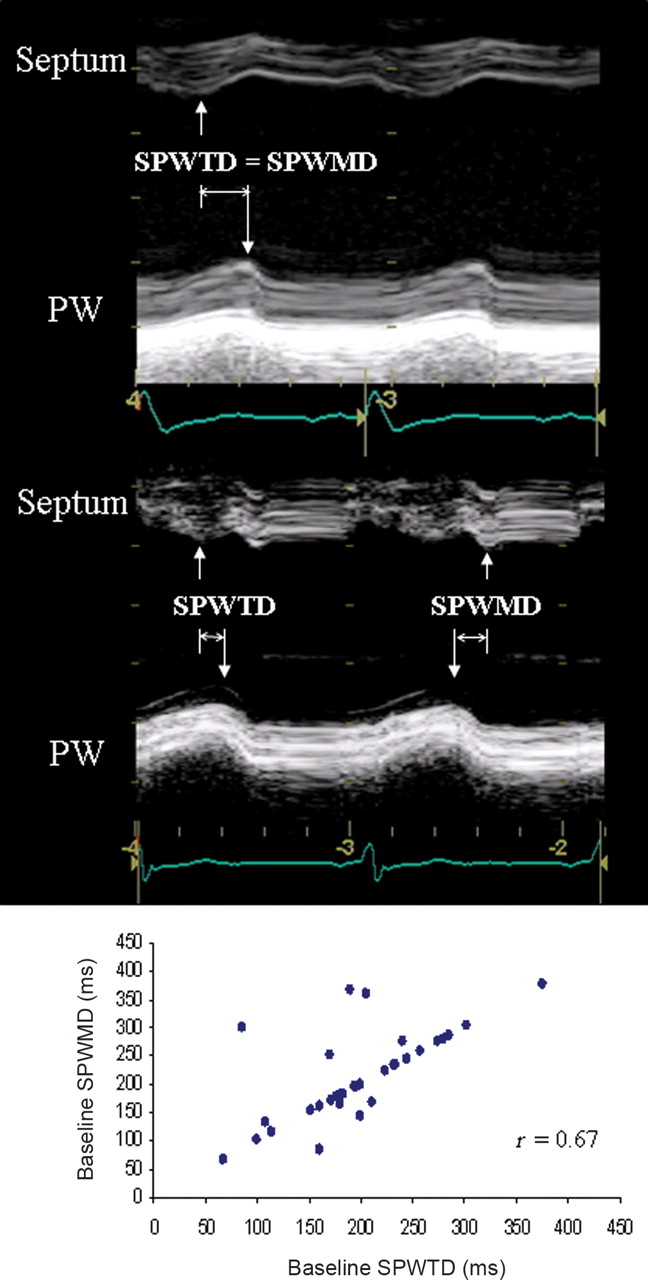
Septal-to-posterior wall thickening delay (SPWTD). Measurement of SPWTD was performed on the LV M-mode trace obtained in the parasternal short-axis view at the LV papillary muscle level as the time interval between the maximal thickening of the septum and the left posterior wall. Maximal wall thickening corresponds to peak radial strain; therefore, SPWTD can also be defined as the time delay between the peak radial strain of the two walls (Figure 1). We also measured on the same M-mode traces the septal-to-posterior wall motion delay (SPWMD) as the shortest time interval between the maximal posterior displacement of the septum and the posterior wall.5
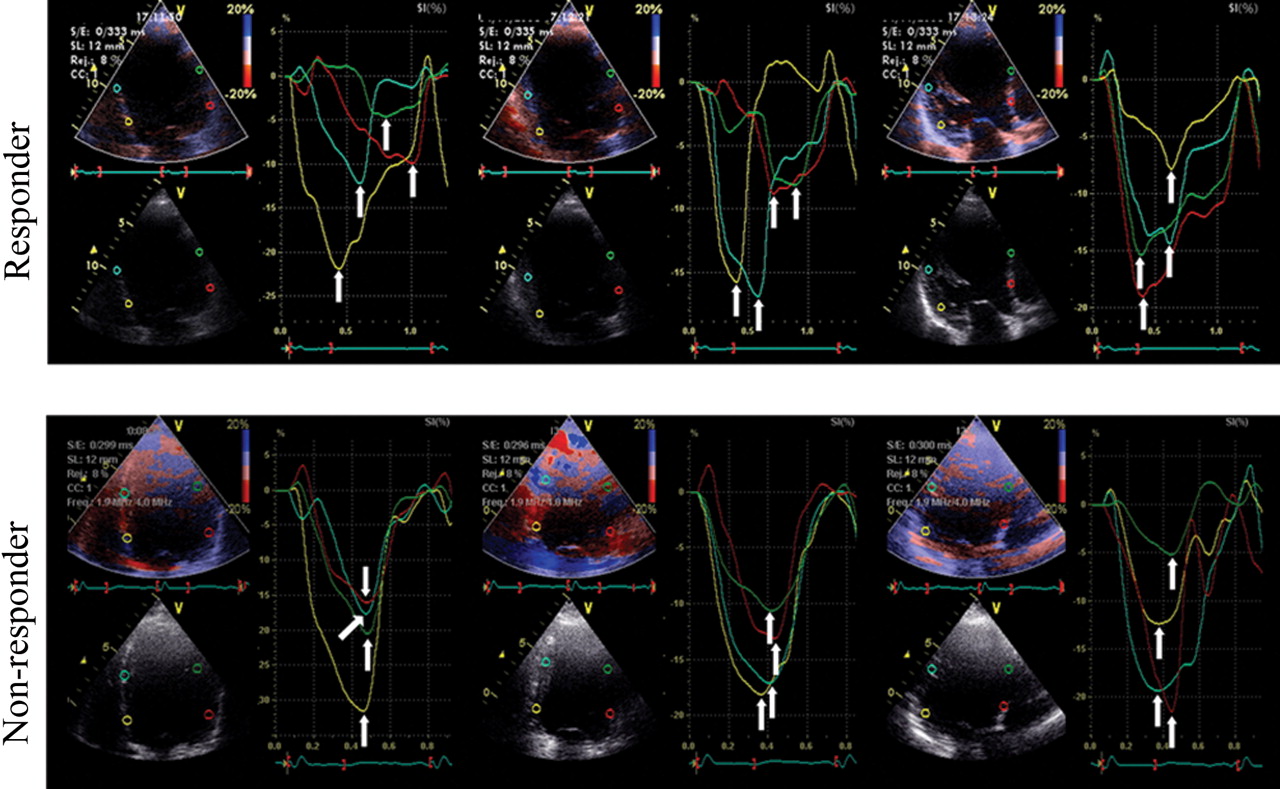
Time-to-peak strain standard deviation (TPS-SD). The regional longitudinal strain profiles were obtained using a validated tissue Doppler approach.3,6 Strain curves were extracted from the basal and mid-segments of each LV wall in the standard three apical views for a total of 12 segments. The cursor was positioned in the middle of each segment. The strain curve was used to define the TPS, measured on each curve from the beginning of the Q (or R)-wave on the ECG to the peak negative strain value, regardless of whether it was systolic or post-systolic. Values from the 12 LV segments were averaged to calculate TPS-SD. This parameter was used as an index of global dyssynchrony of myocardial longitudinal deformation of the LV (Figure 2).
SPWTD vs. SPWMD. Top: in this patient, SPWTD and SPWMD coincide (arrows). Middle: in this case, SPWTD and SPWMD do not coincide (arrows) due to a dissociation between maximal septal thickening and inward endocardial motion. Bottom: correlation between SPWTD and SPWMD. Although in most patients the values of these two parameters coincide, in 10 patients they are different.
Longitudinal myocardial deformation dyssynchrony illustrated by 12 time-to-peak negative strains (arrows) evaluated in the three standard apical views. In the responder patient, TPS values are disperse indicating a high level of dyssynchrony, whereas in the non-responder, they are very close to each other, indicating a low level of dyssynchrony.
Pacemaker implantation and optimization
The CRT device was implanted after coronary sinus angiography. A unipolar lead with an over-the-wire system (Easytrak, Guidant Inc.) was advanced into the venous system trying to reach the lateral or postero-lateral cardiac vein. The final position was determined on the basis of visual inspection by using the right and left anterior oblique views. The epicardial approach was used in the case of unsuccessful conventional implantation. The right atrium and ventricle were stimulated by positioning standard bipolar catheters in the right atrial appendage and right ventricular apex, respectively. Optimization of the AV delay was performed using Doppler echocardiography, interrogating transmitral flow with the sample volume at the tip of the mitral valve leaflets to obtain the best flow velocity profile. The device was first programmed to DDD mode with a lower rate of 40 bpm to ensure the patient's intrinsic rhythm. Subsequently, the sensed AV delay was programmed to 200 ms. In this setting, mitral valve closure is delayed to the end of the A-wave. The sensed AV interval was decreased in steps of 20 ms until the mitral valve Doppler signal caused truncation of the A-wave. Finally, the sensed AV interval was increased in steps of 10 ms to ensure that the mitral valve closure Doppler signal was synchronous with, or occurred shortly after, the end of the A-wave. AV delay optimization was performed at every follow-up visit.
Definition of CRT responders
Patients were classified as responders if at month 6 they were alive, the LV-EF increased by at least 20%, and/or the LV-ESV decreased by at least 15% with respect to baseline (variations were considered as relative values). Patients were defined non-responders if they died for cardiac causes or did not reach both the above pre-specified echocardiographic changes.
Endpoints
(i) Primary endpoint: association of baseline LV deformation dyssynchrony with CRT response (see definition above). (ii) Secondary endpoint: association of baseline LV deformation dyssynchrony with variation of EF and ESV. Both endpoints were defined at 6 months.
Statistical analysis
(i) Descriptive statistics: continuous variables were described as mean and SD or median and 25th–75th percentiles. Frequencies and percentages were calculated for categorical variables. Confidence intervals (at 95% level) for the relative changes in EF and ESV (used to define responders) were computed. (ii) Primary endpoint: the association of dyssynchrony parameters with CRT response was assessed by means of logistic regression models. The dyssynchrony parameters were considered as continuous variables and also dichotomized according to the median of their distribution. A sensitivity analysis was performed by classifying patients who dropped out or died for non-cardiac causes first in the responder and then in the non-responder group and by refitting the logistic models. (iii) Secondary endpoint: the association of dyssynchrony parameters on a continuous and categorical scale with the relative changes in EF and ESV was assessed by means of Pearson R and of Mann-Whitney U test, respectively. (iv) Baseline dyssynchrony: the correlation between the three baseline dyssynchrony parameters was assessed by means of Pearson R, with Bonferroni correction for multiple tests. The kappa statistic was computed to describe the agreement between the same parameters on the categorical scale. (v) Changes over time: a mixed general linear model was used with random intercept, to relax the conditional independence of responses in the same subject. An independent covariance matrix was utilized. Indicators for visits were used for the fixed part of the model. Post hoc comparisons between consecutive assessments were performed, with Bonferroni correction for multiple tests. (vi) Reproducibility: the Lin correlation coefficient (Rho) and the Bland–Altman limits of agreement (LOA) were used. (vii) Feasibility: it was evaluated as the percentage of the actually performed measures relative to the number of M-mode traces (for SPWTD) or strain curves (for TPS-SD) available for measurement. (viii) Power evaluation: it was performed according to the results of statistical analysis on the three dyssynchrony parameters dichotomized at their median value. The Stata 9 program (StataCorp, College Station) was used for computation. A two-sided P-value <0.05 was considered statistically significant.
Results
Sixty-nine consecutive patients with refractory HF and fully satisfying the inclusion criteria were initially considered for study. Thirty-two patients deemed ineligible due to the exclusion criteria, including refusal to participate in the study (n=2). Therefore, 37 patients (53%) were actually enrolled. All of them underwent the initial study examinations within 7 days before the pacemaker implantation and were subsequently implanted. The demographic, clinical, and ECG characteristics of the 37 patient population are shown in Table 1. Final positions of the leads are reported in Table 2: in 29 patients (78.4%), the lead was positioned in the mid or basal postero-lateral, lateral, or antero-lateral site. The LV pacing was obtained transvenously in 34 cases (92%). Three patients (8%) underwent epicardial LV lead positioning through a lateral thoracotomy approach due to lack of stable transvenous lead position (one case) or to first elective epicardial placement procedure (two cases) (Table 2). At the 3-month follow-up examination, two patients have died for cardiac and two for non-cardiac causes, and one patient refused to continue in the study; at 6-month follow-up assessment, one more patient have died for cardiac cause. No patient underwent percutaneous coronary intervention during the study.
Baseline characteristics of patients
| Age (years) | 68±8 |
| Males | 27 (73%) |
| Females | 10 (27%) |
| Height (cm) | 166.0±9.8 |
| Weight (kg) | 74.0±15.0 |
| BSA (m2) | 1.8±0.2 |
| SBP (mmHg) | 116±16 |
| DBP (mmHg) | 71 ± 9 |
| Hb (g/dL) | 13.2 ± 1.4 |
| NYHA class | |
| III | 32 (86%) |
| IV | 5 (14%) |
| HF aetiology | |
| Idiopathic | 20 (54%) |
| Ischaemic | 16 (43%) |
| Hypertensive | 1 (3%) |
| HF duration (years) | 4.4±3.7 |
| EDDi (cm/m2) | 3.8±0.6 |
| HR(bpm) | 71 ± 13 |
| PR interval (ms) | 202±40 |
| QRS duration (ms) | 161±24 |
| IVCD type | |
| LBBB | 34 (92%) |
| RBBB | 0 (0%) |
| Aspecific | 3 (8%) |
BSA, body surface area; SBP, systolic blood pressure; DBP, diastolic blood pressure; EDDi, indexed end-diastolic diameter; IVCD, interventricular conduction delay; RBBB, right bundle branch block. Mean±SD or number of patients (in absolute and percentage values) are reported.
Left ventricular catheter stimulation sites
| Transvenous stimulation site | Epicardial implant site | |||
|---|---|---|---|---|
| n | (%) | n | (%) | |
| Basal | ||||
| Lateral | 1 | 2.7 | ||
| Postero–lateral | 1 | 2.7 | ||
| Mid | ||||
| Anterior | 2 | 5.4 | ||
| Antero–lateral | 9 | 24.3 | ||
| Lateral | 10 | 27.0 | 1 | 2.7 |
| Postero–lateral | 5 | 13.5 | 2 | 5.4 |
| Posterior | 2 | 5.4 | ||
| Apical | ||||
| Anterior | 1 | 2.7 | ||
| Antero–lateral | 1 | 2.7 | ||
| Lateral | 2 | 5.4 | ||
| Total | 34 | 91.9 | 3 | 8.1 |
Responders and non-responders to CRT
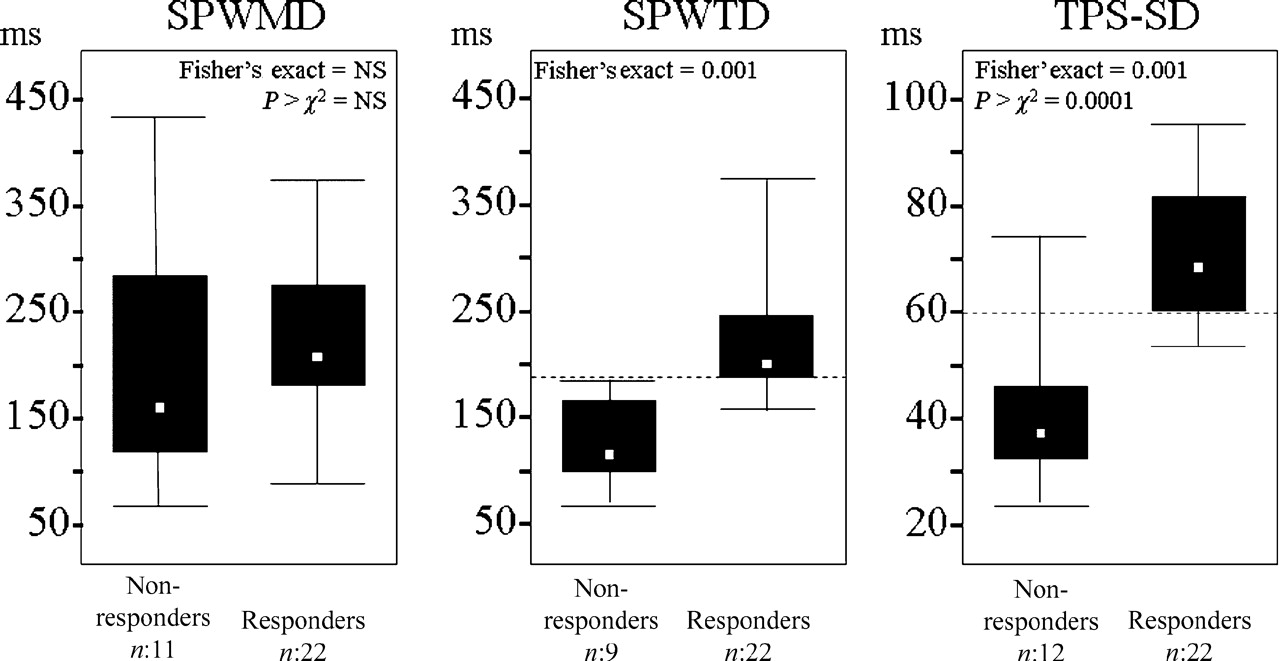
According to the response definition, 34 patients (91%) were evaluated for response to CRT: 22 (65%) were responders and 12 (35%) non-responders. Baseline deformation dyssynchrony evaluated by SPWTD and TPS-SD was significantly associated with CRT response at month 6 (Table 3). In particular, when the medians of the SPWTD and TPS-SD distributions were tested as cut-off values to separate responders from non-responders, a value ≥194 ms for SPWTD and ≥60 ms for TPS-SD were significantly associated with responder identification (Figure 3). Separation of responders from non-responders was possible with a power of 96% for SPWTD (odds ratio 111.6) and 98% for TPS-SD (odds ratio 29.1). For SPWMD, power was 16%. The sensitivity analysis showed no difference in CRT response when the three patients who dropped out of the study (the two who died for non-cardiac causes and the one who refused to go on) were included both in the responder and in the non-responder group (Table 3).
Separation of responders from non-responders by SPWMD, SPWTD, and TSP-SD. Only medians of SPWTD and TPS-SD distributions (represented as horizontal dashed lines) significantly separate responders from non-responders.
Association between baseline dyssynchrony parameters and CRT response at month 6
| Statistical models | Dyssynchrony parameters | ||
|---|---|---|---|
| SPWMD | SPWTD | TPS-SD | |
| Model A: dyssynchrony parameters as continuous variables | |||
| Overall patients | 33 | 31 | 34 |
| Responders | — | 22 | 22 |
| Non-responders | — | 9 | 12 |
| P>χ2 | 0.2796 | 0.0000 | 0.0000 |
| Odds ratio (95% CI) | 1.00 (0.99, 1.01) | 1.13 (1.00, 1.28) | 1.19 (1.06, 1.36) |
| Model B: dyssynchrony parameters dicothomized based on the median of their distribution | |||
| Overall patients | 33 | 31 | 34 |
| Responders | — | 22 | 22 |
| Non-responders | — | 9 | 12 |
| Two-sided Fisher's exact | 0.465 | 0.001 | 0.001 |
| P>χ2 | 0.3221 | a | 0.0001 |
| Odds ratio (95% CI) | 2.2 (0.47, 9.29) | 29.33 (3.09, 278.77) | |
| Sensitivity analysis I: The three excluded patients are included in the non-responder group | |||
| Overall patients | 36 | 33 | 37 |
| Responders | — | 22 | 22 |
| Non-responders | — | 11 | 15 |
| Two-sided Fisher's exact | 0.733 | 0.026 | 0.001 |
| P>χ2 | 0.4936 | 0.0111 | 0.0002 |
| Odds ratio (95% CI) | 1.6 (0.41, 6.17) | 7.87 (1.35, 45.83) | 17.33 (2.98, 100.72) |
| Sensitivity analysis II: the three excluded patients are included in the responder group | |||
| Overall patients | 36 | 33 | 37 |
| Responders | — | 24 | 25 |
| Non-responders | — | 9 | 12 |
| Two-sided Fisher's exact | 0.471 | 0.001 | 0.001 |
| P>χ2 | 0.2754 | a | 0.0003 |
| Odds ratio (95% CI) | 2.23 (0.52, 9.59) | 23.37 (2.55, 213.65) | |
aLogistic model not applicable due to optimal separation of responders from non responders.
Baseline dyssynchrony and LV-EF and LV-ESV changes
Baseline deformation dyssynchrony by SPWTD and TPS-SD was significantly associated with LV-EF and LV-ESV variation after 6 months of CRT (Figure 4). This association was better for TPS-SD. Similar results were obtained when baseline dyssynchrony parameters were considered on a categorical scale: in fact, a significant association with the 6-month LV-EF and LV-ESV variation was observed for both SPWTD (z=−2.630, P=0.0085 and z=2.413, P=0.0158, respectively) and TPS-SD (z=−4.680, P=0.0000 and z=3.768, P=0.0002, respectively), not for SPWMD (z=−0.348, P=0.7278 and z=−0.127, P=0.8993, respectively).
Association between baseline dyssynchrony evaluated by SPWMD, SPWTD, and TPS-SD with LV-EF and LV-ESV variations after 6 months of CRT. Only baseline SPWTD and TPS-SD values were significantly associated with LV-EF and ESV variations.
Characterization of baseline ultrasound dyssynchrony
At baseline, SPWMD showed a correlation coefficient of 0.67 (P=0.0001, Figure 1) and a k-value of 0.64 with SPWTD, whereas there was no correlation with TPS-SD (r=0.04, P=1.0) with a k-value of 0.11. SPWTD and TPS-SD had a correlation coefficient of 0.58 (P=0.0012) and a k-value of 0.45.
Changes over time
Results are reported in Table 4. In the overall population, at pre-discharge, LV-EDV did not change, whereas ESV and EF improved. This improvement occurred with a simultaneous redistribution of TPS within the LV (Figure 5): in fact, TPS reduced at the basal postero-lateral wall and prolonged at the basal inferior septum, therefore inducing a more homogeneous distribution of peak strain delays. At 3 and 6 months, LV-EDV, ESV, EF, dP/dt, MR duration and area, NYHA class, 6-MWT, and QoL improved. Deformation dyssynchrony parameters progressively reduced. Heart rate (HR) did not vary during the study.
TPS delays of the 12 mid- and basal-segments of the left ventricle. Top: mean values of TPS delays are shown before pacemaker implantation (grey bars) and at pre-discharge (black bars). Bottom: the absolute variation of TPS delays is shown. Note that the maximal variation occurs at the level of the basal inferior septum (bIS) (peak strain anticipates=positive bar) and of the basal posterior and lateral wall (bPW, bLW) (peak strain occurs later=negative bars). AW, anterior wall; IW, inferior wall; AS, anterior septum; b, basal; m, medium.
Clinical, haemodynamic, ECG, and ultrasound dyssynchrony parameters at baseline, pre-discharge, 3 and 6 months of CRT
| Parameter | Baseline | Pre-discharge | 3 months | 6 months | |||
|---|---|---|---|---|---|---|---|
| Mean±SD | Mean±SD | P-value | Mean±SD | P-value | Mean±SD | P-value | |
| NYHA class | 3.1±0.3 | 2.9±0.6 | 0.057 | 2.2±0.6 | 0.000a | 2.1±0.7 | 0.000a |
| 0.003b | 0.192b | ||||||
| 6-MWT (m) | 281±110 | 320±129 | 0.177 | 370±134 | 0.000a | 406±102 | 0.000a |
| 0.003b | 0.192b | ||||||
| QoL score | 55±20 | 49±23 | 0.273 | 23±18 | 0.000a | 24±19 | 0.000a |
| 0.000b | 2.949b | ||||||
| EDV (mL) | 250±68 | 247±68 | 1.731 | 234±62 | 0.000a | 226±64 | 0.000a |
| 0.000b | 0.120b | ||||||
| ESV (mL) | 190±58 | 174±55 | 0.000 | 158±48 | 0.000a | 150±52 | 0.000a |
| 0.000b | 0.129b | ||||||
| EF (%) | 25±5 | 30±6 | 0.000 | 33±7 | 0.000a | 35±7 | 0.000a |
| 0.009b | 0.243b | ||||||
| dP/dt (mmHg/s) | 544±94 | 666±143 | 0.000 | 703±153 | 0.000a | 717±158 | 0.000a |
| 0.882b | 1.059b | ||||||
| MR duration (ms) | 439±137 | 405±127 | 0.003 | 392±134 | 0.003a | 398±136 | 0.003a |
| 1.038b | 1.314b | ||||||
| MR area (cm2) | 7.8±5.0 | 6.2±4.8 | 0.012 | 6.0±4.5 | 0.003a | 4.5±4.4 | 0.001a |
| 1.293b | 0.240b | ||||||
| Heart rate (bpm) | 71±13 | 74±12 | 0.708 | 72±14 | 2.358a | 72±9 | 2.967a |
| 1.194b | 2.415b | ||||||
| PR duration (ms) | 202±40 | 136±34 | 0.000 | 128±25 | 0.000a | 127±17 | 0.000a |
| 0.888b | 2.667b | ||||||
| QRS duration (ms) | 161±24 | 140±28 | 0.000 | 137±20 | 0.000a | 127±20 | 0.000a |
| 2.349b | 0.204b | ||||||
| SPWMD (ms) | 213±101 | 119±115 | 0.000 | 76±122 | 0.000a | 63±126 | 0.000a |
| 0.534b | 0.804b | ||||||
| SPWTD (ms) | 198±65 | 93±84 | 0.000 | 55±65 | 0.000a | 54±85 | 0.000a |
| 0.138b | 1.401b | ||||||
| TPS-SD (ms) | 60±19 | 45±10 | 0.000 | 45±7 | 0.000a | 43±11 | 0.000a |
| 2.733b | 1.440b | ||||||
avs. baseline values.
bvs. previous evaluation.
Reproducibility and feasibility of ultrasound dyssynchrony parameters
Intra-observer variability: for SPWTD, Rho=0.97, LOA= −10.9, 12.7 ms; for TPS-SD, Rho=0.99, LOA=−5.4, 5.4 ms. Interobsever variability: for SPWTD, Rho=0.99, LOA=−13.4, 14.4 ms; for TPS-SD, Rho=0.97, LOA= −8.8, 7.8 ms. Feasibility of SPWTD was lower compared with TPS-SD (87 vs. 97%), whereas TPS-SD calculation was more time consuming (8 vs. 2 min in average).
Discussion
This study shows that baseline dis-co-ordination of LV regional myocardial deformation identifies HF patients who are responders to CRT and is also associated with improvement of LV-EF and reduction of LV remodelling after 6 months of treatment.
Ultrasound evaluation of myocardial deformation dyssynchrony
(i) SPWTD vs. TPS-SD: both these parameters identified CRT responders in our study but TPS-SD showed a higher level of accuracy. Conceptual and methodological differences can explain the superiority of TPS-SD to predict CRT response. First, although both SPWTD and TPS-SD measure regional myocardial strain delays, different aspects of mechanical dyssynchrony are actually explored: a delay in radial contraction and in longitudinal shortening, respectively. In addition, SPWTD reflects contraction of only two opposite myocardial walls (septum and posterior wall), whereas TPS-SD is calculated taking into account 12 myocardial segments, thus providing a more comprehensive evaluation of the deformation dyssynchrony within the LV. These differences may explain the moderate agreement between baseline SPWTD and TPS-SD (r=0.58, k=0.45).
Other differences between SPWTD and TPS-SD are (a) SPWTD can be calculated by conventional standard M-mode echocardiography, without additional software or instrumentation, whereas TPS-SD calculation requires tissue Doppler imaging for myocardial velocity data acquisition and extraction of the strain curves; (b) SPWTD has a lower feasibility than TPS-SD (87 vs. 97%) because in some patients septal myocardial thickening cannot be recognized, especially when the septum is highly fibrotic with no residual contractility; (c) the lack of longitudinal shortening in a septal segment does not prevent from calculation of TPS-SD, which is based on multiple longitudinal myocardial time delays vs. a single radial strain interval delay measurement as for SPWTD.
(ii) SPWMD vs. SPWTD: different results have been obtained using these two parameters, which may not necessarily coincide in dilated and dysfunctioning LVs. SPWTD is based on the measurement of time to maximal wall thickening (or radial strain), which indicates active myocardial contraction; conversely, SPWMD takes into account the time to maximal endocardial inward motion, which can be passive or active. Although time to maximal inward endocardial motion coincided with time to peak radial strain in most of our patients, in some cases (10 patients, 27%), a dissociation between these two mechanical phenomena occurred determining a correlation coefficient of 0.67 (Figure 1). This can explain, at least in part, why SPWTD predicted CRT response, whereas SPWMD did not. As a consequence, time to maximal thickening (not motion) should be measured when applying the M-mode approach for evaluation of LV dyssynchrony.
Identification of responders
In this paper, two echocardiographic parameters have been used to evaluate the response to CRT: LV-EF and ESV. The EF was selected as an index of LV systolic function because of its widespread use in both clinical studies and routine practice. A cut-off of at least 20% increase of the baseline value was chosen to identify a significant EF variation after 6 months of CRT. This value, in fact, is above the range of error of the echocardiographic EF measure performed in the second harmonic imaging modality.7 The LV-ESV was selected as an index of LV remodelling according to the literature data defining significant reverse remodelling as a reduction of ESV >15% from baseline value.5,8 Both LV-EF and ESV were considered in this study to account for the complex chronic response to CRT, which involves LV systolic function as well as LV remodelling.
Longitudinal strain vs. strain rate dyssynchrony
In our study, we selected myocardial strain dis-co-ordination instead of strain rate based on the very low reproducibility of Doppler strain rate parameters. Yu et al.8 showed that peak myocardial strain rate delays are worse than peak velocity delays for evaluating ventricular dyssynchrony: this is probably related to the more difficult interpretation of the strain rate curves obtained with the Doppler technique due to a large amount of noise. Evaluation of strain curves overcomes this technical limitation because feasibility and reproducibility of TPS-SD are acceptable, due to the lack of significant noise in most strain curves.6
Pathophysiology of myocardial deformation dyssynchrony
Dyssynchrony of regional myocardial deformation is a pathophysiologically significant target for CRT.
It has already been shown that short-term CRT leads to a redistribution of LV longitudinal myocardial deformation.6 The early passive systolic elongation of the lateral wall observed in most patients with LBBB is virtually eliminated by CRT, which determines an earlier active contraction of this wall.6 As a consequence, during CRT, the lateral wall contracts against a lower afterload, whereas septum contraction occurs with an optimized local pre-load, generating a higher ejection septal force. Therefore, myocardial wall stress distributes more homogeneously, a more efficient contraction of the whole LV occurs, and a synchronous motion of the papillary muscles reduces systolic mitral insufficiency.9 The reversal of the septal–lateral strain relationship observed with CRT6 is confirmed in our study population. As shown in Figure 5, CRT causes acute redistribution of myocardial peak longitudinal strain delays: the paced basal postero-lateral wall reaches its peak longitudinal strain earlier than before pacing, whereas the basal inferior septum reaches its peak longitudinal strain later, thereby indicating a resynchronizing effect of CRT on peak regional myocardial deformation.
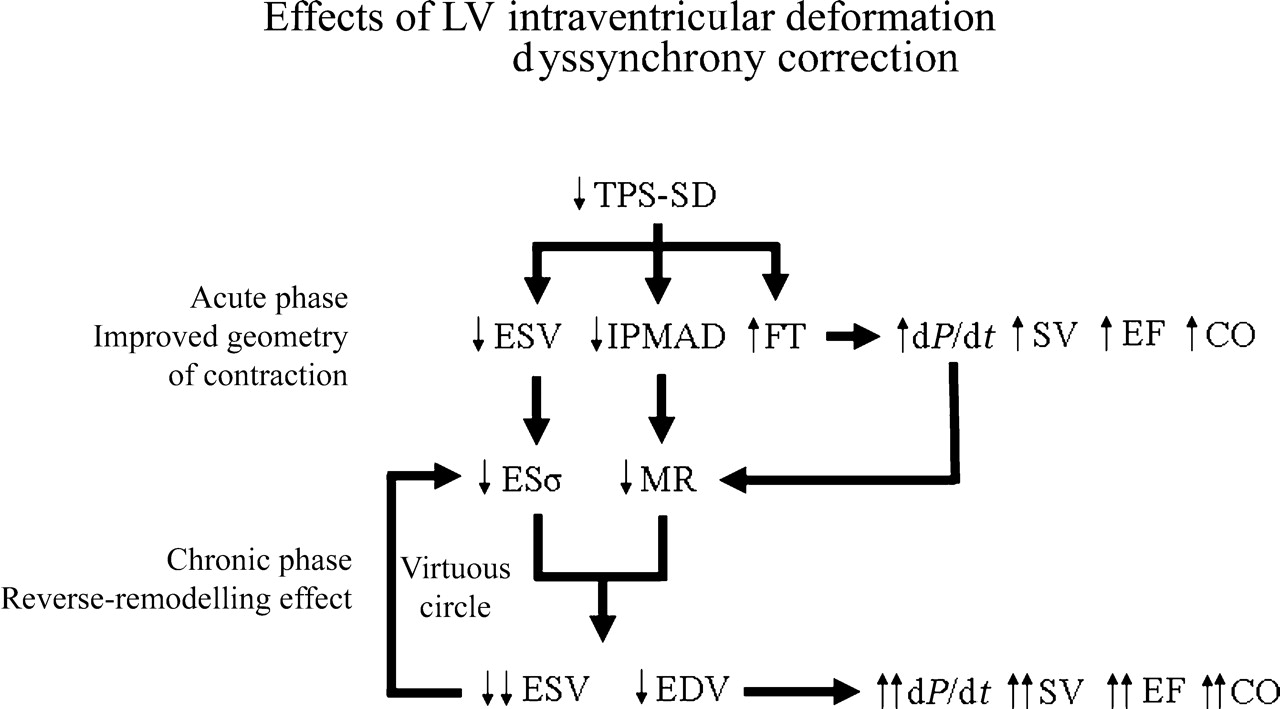
All the observations above confirm the strong pathophysiological rationale of using dis-co-ordination of time-to-peak myocardial deformation for evaluation of LV dyssynchrony and prediction of CRT response. This allows us to hypothesize that the acute LV-ESV reduction obtained by CRT is mainly due to an improved geometry of contraction, which is strictly dependent on pacing (Figure 6); subsequently, a true reverse remodelling occurs, which is a biological phenomenon very likely sustained by a chronic reduction of end-systolic stress and MR, and becomes relatively independent of pacing (Figure 6). In fact, as shown by others,10 when pacing is switched off after 3 months of CRT, the LV-ESV remains stable and LV remodelling restarts only after 1 month of CRT interruption. Functional parameters, however, such as dP/dt, do behave differently, indicating the dependence from the improved geometry of contraction by pacing at any time. Other mechanisms should also be considered to explain CRT benefits, such as AV and VV optimization, whereas the effect of interventricular dyssynchrony correction remains unclear.5,11
Effects of LV intraventricular deformation dyssynchrony correction. Acutely TPS-SD reduction causes improved geometry of contraction, with decrease of LV-ESV and inter-papillary muscle activation delay (IPMAD) and increase of LV filling time (FT). These effects, in turn, improve systolic function indexes and particularly dP/dt, which also reduces MR. LV-ESV reduction decreases the LV end-systolic stress (ESσ), which chronically favours LV inverse remodelling activating a virtuous circle. This leads to a true anti-remodelling effect. SV, stroke volume; CO, cardiac output.
Limitations and future perspectives
(i) This is a pilot longitudinal study showing the value of LV regional myocardial deformation dyssynchrony in predicting response to CRT. Although the number of patients is small, the power analysis performed retrospectively shows that the power of SPWTD and TPS-SD to separate responders from non-responders is very high (96 and 98%, respectively), therefore supporting the results of the study. (ii) Most of our patients had a LBBB. Whether similar results can be obtained in patients with dilated HF and no LBBB remains to be demonstrated. (iii) Only patients with sinus rhythm were enrolled. Therefore, our results cannot be directly translated to patients with HF and atrial fibrillation. In these patients, evaluation of dyssynchrony indexes can be difficult, especially when HR variability is high. (iv) Because of the sample size, no comparison was made between the ischaemic and non-ischaemic-dilated cardiomyopathies. (v) Although the AV interval was systematically optimized in our patients, the VV interval was not taken into account, as there are no clear guidelines on how to perform such an optimization despite studies have been published addressing this issue.12 (vi) Passive pre-stretch of a myocardial segment by an externally applied force may increase the stored elastic energy of the segment. Such energy may then lead to passive shortening, depending on the regional loading conditions. Under these circumstances, the presence of late systolic shortening, as identified by a negative strain, does not necessarily indicate active contraction but may also be due to passive elastic recoil.6 (vii) Although the M-mode approach was used in our paper for evaluation of radial peak strain delays, the TDI technique can also be used for this purpose.13
Conclusions
This study suggests that patients with chronic refractory HF and LBBB should undergo ultrasound evaluation to identify and quantify LV regional myocardial deformation dyssynchrony, which would contribute to selection of CRT responders.
Acknowledgements
We thank Giovanni Parrinello (University of Brescia, Italy) for his helpful suggestions. This study was supported by Guidant, Italy.
Conflict of interest: L.S. is a Guidant employee.

