


Abstract
Aims The CARTO TM electrophysiological mapping system has demonstrated accurate results for end-diastolic ventricular volumes in casts and animals. However, in humans, a comparison with cardiac magnetic resonance (CMR), the non-invasive gold standard for volumetric analysis, has not yet been performed.
Methods and results A total of 34 (29 male) heart failure patients (NYHA class III/IV) underwent an electrophysiological mapping procedure with the CARTO system in the left ventricle (LV) ( n =34) and right ventricle (RV) ( n =12) and CMR for RV and LV end-diastolic volume (RVEDV and LVEDV) measurements another day. Mean LVEDV was comparable between CMR and CARTO (328±95 and 320±92 mL, respectively; P =NS), whereas RV volumes measured by CARTO were larger (CMR 140±48 vs. CARTO 176±47 mL; P <0.01). Overall, we found a good correlation between CMR and CARTO measurements for both chambers; however, the Bland–Altman analysis showed a non-interchangeability of these methods. Measurement differences were independent of chamber size, but significantly affected by the number of acquired mapping points.
Conclusion Although CMR and CARTO showed a good correlation in the measurement of RVEDV and LVEDV in a group of heart failure patients, the clinical interchangeability of the two methods may be questioned.
Introduction
Recently, a new non-fluoroscopic three-dimensional electrophysiological mapping technique has been introduced (CARTO TM ), 1 which also allows calculation of end-diastolic chamber volumes. At the end of a mapping procedure, in which endocavitary points of all ventricular regions have been sampled, a three-dimensional model of the ventricular geometry with superimposed electrical activation maps can accurately be reconstructed. From this, a computer algorithm directly calculates end-diastolic ventricular volumes.
Although studies in animals (comparison of stroke volume assessed with CARTO and thermodilution) and ventricular casts have shown it to be accurate, 2–5 a comparison with cardiac magnetic resonance (CMR), the current non-invasive gold standard for volumetric analysis, has not so far been performed in humans.
Methods
A total of 34 congestive heart failure patients (29 male, NYHA class III/IV, mean LV ejection fraction of 21% measured by CMR) screened for cardiac resynchronization therapy underwent an electrophysiological mapping procedure with the CARTO system in the left ventricle (LV) ( n =34) and right ventricle (RV) ( n =12). In addition, a CMR study for volumetric analysis of both ventricles was performed. The mean time interval between the two examinations was 2 days (median 1 day). Twenty-nine per cent of patients had known coronary artery disease with previous myocardial infarction.
In all patients, the electrophysiological study was performed for clinical reasons. The protocol for the additional magnetic resonance scan was approved by the locally appointed ethics committee and all patients signed an informed consent before the magnetic resonance scan. The study complies with the Declaration of Helsinki.
Electrophysiological mapping procedure (CARTO)
The mapping procedure has been described in detail elsewhere. 1 , 5 , 6–9 In brief, the CARTO system, as its closely related electromechanical mapping modality (NOGA TM ) from the same vendor (Biosense-Webster, Diamond Bar, CA, USA), uses electromagnetic real-time technology to determine the location and orientation of a 7F steerable catheter (STAR TM ). By the induction of a low magnetic field (10 −6 –10 −5 T) and by the use of a reference catheter that is placed on the patient's back, a precise catheter tip location (with an accuracy of <1 mm) 2 can be determined.
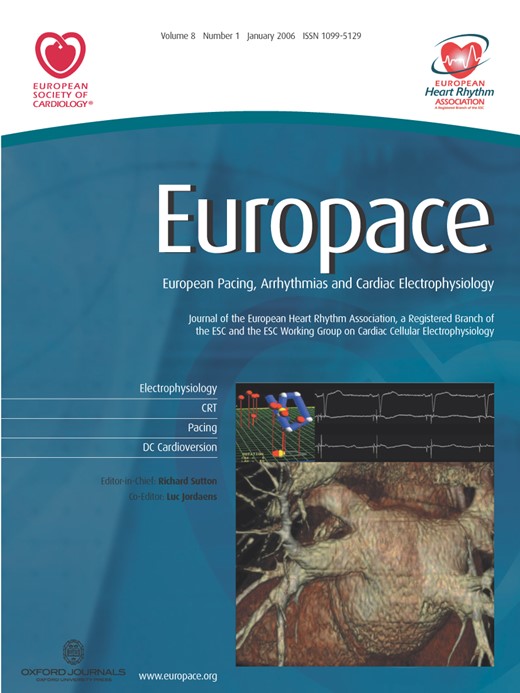
The mapping procedure is based on dragging the catheter on the endocardium and sequentially acquiring the location of the tip while in stable contact with the endocardium at end-diastole (peak of QRS complex). Then, from a large number of sampled points, the chamber geometry is reconstructed with a modified Powell algorithm, from which the volume is automatically calculated and presented to the user. In our study, a triangle fill threshold of 10 mm was chosen. This setting allows the system to fill triangles between acquired points with an interpolation algorithm, so that distances between points larger than 10 mm away from each other were left blank until points in between were sampled. For the LV, the apex and the mitral and aortic valves were located under fluoroscopic guidance to serve as reference points. A representative three-dimensional model of end-diastolic left and right chamber geometry is shown in Figure 1 .
Exemplary three-dimensional models of the LV and RV with CMR (left) and CARTO (right) in a patient with dilated cardiomyopathy.
CMR scan
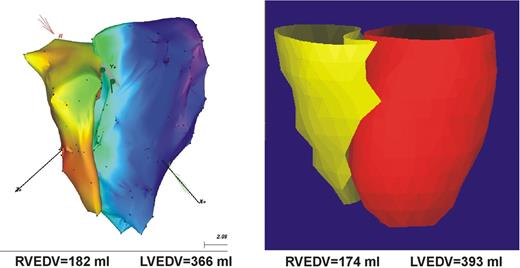
All subjects were imaged on a Signa NVi 1.5 Tesla scanner (General Electrics, Minnesota, USA), using a phased array cardiac surface coil and prospective electrocardiographic triggering. All scans were performed by a single expert operator. Axial scout images were used to obtain a vertical long-axis cine by aligning LV apex with the centre of the mitral valve ( Figure 2 ). From the vertical long-axis image, the horizontal long-axis plane was aligned through the midpoint of the LV apex and the mitral valve. A diastolic image at end-expiration provided the reference image on which a stack of contiguous short-axis slices was positioned, with the first slice positioned at the atrioventricular (AV) ring, and the last slice covering the apex. Segmented spoiled gradient echo breath-hold cines were used for all slices with the following parameters: echo time (TE)=4.4 ms, repeat time (TR)=8.0 ms, slice thickness 10 mm, rectangular field of view 38×28 cm 2 , read matrix 256, phase matrix 160, frames 20, flip angle 15°, views per segment 8–14. A total of 10–13 short-axis segments were needed to encompass the entire LV.
Acquisition of magnetic resonance scan planes and tracing of endocardial borders of the LV (red) and RV (yellow) in an end-diastolic short-axis plane for analysis of LVEDV and RVEDV.
Image analysis
CMR image analysis was performed by a single experienced investigator on a workstation by using commercial software (MASS analysis software, MEDIS. Leiden, the Netherlands). Manual tracing of RV and LV endocardial borders of contiguous short-axis slices at end-diastole (first cine phase of the R-wave triggered acquisition) allowed calculation of LVEDV and RVEDV. 10 Papillary muscles were included in the mass and excluded from the volume.
Ventricular volumes were directly calculated by the CARTO system using an integrated computer algorithm.
Statistical analysis
Data are presented as mean±standard deviation. Statistical significance of group means was assessed by unpaired Student t -tests. Linear regression analysis was performed to determine the strength of correlation between the chamber volumes obtained by cine MR imaging and those obtained by CARTO. A Bland–Altman analysis was used to determine the 95% limits of agreement between the two methods. 11 Although scatter plots and correlation coefficients (reported as R2 and calculated with a Pearson test) are shown, these are a measure of the linearity of the relation between two variables and do not indicate the strength of agreement between techniques, for which Bland–Altman plots are more appropriate. 11 For all statistical analysis, a P -value <0.05 was considered statistically significant.
Results
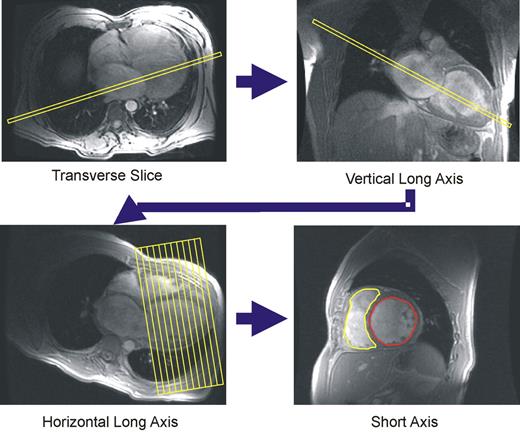
No procedural complications were noted during the CARTO procedure. A mean of 185 mapping points was sampled for the LV vs. 118 points for the RV ( P <0.001). Mean LVEDV was comparable between CMR and CARTO (328±95 and 320±92 mL, respectively; P =NS), whereas RV volumes tended to measure lower with CMR than with CARTO (176±47 vs. 140±48 mL; P <0.01). Figure 3 shows the scatter plots of end-diastolic volumes for the LV and RV measured by CMR and CARTO. R2 -values were 0.75 ( P <0.001) for the LV and 0.53 ( P <0.01) for the RV. Although this method of comparison does not provide a correct interpretation of the data, 11 the figures give an idea of the general correlation between the two methods. The mean difference between CMR and CARTO amounted to 8.3±48.2 mL (2.3±16.3%) for the LV and −36.3±34.9 mL (−24.4±23.1%) for the RV. Bland–Altman plots showing 95% limits of agreement are displayed in Figure 4 . There was a considerable scatter in the results both for the RV and LV; however, measurement differences were independent of chamber size. In contrast, at least for the LV, measurement differences were larger with a smaller number of CARTO mapping points ( Figure 5 ).
Scatter plots of LVEDV (left) and RVEDV measurements (right) by CMR vs. CARTO. Regression lines (solid line) and lines of equality (dashed line) are shown.
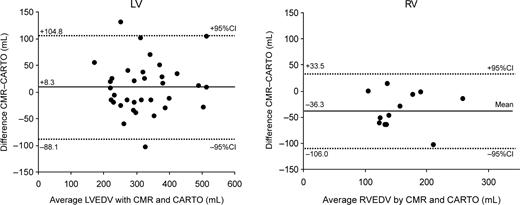
Bland–Altman plots showing 95% limits of agreement (dashed lines) between CMR and CARTO for calculation of LVEDV (left) and RVEDV (right). Mean difference between measurements (solid line) is also shown.
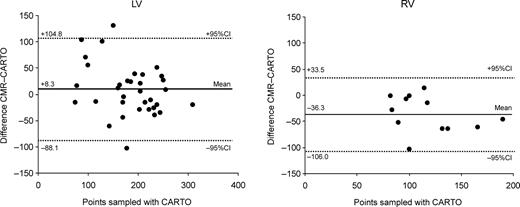
Bland–Altman plots showing the difference between CMR and CARTO for calculation of LVEDV (left) and RVEDV (right) independent of the sample points taken. Dashed lines show 95% limits of agreement.
Discussion
Our study presents the first comparison of the CARTO system with CMR, the current non-invasive gold standard for volumetric analysis, in a clinical setting in a group of congestive heart failure patients. As a matter of course, the accurate calculation of RVEDV and LVEDV does not present the main goal of an invasive electrophysiological study. However, if these parameters can be easily calculated from the reconstructed ventricular model, the operator should be aware of how these values correlate and compare with the current clinical gold standard in the ventricular volumetry. Furthermore, they should also be considered when merging of CMR and CARTO images will be applied in the future.
Three-dimensional mapping modalities such as CARTO and NOGA have earlier been shown to be accurate in ventricular casts and in in vitro models. 2–5 However, the results were obtained in a laboratory setting by use of relatively small volumes (cast volumes of 83 3 , 4 and 150 mL, 4 six pig casts measuring 22–56 mL 4 ). Previously, there have been few reports comparing this electroanatomical mapping technique with echocardiography or contrast ventriculography either in animals or in humans. In an animal study in 12 pigs, Gepstein 5 could demonstrate a good correlation between stroke volumes assessed by electromechanical mapping in comparison with thermodilution measurements (average deviation 8.1±2.2%). In addition, inter- and intraobserver variations for end-diastolic volumes were found to be relatively small (5.9±1.7 and 8.0±1.5%, respectively). Van Langenhove 12 compared LVEDV and end-systolic volumes measured by NOGA with corresponding values of a contrast LV angiogram, obtained in 44 patients during the same invasive session. Although a significant correlation for end-systolic volumes ( r =0.67, R2 =0.45; P <0.001) was demonstrated, values for LVEDV differed greatly between the two methods investigated. Moreover, a Bland–Altman analysis showed the clinical non-interchangeability between these techniques for all parameters under investigation.
Two-dimensional techniques such as echocardiography and angiography are based on geometric assumptions that are especially limited with distorted and spherical ventricular anatomy such as in ischaemic or dilated cardiomyopathy and also in the RV. In contrast, both CARTO and CMR provide three-dimensional data sets that should lead to a more accurate volume analysis.
Although our data showed a correlation between the two methods for measuring end-diastolic chamber volumes, the correlation coefficient is by no means a measure of agreement of methods. 11 The Bland–Altman analysis in Figure 4 illustrates clearly that the scatter of differences was disappointingly high for both LV and RV measurements and therefore CMR and CARTO are not clinically interchangeable with regard to volume calculations.
Several reasons may be responsible for this result. First, there is no certainty that at the end of a mapping procedure all endocardial areas have been satisfactorily covered. As the reconstruction process relies on the number and extent of points collected by the mapping catheter, this can lead to an underestimation of volumes, if not all ventricular regions have been covered during the mapping procedure. Inability to collect data points from specific areas in the ventricles may result from user variation or the mechanical relations between the catheter and the geometry of the chamber. This particularly includes potential failure to include all of the basal and outflow tract portions of the ventricles up to the valve planes. On the basis of an animal model, Gepstein 5 proposed that volume measurements can be accurately performed after acquisition of 40 points. As Figure 5 illustrates, at least for the dilated LV in heart failure patients, differences between the two methods decreased with an increasing number of points sampled. When more than 180 points for the LV had been sampled, the absolute difference in LV volumes was not larger than ∼50 mL. Thus, from our data, we conclude that, especially in large and distorted ventricles (e.g. ischaemic/dilated cardiomyopathy as in our study group), a much larger number of points are needed. This may also apply to the not-straightforward-shaped RV.
We used a reference catheter positioned outside the body. Although this approach may eliminate the problem of movement of the reference catheter and corrects for patient movement throughout the study, it may only partially compensate for respiration. 9 As measurements are obtained during free breathing, different measurement sites that may move to varying degrees with respiration will be sampled during different portions of the respiratory cycle. Therefore, the effective spatial resolution for endocardial sites with respect to one another is >1 mm nominal value. However, measurement errors induced by respiratory motion are expected to be very small.
Thirdly, the thin RV wall can be moved outwards whenever the mapping catheter is pushed firmly against the wall to obtain a stable signal, which might result in overestimation of RV volumes.
Measurement errors can also occur with CMR. The most difficult part of analysing volumes from short-axis slices with CMR is exact definition of the most basal slice. Sometimes, the delineation of basal myocardium and AV groove can be difficult, especially in cases with suboptimal image quality. As a basal slice contributes more to the volume than an apical one, measurement errors made at this level can be considerable. In our group, delineation of the basal slice proved to be difficult in two patients (17%) for the RV and in three patients (9%) for the LV. Furthermore, as images for ventricular volume calculation are acquired sequentially during several breath-holds, changes of depth of inspiration and expiration can lead to varying heart and thus potentially incorrect slice positions.
We aimed to investigate the patients with CARTO and CMR in a brief time frame in order to avoid physiological day-to-day changes in ventricular filling and size and to ensure comparable results between techniques. However, examinations with both techniques on the same day were not possible in all patients (median time interval between examination was 1 day) and may contribute to measurement differences.
Finally, the small sample size, especially for the RV, in our study might have led to a disproportionate weighting of outliers.
Conclusion
The CARTO mapping system provides end-diastolic volumetric data for the LV and RV, which, although they show a good correlation, are in clinical disagreement with values obtained by cardiovascular magnetic resonance. Therefore, the clinical interchangeability of the two techniques is somewhat questionable.
Acknowledgements
We thank Professor Dr Hans-Joachim Heinze, director of the Department of Neurology II, Otto-von-Guericke-University Magdeburg, who generously provided the magnetic resonance scanning facility.
Conflict of interest : none declared.
References
