


Abstract
Aims In this study, we apply non-invasive blood pressure (BP) monitoring, by continuous finger photoplethysmography (Finometer), to detect directly haemodynamic responses during adjustment of the atrioventricular (AV) delay of cardiac resynchronization therapy (CRT), at different heart rates.
Methods and results Twelve patients were studied with six re-attending for reproducibility assessment. At each AV delay, systolic BP relative to a reference AV delay of 120 ms (SBPrel) was calculated. We found that at higher heart rates, altering the AV delay had a more pronounced effect on BP (average range of SBPrel=17.4 mmHg) compared with resting rates (average range of SBPrel=6.5 mmHg), P<0.0001. Secondly, peak AV delay differed between patients (minimum 120 ms, maximum 200 ms). Thirdly, small changes in AV delay had significant BP effects: programming AV delay 40 ms below the peak AV delay reduced SBPrel by 4.9 mmHg (P<0.003); having it 40 ms above the peak decreased SBPrel by 4.4 mmHg (P<0.0005). Finally, the peak AV delay is highly reproducible both on the same day and at 3 months (Bland–Altman difference: 3±8 ms).
Conclusions Continuous non-invasive arterial pressure monitoring demonstrates that even small changes in AV delay from its haemodynamic peak value have a significant effect on BP. This peak varies between individuals, is highly reproducible, and is more pronounced at higher heart rates than resting rates.
Introduction
Cardiac resynchronization therapy (CRT) (atrio-biventricular pacing) is becoming widely applied in patients with chronic heart failure and prolonged QRS duration.1–4 There is a prompt improvement in haemodynamic status5–7 with an increase in peak rate of rise of intraventricular pressure,8 an increase in stroke volume9 (without additional cost in myocardial workload9,10), and consequently higher systemic arterial BP.4,11
In contrast to the general unselected population where higher BPs are associated with vascular damage and therefore poorer prognosis,12 in patients with advanced heart failure, it is lower BP which is consistently linked with poorer outcomes.13,14 This may be because in heart failure, lower BP is more likely to signify poor cardiac function than healthy vasculature.
Determining the optimal value of pacing parameters, especially atrioventricular (AV) delay, could therefore, in theory, be performed through invasive haemodynamic monitoring. However, in practice, the clinical expertise required, and risk associated with invasive monitoring, is sufficient to prevent invasive haemodynamics being routinely used to select pacing configuration.
Instead, many centres use a non-invasive echocardiographic approach when selecting pacemaker configuration.15 However, there are limitations to the echocardiographic approach. First, although shortening a long AV delay can be beneficial,16 it is not clear whether meeting the echocardiographic target necessarily maximizes any particular haemodynamic parameter or whether it merely represents an improvement on the patient's prior state. Secondly, because echocardiography is difficult at high heart rates, the optimization is typically restricted to resting heart rate, which may have limitations in terms of maximizing cardiac performance.
As CRT aims to improve the function of the heart, non-invasive measurement of the consequences of cardiac function on the vasculature (such as the BP) may be useful during the selection of pacing parameters.
The best-validated non-invasive technology for tracking changes in BP is the pressure-calibrated volume-clamp photoplethysmograph (Finometer), which uses a rapidly responding inflatable finger cuff to keep the volume of a finger constant during the cardiac cycle, thus directly documenting the pressure waveform (rather than inferring it from changes in volume). It is recognized to be highly reliable at quantifying beat-by-beat changes in BP.17,18
The first aim of this study was to quantify by pressure-calibrated finger photoplethysmography the immediate haemodynamic differences between different AV delays in individual patients.
The second aim was to determine whether the effect, on acute systolic BP, of changing AV delay is affected by the heart rate. Current methods for selecting pacemaker settings are generally restricted to slower heart rates by practical limitations and therefore make the tacit assumption that behaviour is the same at higher heart rates. Nor has previous work on non-invasive haemodynamic monitoring addressed the potential for differences in response with different heart rates.19 Early work with an implantable haemodynamic monitor suggests that the heart rate has an important effect on haemodynamics.20
The third aim was to establish whether the relationship of BP to AV delay is reproducible on subsequent re-testing. Scientifically, this is important because if the reproducibility of a physiological measure is not known, then it is impossible to interpret the relationship of the measure to another variable, as any disagreement may arise from either fundamental differences in the ‘true’ value or from random measurement error. Moreover, before any large-scale study of clinical outcomes from parameter selection could be contemplated, it is essential to have a technique whose reproducibility is satisfactory.
Methods
Subjects
Twelve outpatients with biventricular pacemakers or biventricular defibrillators implanted for clinical indications (NYHA III or IV heart failure, QRS>120 ms, left bundle branch abnormality, maximal medical therapy) were enrolled into this study, between 1 and 24 months after implantation. Eight were male, four female, age range 42–77 (mean 66 years). Cause of heart failure was ischaemic in eight, alcohol in one, and idiopathic dilated in three. Mean left ventricular ejection fraction (at time of the study) was 35%. The atrial lead was implanted in the right atrial appendage in all patients.
The interventricular delay was kept constant at the standard value of zero (or as near to zero as achievable). Patients gave informed consent for this study, which was approved by the local Ethics Committee.
Measurements
Data acquisition
Non-invasive finger arterial pressure measurements were made using a Finometer (Finapres Medical Systems, Amsterdam, Holland). This technique, developed by Peňaz21 and Wessling et al.22 uses a cuff, which is placed around the index finger, a built-in photo-electric plethysmograph, in combination with a volume-clamp circuit that dynamically follows arterial pressure. This technique is a well-validated method of measuring instantaneous changes in BP.17,18,23 An ECG signal was also recorded. These signals were acquired via an analogue-to-digital card (National Instruments, Austin, TX, USA) using custom software developed in our laboratory24 and analysed offline with further custom software based on the Matlab platform (MathWorks, Natick, MA, USA).
Measurement of relative change in BP across different AV delays
The beat-to-beat pressure was recorded during the adjustment of the AV delay of the subjects' biventricular pacemaker at the patients resting heart rate (mean heart rate 64 bpm). To minimize the effects of unavoidable spontaneous fluctuations in BP, we decided to compare each AV delay with a reference AV delay of 120 ms. At the time of pacemaker reprogramming, there is a prompt change in the arterial BP (Figure 1A). Over a period of minutes, short- and long-term fluctuations in BP (including those resulting from respiration) can make it difficult to identify precisely an increment related to pacemaker reprogramming. By adopting a convention of comparing the 10 beats immediately after a transition with the 10 beats immediately before, and calculating the difference in mean systolic BP (SBPrel) for that single transition, an estimate of the relative effect on systolic BP can be made, minimizing both the short-term respiratory noise and the longer-term fluctuations.
Effect of altering AV delay on blood pressure. (A) Example of the prompt change in blood pressure when the AV delay is changed. (B) A longer segment of the same recording, which includes several alternations of AV delay (in this example between 80 ms and the reference value of 120 ms) giving several replicate measures of SBPrel (systolic blood pressure relative to systolic blood pressure at the reference AV delay of 120 ms). (C) How SBPrel varies as AV delay is varied from 40 to 240 ms. (D) This relationship for four different heart rates (with SBPrel at each heart rate measured against the reference AV delay of 120 ms at that heart rate).
We repeated the transitions (Figure 1B) to obtain at least six replicate measurements for each SBPrel. We combined these to obtain, for each AV delay, a mean SBPrel along with the standard error of the mean, to describe the precision of the measurement.
To minimize the potential effect of trending up (or down), of the BP trace, during a series of transitions our protocol examined not only ‘forward’ transitions from reference to tested AV delay but also ‘backward’ transitions. We reversed the sign of the BP change observed during backward transitions. Therefore, any secular uptrend or downtrend in BP during the recording would be cancelled out.
SBPrel was measured in the manner described earlier for each AV delay (40, 80, 160, 200, 240 ms) as shown in Figure 1C. The protocol was then repeated for other heart rates, by reprogramming the pacemaker's lower rate limit, yielding for each patient four separate curves (resting rate, 90, 110, 130 bpm) as shown in Figure 1D. At resting rates, it was the sensed AV delay that was changed, whereas at higher heart rates, it was the paced AV delay. As 120 ms is the reference AV delay, each curve passes through an SBPrel of 0 mmHg at an AV delay of 120 ms.
Echocardiography
Aortic outflow tract velocity–time integral (VTI) was recorded over a range of AV delays (40, 80, 120, 140, 160, 200, and 240 ms). Multiple beats were recorded, and the average VTI over at least five beats was determined. To minimize patient discomfort, AV optimization was performed at only one heart rate, 130 bpm.
Mitral Doppler echocardiographic AV optimization was also performed, to maximize LV inflow time by the method previously described by Ritter.15 In accordance with standard clinical practice, this was done at resting heart rates.
Reproducibility
Of these 12 patients, six were enrolled into a reproducibility sub-study. These patients underwent the primary study measurements (Visit 1) in the usual manner, but then returned approximately 3 months later for an additional visit (Visit 2) which involved having the primary study measurements performed on two occasions (‘Visit 2, Test’ and ‘Visit 2, Retest’) 2 h apart. This enabled the calculation of the same-day reproducibility (using Visit 2) and the 3-month reproducibility (using Visit 1 and Visit 2).
Statistics
The SBPrel value was determined for each AV delay in relation to a reference AV delay (120 ms) by taking the mean of observed BP changes from at least six individual transitions. Paired comparisons were made using Student's paired t-test. Comparisons between multiple heart rates were made using repeated-measures ANOVA. Comparisons of proportions were made using Fisher's exact test. A P-value of <0.05 was taken as statistically significant. The statistical package Statview 5.0 (SAS Institute Inc., Cary, NC, USA) was used for analysis.
Results
Effect of biventricular pacing
All 12 patients yielded readily analysable data. As shown in Figure 1A, there was a prompt change in systolic BP when the AV delay was changed. In three patients, the longest AV delay tested was <240 ms because of interactions with the defibrillator settings.
Effect of altering AV delay at resting heart rate
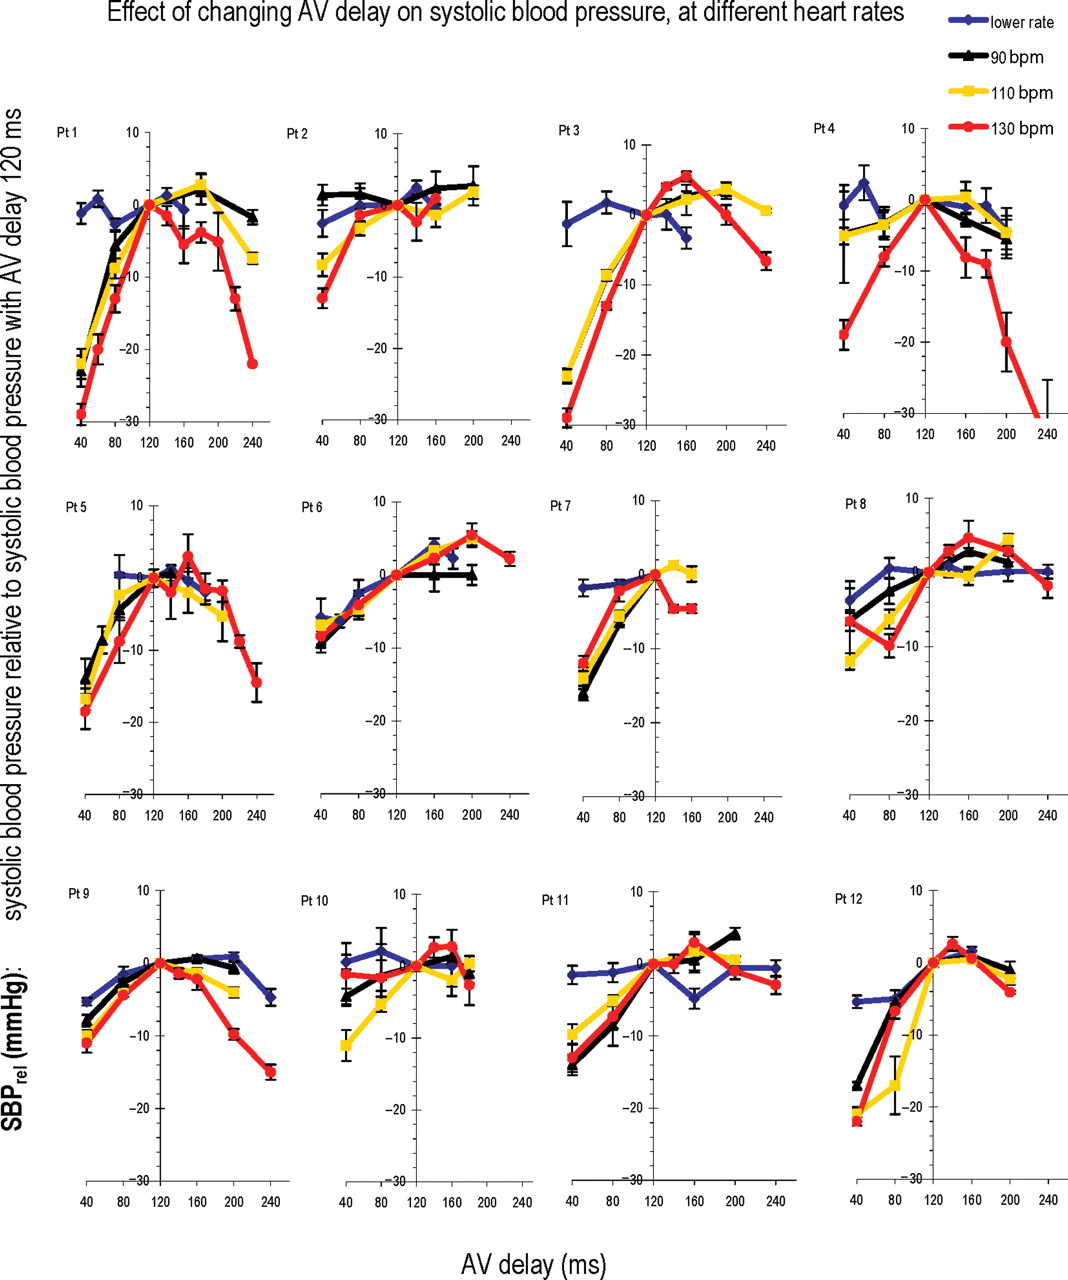
Individual data for each of the 12 patients is shown in Figure 2. To allow for comparisons between patients, we have expressed all BPs as relative (SBPrel) to the BP obtained in that individual patient at a reference AV delay of 120 ms.
The Individual data for all 12 patients. Each panel displays the data from one patient (Pt) as four curves, one for each heart rate (resting rate, 90, 110, and 130 bpm). Each curve shows SBPrel (systolic blood pressure relative to systolic blood pressure at the reference AV delay of 120 ms) as the AV delay is varied between 40 and 240 ms (at resting rates, sensed AV delay is changed, whereas at higher rates, paced AV delay is changed). Error bars are included for each individual measurement. At higher heart rates, there is greater evidence of a curve with a maximum.
At resting heart rate, as AV delay was varied over the range of 40–240 ms, although there was a detectable variation in systolic BP, this variation was small. For each patient, we calculated the ‘range of SBPrel values across different AV delays’ (Figure 1C) at the resting heart rate. Overall 12 patients, at resting heart rate the range of SBPrel across different AV delays averaged 6.5±0.7 mmHg.
Effect of altering AV delay at higher heart rates
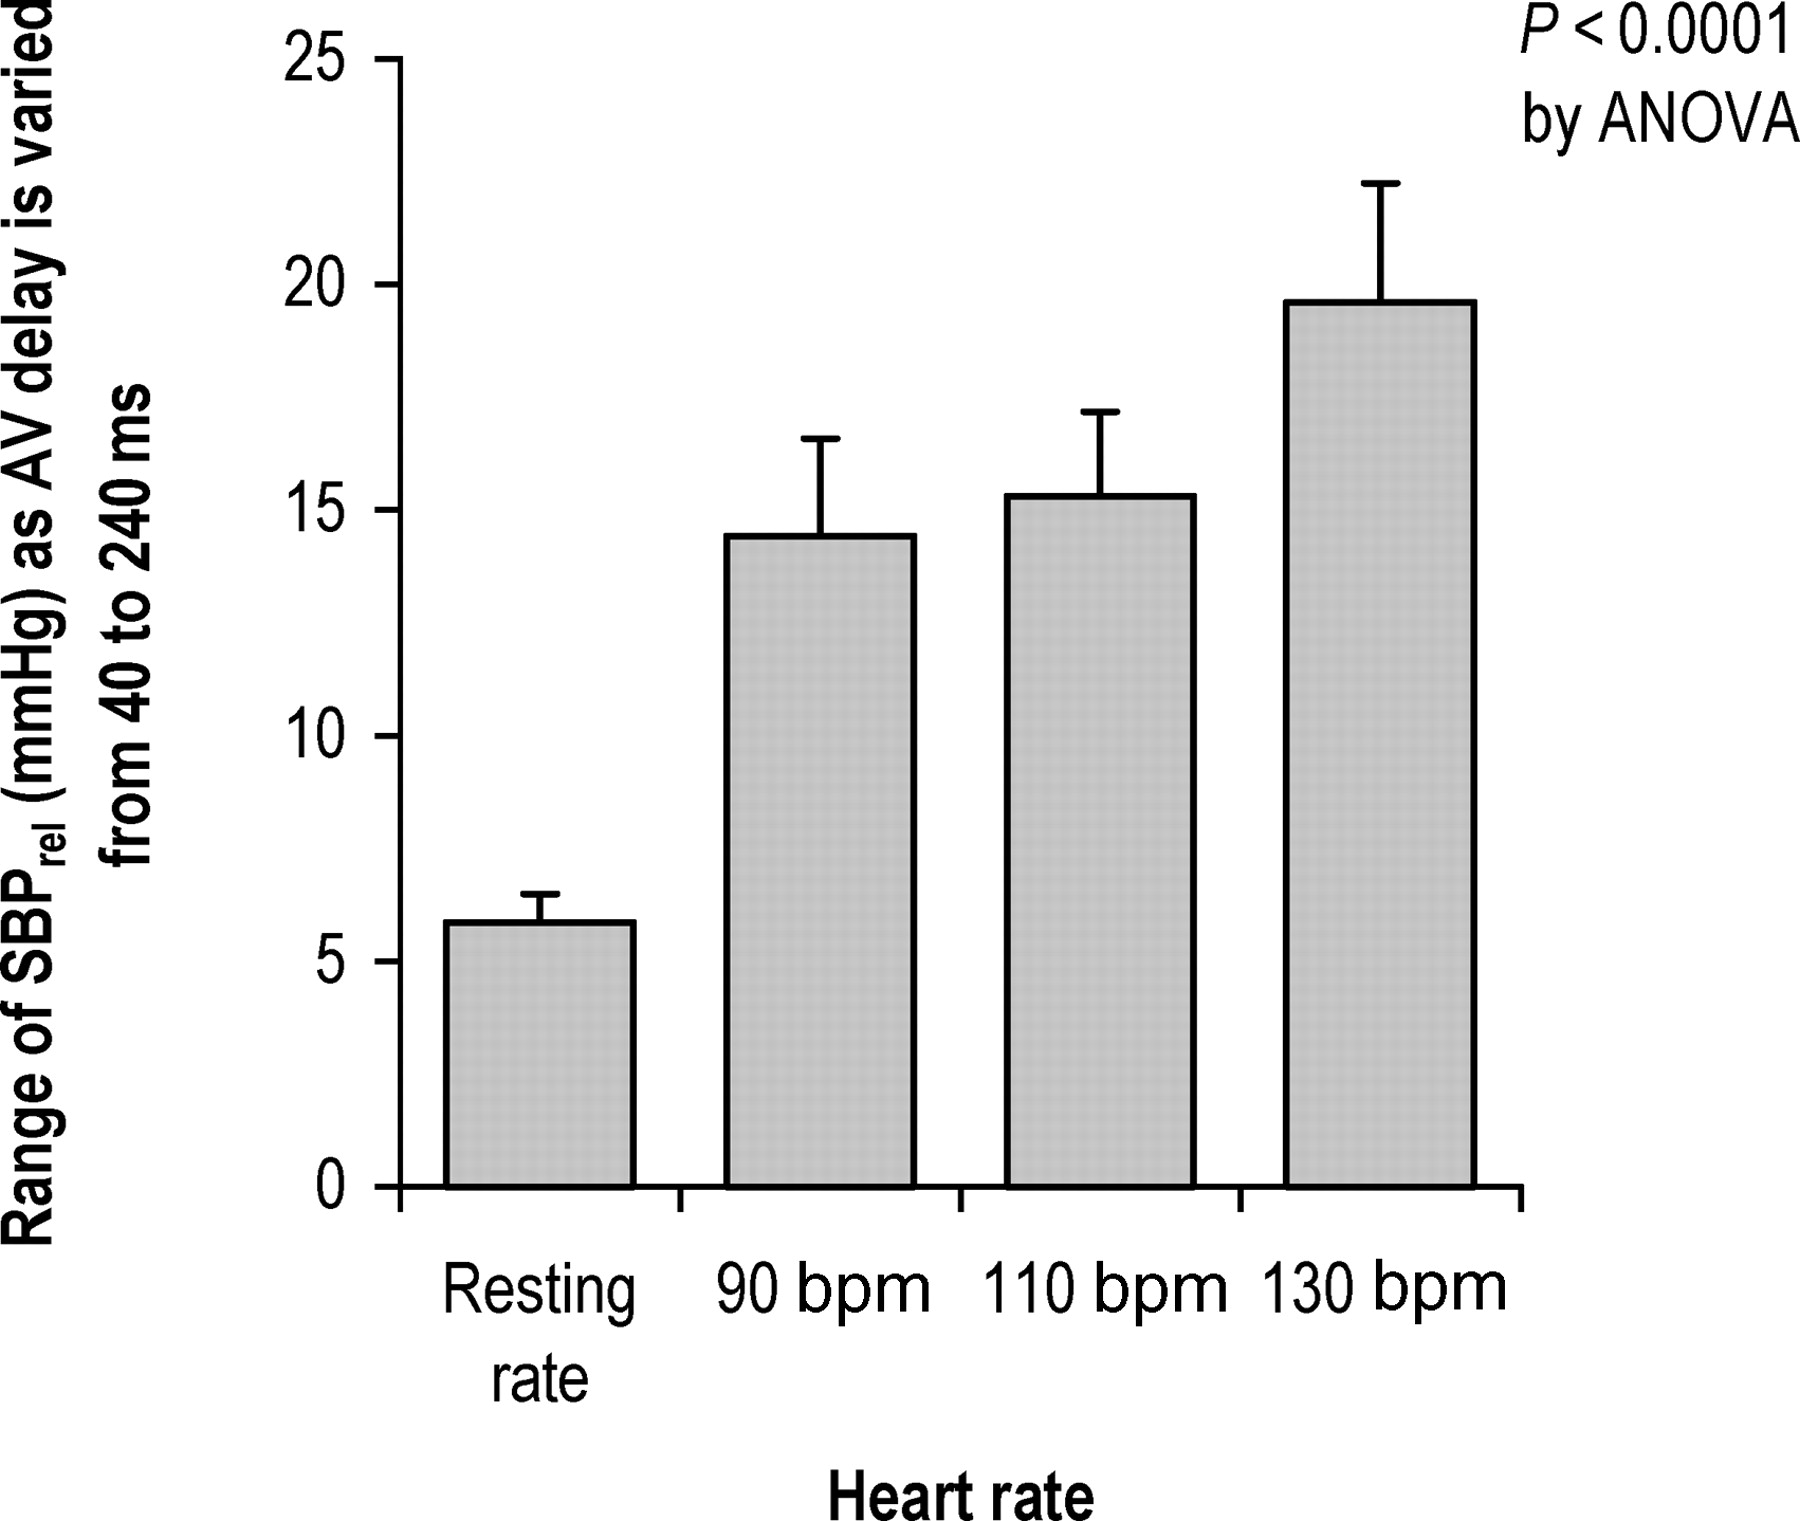
Alterations in AV delay had a more pronounced effect on BP at higher heart rates compared with lower heart rates, as can be seen in Figure 2. As the heart rate increased, the range of SBPrel across different AV delays became progressively wider in the group as a whole (P<0.0001 by ANOVA) (Figure 3) reaching 17.4±2.5 mmHg at 130 bpm. All 12/12 patients showed a clear maximum acute systolic BP at higher heart rates. At resting heart rates, the responses were smaller, and only 3/12 showed a clear haemodynamic peak (P<0.0005 by Fisher's exact test).
Sensitivity of blood pressure to changes in AV delay. At each heart rate, the bar represents the average within-patient variation in SBPrel as AV delay is varied across a spectrum of values from 40 to 240 ms.
Effect of non-optimal AV delay for individual patients
Blood pressure became progressively lower as AV delay was changed away from the individual patient's acute systolic BP maximum. The average decline across all patients is shown in Figure 4 for the heart rate of 130 bpm. Even a small alteration in AV delay of 20 ms causes a statistically significant decline (P<0.002 for a shortening of AV delay by 20 ms and P=0.01 for a lengthening of AV delay by 20 ms).
Change in systolic blood pressure (averaged across all patients) as AV delay is moved away from its patient-individualized optimum (defined as the one that yields the highest systolic blood pressure). The statistically significant differences from optimal are labelled.
We found that moving away from haemodynamic optimal AV delay caused a significant decline in BP at resting heart rate, 110, and 130 bpm with regression P-values of 0.04, 0.0037, and <0.001, respectively (at a heart rate of 90 b.p.m. the regression P-value was 0.05). As heart rate was increased, the slope of the fall in BP per unit deviation from optimal AV delay was progressively larger (Figure 5).
Effect of heart rate on change in systolic blood pressure (averaged across all patients) as AV delay is moved away from its patient-individualized optimum (defined as the one that yields the highest systolic blood pressure). The heart rates tested were resting rate, 90, 110, and 130 bpm, regression P-values are shown for all four heart rates tested.
Comparison with echocardiographic measurements
The VTI of Doppler left ventricular outflow tract velocities was measured at AV delays between 40 and 240 ms at a heart rate of 130 bpm. In five patients, the echocardiographically selected AV delay (the one with the greatest VTI) was the same as the AV delay selected by continuous non-invasive haemodynamics. In five of the remaining seven, the AV delays selected by the two approaches were within 40 ms of each other. The mean absolute difference between AV delays selected by the two methods was 23±7 ms.
Patients also underwent the selection of AV delay by the left ventricular inflow echocardiographic method of Ritter.15 The mean absolute difference in selected-AV delay between the LV inflow method and the continuous haemodynamic method was 35 (standard error 6) ms.
Reproducibility
The mean absolute difference between the two determinations, 3 months apart, of AV delay yielding maximal acute systolic BP was 3 ms (standard deviation 8 ms). By echocardiography, the mean absolute difference was 17 ms (standard deviation 20 ms). Same-day reproducibility for the non-invasive haemodynamic method was 3 ms (standard deviation 8 ms).
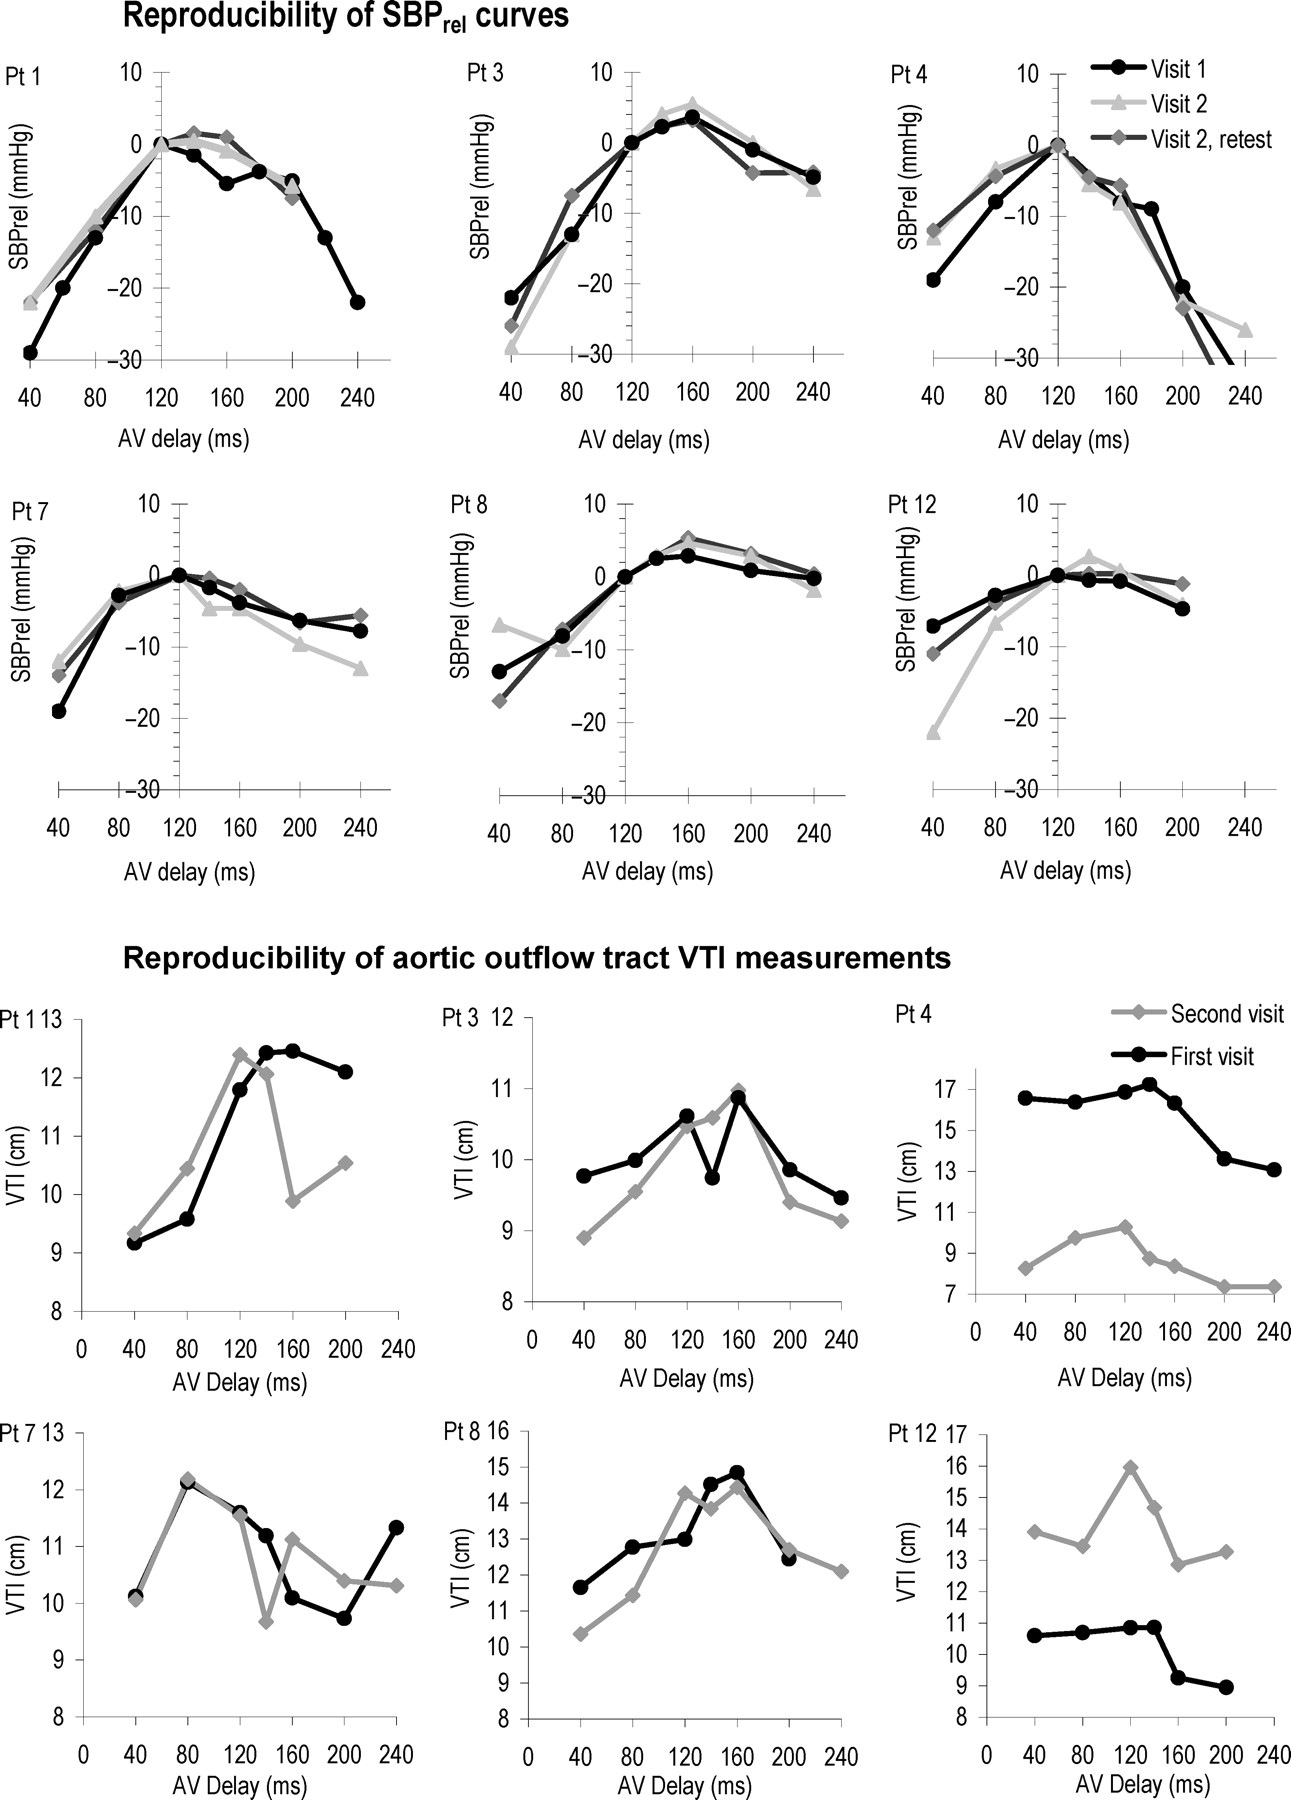
Aside from reproducibility of the AV delay setting yielding the maximal BP, the reproducibility of individual measurements of SBPrel was also calculated (Figure 6). The standard deviation of the difference between two measurements of SBPrel, 3 months apart, was 3 mmHg, which is 3% of the mean systolic BP. For echocardiography, the standard deviation of difference of two measurements of VTI was 2.6 cm, which is 20% of the mean VTI. The individual measurements of all six patients are shown in Figure 6.
Reproducibility of echocardiographic VTI measurements and Finometer measurements at a heart rate of 130 bpm. The curves for the first and second visit are shown for the echocardiographic measurements. The first and second visits as well as same-day reproducibility are shown for the haemodynamic measurements.
Discussion
In this study, we have found that systemic haemodynamic effects of changes in AV delay in patients with cardiac resynchronization are immediately detectable by continuous non-invasive haemodynamic monitoring, with even small changes in AV delay causing significant immediate effects on systolic BP. Secondly, the effects are significantly more profound at higher heart rates than that at resting heart rate. Thirdly, the curve describing the BP dependence upon AV delay for an individual patient is highly reproducible on retesting, whether on the same day or 3 months later.
Haemodynamic effects and cardiac resynchronization
Haemodynamics are a rational short-term marker of the effect of CRT, because resynchronization cannot have any direct effects on the peripheries. All its effects arise from changes in intracardiac timing and thereby changes in haemodynamics. Cardiac resynchronization is uniquely different from any drug, in that it is the only therapy that raises cardiac output while reducing myocardial oxygen consumption.9,10Elevating cardiac output in this way results in the elevation of arterial BP (because of the relationship: BP=cardiac output×total peripheral resistance).
A variety of haemodynamic improvements are recognized to occur acutely with resynchronization, including an increase in peak rate of rise of intraventricular pressure,8,25 an increase in stroke volume,9 and consequently higher systemic arterial BP,4,9,11 each is a potential guide for haemodynamic optimization. The advantage of using non-invasive beat-to-beat BP is that continuous samples can be obtained relatively easily, without the risks of invasive catheterization, which allow spontaneous physiological fluctuations to be handled by averaging multiple samples.
Heart rate dependence
At lower heart rates, AV delay made a relatively small difference in systolic BP, which is consistent with previous studies using invasive and non-invasive haemodynamics.19 At higher heart rates, however, we recorded a more profound variation in systolic BP, with changes in AV delay (at 130 bpm, ranging 8 mmHg on average within individual patients). This observation may have a physiological explanation. Resynchronization has two important effects on myocardial activity. First, it makes contraction more synchronous, increasing LV dP/dt,8and therefore making for a more efficient systole. Second, more time is available for left ventricular filling. For many patients, at rest, this improvement in filling is not important because filling time may already be sufficient. However, at higher heart rates, filling time may become a limiting factor, and selecting the ideal AV delay may therefore improve arterial BP.
Although all 12 patients showed a clear optimum AV delay at elevated heart rates, the effects were of different sizes in different patients. In all but one (patient 10), at 130 bpm, the haemodynamic effect was greater than 10 mmHg. This variability between patients is to be expected and presumably reflects biological variation between patients in the degree of dependency of their haemodynamics on precise timing of activation.
Potential importance of sensitivity of BP to AV delay
The changes in BP evinced by changes of 20 or 40 ms in AV delay may seem small at first, but even small differences in haemodynamic status are known to be associated with significant absolute differences in outcome in patients with chronic heart failure. For example, cross-sectional observational data suggest a 4% (95% confidence interval, 3–5%) relative increase in mortality per mmHg decline in systolic BP in outpatients with chronic heart failure.26 Moreover, in the COMPANION trial, patients in the resynchronization arm initially gained ∼2 mmHg (confidence interval not published) in systolic BP (in comparison with the control arm) and went on to have a 18% relative reduction (95% confidence interval, 1% increase to 42% reduction) in the combined endpoint of morbidity and mortality.4 Similarly, the Care-HF trial showed, at three months, that the increment in BP attributable to being in the device arm was 5.8 mmHg (95% CI, 3.5–8.2) and the mortality reduction was 37% (95% CI: 23–49).27 In short, the observational data are congruent in direction with these large studies of intervention, with the effect on mortality seen in the outcome studies being somewhat larger than that may be predicted from the observational data. Thus, although causality between increase in systolic BP and clinical effect is not established and one cannot extrapolate this to a likelihood of benefit from fine-tuning of resynchronization, it does indicate that even small differences in BP can signify haemodynamic differences that have large clinical effects.
It is not paradoxical that these findings are opposite to those seen in drug therapy, namely that the beneficial agents (such as ACE inhibitors and beta-blockers) generally reduce BP. Cardiac resynchronization is the only therapy that decreases myocardial energy consumption while increasing the external work done by the heart9 (because it improves efficiency directly). The beneficial drug therapies also decrease myocardial energy consumption but can only do this by reducing the external work done by the heart, namely by directly or indirectly dilating the arterial vasculature. Thus, the beneficial drug therapies reduce arterial BP, in contrast with cardiac resynchronization that increases it, yet they both are beneficial.
Part of the primary mechanism of these drugs is vasodilation, which generates a lower BP per unit energy consumption by the myocardium. Beta-blockers also reduce energy consumption by reducing heart rate and in many cases stroke volume.
Practicality of BP vs. other measurements
For the purposes of optimization, echocardiographic VTI measures are handicapped by the requirement for a skilled operator, maintenance of constant position of probe and patient for a long study, and quantification of the Doppler signal into velocity–time graphs. Most importantly, echocardiographic techniques are limited by poor reproducibility.
The arterial BP maximum broadly corresponded with stroke volume maximum as assessed by Doppler echocardiography of the aortic outflow tract. Of course, no two tests can agree better than either test agrees with itself. Thus, the poorer reproducibility of the echocardiographic approach places a ceiling on how well the two measurements can correspond. This theme may repeatedly mar attempts to compare outflow tract VTI with haemodynamic measurements.
There are many other haemodynamic measures potentially available for optimization, including LV dP/dt, aortic pulse pressure, and aortic outflow tract VTI. Some of these, e.g. LV dP/dt, show a greater percentage change during optimization than BP. However, arterial BP has the practical advantage that it can be measured non-invasively with minimal discomfort to the patient while retaining sufficient resolution to identify haemodynamic optimal AV delays.
Study limitations
In this study, we have addressed AV delay only, without adjusting interventricular delay; therefore, we can only conclude that this technique seems practical for the selection of AV delay within individual patients. Whether it is applicable to VV delay would need to be separately addressed. Also, this methodology is not applicable to patients with atrial fibrillation.
We have focused on the immediate BP effects of changes in AV delay. We do not imply that these effects remain at the same magnitude in the long term. It is likely that they will be attenuated by the integrated cardiovascular responses to a change in cardiac efficiency. However, these cardiovascular responses (that may include, for example, reduced vascular resistance) are likely to be beneficial.
In this study, higher heart rates were induced by increased pacing rate rather than exercise that has many additional physiological effects. Although this does not fully mirror the physiological effects of exercise on the body, it does allow changes in haemodynamics and reproducibility to be studied with precision.
We recognize that the haemodynamic effects of a range of sensed AV delays may differ from those of the same range of paced AV delays. It is known that conduction time is prolonged during right atrial pacing when compared with spontaneous atrial activation.28 The purpose of this study was to determine the potential for measuring rapidly and non-invasively the size of the acute haemodynamic effect arising from acute changes in AVD and whether this effect differed at different heart rates. Separate studies would be needed to identify to what degree optimal sensed AV delays differed from paced AV delays. Such studies, carried out during exercise, might be possible using the approach developed in this study.
Finally, we make it clear that this study makes no attempt to demonstrate a link between AV delays and symptoms or survival. It merely proposes a potentially efficient method for rapid, reproducible adjustment of configuration of an existing implanted device to maximize haemodynamic benefits.
Conclusions
The consequences of changes in AV delay can be reproducibly quantified using acute non-invasive haemodynamics, with minimal discomfort to the patient and without the requirement for a skilled operator. At higher heart rates, every patient shows a clear peak AV delay for acute BP. The consequences of changing AV delay away from its peak are visible as a significant loss of arterial BP, which increases in magnitude as heart rate increases. This method is highly reproducible not only on the same day but also after 3 months.
