


Abstract
Aims To perform a comprehensive analysis of all aspects of patient and in-room personnel radiation dosimetry in interventional electrophysiology.
Methods and results Measurements were performed during 19 diagnostic electrophysiology studies and 24 catheter ablations. Kerma-area product and exposure time values were 48.7 (6.4–230) Gy cm2 and 25.5 (4.4–79.2) min for ablation, and 12.5 (4.5–117.2) Gy cm2 and 4.5 (1.2–31) min for diagnostic studies, respectively. Patient effective doses were 15.2 (2.1–59.6) mSv for ablation and 3.2 (1.3–23.9) mSv for diagnostic procedures. Radiation risk to the patient was estimated to be up to eight cases of fatal cancer in 10 000 procedures. The risk of development of fatal cancer was less than 3×10⁻⁶ per procedure to the primary operator. The risk for the nurse and technician was much lower. The dose per procedure for the primary operator was 7.1 µGy at the eyes, 0.79 µGy at the chest under the lead apron, 13.68 µGy at the chest over the apron, 3.82 µGy at the thyroid, 17.76 µGy at the left hand, and 12.11 µGy at the left knee.
Conclusion As far as radiation exposure is concerned, electrophysiology studies followed by radiofrequency ablation are safe procedures for both patient and personnel when performed in catheterization laboratories with modern equipment, experienced operators, and standard safety precautions.
Introduction
Growing use of electrophysiology studies, often followed by radiofrequency (RF) catheter ablation, in young adults has caused increased concern over potential radiation effects. Ionizing radiation is linked to potential injury defined by either stochastic effects (e.g. DNA damage, cancer induction) or deterministic effects (e.g. skin injuries), which require a minimum number of affected cells and a threshold dose value. For electrophysiological and ablation procedures exceeding 1 h of total irradiation time, patient skin doses can be above the threshold for deterministic effects, and skin injuries have been reported.1 The risk for medical personnel is often underestimated due to the small amount of acute radiation exposure from each examination. However, for cardiologists with a high workload, the total exposure may lead to a significant cumulative dose and radiation risk. Additionally, cardiologists are exposed to scattered radiation which results in non-uniform dose rates. Cardiologists receive high doses to head and extremities that may be unshielded, and which may increase the cumulative risk. Published reports on the radiation risk from electrophysiological studies focus either only on the ablation procedure and especially the assessment of patient effective radiation dose and associated detriment risk,2–5 or on the exposure of patients and medical personnel.1,5–7 Only one of them deals with both patient and personnel dosimetry aspects but no phantom measurements were performed.8
The objective of the present study was to consider all radiation aspects of the electrophysiological procedure which may or may not lead to ablation. Thus, it aimed at: (1) measuring the entrance dose and calculating effective dose for all in-room personnel, (2) performing an assessment of patient-effective dose and individual dose received by all organs, (3) investigating the contribution of each projection to kerma-area product (KAP) and irradiation time, and (4) estimating the risk for fatal cancer to patients and operators. To our knowledge, our report represents the first comprehensive analysis concerning all important issues of patient and in-room personnel dosimetry in interventional electrophysiology.
Methods
Patients
Patients subjected to diagnostic electrophysiological procedures with or without subsequent catheter ablation were studied. Diagnostic electrophysiology and RF ablation were accomplished using standard techniques. Electrodes and ablating catheters were positioned through bilateral femoral access as previously described.9–11 Atrioventricular nodal reentry tachycardia (AVNRT) was ablated through modification of the slow pathway.11 A trans-septal approach was used for ablation of left-sided accessory pathways,10 whereas atrial fibrillation ablation was accomplished via ostial pulmonary vein isolation with the Lasso technique.9 All procedures were carried out at Athens Euroclinic, in a modern electrophysiology laboratory and by an operator with a broad experience of all aspects of cardiac electrophysiology and catheter ablation. An assistant physician was usually at the table beside the main operator, whereas radiographers were in the catheterization room behind a protective shield. The study was approved by our Institutional Review Board and all patients had signed an informed consent.
Radiation dose measurements
Procedures were performed on a Philips (Einthoven, The Netherlands) Integris H3000 C-arm X-ray unit with an undercouch X-ray tube/overcouch image intensifier configuration. The X-ray tube had a total filtration of 3 mm Al. Source-to-image intensifier distance was set at 100 cm. A series of data relating to the radiation exposure were recorded throughout each procedure. KAP value (Gy cm2) and exposure time were monitored separately for fluoroscopy and digital cine. Data were separately recorded for each projection used, [i.e. PA (posteroanterior), LAO (left anterior oblique) 60o, and RAO (right anterior oblique) 30o]. Prior to all measurements, the field size corresponding to the field size seen at the monitor was recorded. Furthermore, additional data regarding technical factors (i.e. tube potential kVp, tube current mA exposure, time, and frame rate) were logged.
For scattered radiation measurements, the dosimeters were also calibrated against a portable dose-rate meter (Berthold LB 133, Bad Wildbad, Germany) and placed on a cylindrical polymethylmethacyclate (PMMA) phantom (r=16 cm, h=30 cm) situated at the most frequent position of the cardiologist during the procedure (50 cm right from the patient pelvis) oriented parallel to the primary beam (broad-beam geometry). The rate meter and the TLDs were placed at a position corresponding to the operator's chest level. A similar cylindrical PMMA phantom was put on the bed at normal patient position (in the primary X-ray beam, 60 cm from focus) to act as the main source of scattered radiation. Calibration was repeated for tube high voltages between 50 and 90 kVp for the three projections (PA, LAO 60°, and RAO 30°).
Kerma-area product measurements were performed with a KAP meter (Gammex-RMI Ltd, Nottingham, UK) built into the X-ray system. The KAP meter was calibrated in situ and had a total uncertainty of 4% at a confidence level of 95%. The calibration was performed according to the manufacturer recommendations, with and without the patient table at the average tube potential used in everyday practice (80 kVp), by using RTI Electronics (Mölndal, Sweden) Solidose dosimeter with an RTI Electronics PMX solid-state detector.
Effective dose calculations of patients data were undertaken using three separate methods: (1) TLD measurements with the use of an anthropomorphic phantom (the Alderson Rando phantom),12,13 (2) the National Radiological Protection Board (NRPB) approach14 with the use of the KAP to effective dose-conversion factor for each projection, and (3) a commercially available computer programme (WinODS version 1.0a software, 1997, RTI Electronics),15,16 calculating effective dose by KAP values for each projection, given tube potential kVp, field size, and patient data.
Additionally, organ doses per projection were estimated by using WinODS software Doseguard 100 marketed by RTI Electronics. This software requires knowledge of the average KAP values per projection, the focus patient distance, the X-ray tube voltage, and the weight of the average patient.
In order to estimate the dose to the personnel, TLD chips were attached to each person inside the operating room. Specifically six sets of TLDs (each set containing three chips) were placed on each operator. These dosimeters were attached to the left branch of the eyeglass, the thyroid, the chest over and underneath the lead apron, the left hand and knee. Additionally, the nurse and the technologist wore a TLD each sited on the left side of the chest over the lead apron. All procedures were performed by the same operators. As radiation received by medical personnel is often underestimated due to the small exposure per case, accumulated dose measurements over the total cases performed in this study was used.
Effective dose to the personnel was calculated by using two calculation methods already reported in literature.18,19 The first, published by Niklason et al.18 calculates effective dose Deff as Deff=0.02(Hos−Hu)+Hu, where Hos is the dose outside the lead apron and Hu is the dose recorded under the lead apron. The second method proposed by Faulkner and Marshall19 calculates Deff as Ho/32, where Ho is the total dose.
Radiation risk to the patient
An analysis quantifying the risk of fatal cancer over patient's lifetime has been proposed by the ICRP in publication 60.17 A risk factor of 5.6×10⁻² Sv−1 applies to the whole population, whereas corresponding value of 4.6×10⁻² Sv−1 has been used to calculate lifetime probability of a fatal cancer.
Results
Patients
Measurements were performed during 43 electrophysiological procedures conducted on 30 male and 13 female patients. Twenty four of the procedures were diagnostic electrophysiological studies followed by RF catheter ablation. In the remaining patients, catheter ablation was deferred or radiation measurements were obtained only during the diagnostic study. Clinical characteristics are provided in Table 1.
Clinical characteristics of patients
| Number | Age (years) | Weight (Kg) | Height (cm) | Diagnosis | |
|---|---|---|---|---|---|
| EPS | 19 | 51 (19–68) | 78 (65–110) | 175 (154–190) | AVNRT, n=2 |
| VT, n=6 | |||||
| AF, n=3 | |||||
| NS, n=8 | |||||
| EPS and ablation | 24 | 47 (14–67) | 80 (45–102) | 165 (157–183) | AVNRT, n=8 |
| AVRT, n=5 | |||||
| Atrial flutter, n=3 | |||||
| AT, n=2 | |||||
| AF, n=2 | |||||
| VT, n=4 | |||||
AVRT. atrioventricular reentrant tachycardia due to accessory pathway; AVNRT, atrioventricular nodal reentrant tachycardia; AT, atrial tachycardia; AF, atrial fibrillation; Ablation refers to ostial isolation of pulmonary veins; VT, ventricular tachycardia; NS, normal study performed for investigation of syncope or possible arrhythmia. Values are presented as median (range).
Radiation dose measurements
If all procedures are considered together, an average total KAP value equal to 22.3 (4.5–230) Gy cm2 was measured for the study group. Mean KAP values are presented separately for each subgroup of measurements in Table 2, together with average total radiation exposure time and digital cine time. Digital cine was usually obtained for documentation purposes. The calculated patient effective doses (for ablations and electrophysiological measurements) with the use of WinODS software and the NRPB method are also presented.
Median KAP and time values for diagnostic electrophysiology and ablation procedures
| Number | KAP t (Gy cm2) | KAP f (Gy cm2) | Exposure time (min) | Number of frames | ED NRPB (mSv) | ED WinODS (mSv) | |
|---|---|---|---|---|---|---|---|
| EPS and ablation | 24 | 48.7 (6.4–230) | 47.9 (6.4–229.1) | 25.5 (4.4–79.3) | 26 (4–400) | 7.1 (0.6–35.1) | 15.2 (2.1–59.6) |
| Atrial flutter | 3 | 80.6 (37.7–183.6) | 80.3(37.7–183.0) | 35.0 (30.2–63.0) | 18 (4–24) | 12.1 (4.7–28.4) | 18.2 (13.4–45.5) |
| AF | 2 | 133.4 (87.2–179.6) | 124.7 (78.0–171.4) | 37.9 (27.1–48.6) | 367 (335–400) | 16.6 (10.1–23.0) | 30.1 (15.3–45.0) |
| AT | 2 | 31.80 (13.6– 50.0) | 31.2 (13.6–48.9) | 21.6 (7.9–35.3) | 69 | 4.4 (1.7–7.2) | 8.1 (3.6–12.6) |
| AVNRT | 8 | 35.75 (6.4–171.5) | 29.6 (6.4–171.2) | 19.5 (9.8–54.3) | 16 (8–42) | 4.8 (0.6–29.9) | 10.0 (2.8–44.4) |
| AVRT | 5 | 77.9 (8.7–230.0) | 77.0 (8.5–229.1) | 31.9 (4.8–79.2) | 33 (20–92) | 12.8 (1.1–35.1) | 19.1 (3.1–59.6) |
| VT | 4 | 36.9 (9.9–57.9) | 36.5 (9.8–55.5) | 14.7 (4.4–26.2) | 26 (7–81) | 5.5 (1.7–11.7) | 10.3 (2.1–15.7) |
| EPS | 19 | 12.5 (4.5–117.2) | 12 (4.5–107.8) | 4.5 (1.2–31.4) | 115 (22–300) | 1.7 (0.7–18.0) | 3.2 (1.3–23.3) |
| AF | 3 | 36.9 (7.6–117.2) | 36.9 (7.6–107.8) | 10.5 (2.6–31.0) | 300 | 5.5 (0.9–18.0) | 10.6 (2.0–23.3) |
| AVNRT | 2 | 12.6 (12.2–13.0) | 9.5 (7.0–12.0) | 3.8 (1.7–5.9) | 99 (22–176) | 1.6 (1.5–1.6) | 3.1 (3.0–3.2) |
| VT | 6 | 10.9 (4.5–22.3) | 10.9 (4.5–22.3) | 3.8 (1.2–6.5) | — | 1.8 (0.7–3.3) | 3.2 (1.5–6.4) |
| NS | 8 | 13.0 (4.9–48.4) | 12.5 (4.9–48.4) | 4.9 (2.3–7.4) | 54 | 1.9 (0.7–8.5) | 3.3 (1.3–14.8) |
Values are provided as median (range). Number of frames for AT, VT, and NS were not registered in all patients. EPS, electrophysiology study; KAP t, KAP total; KAP f, KAP fluoroscopy; ED NRPB, effective dose calculation using NRPB method; ED WinODS, effective dose calculation using WinODS method.
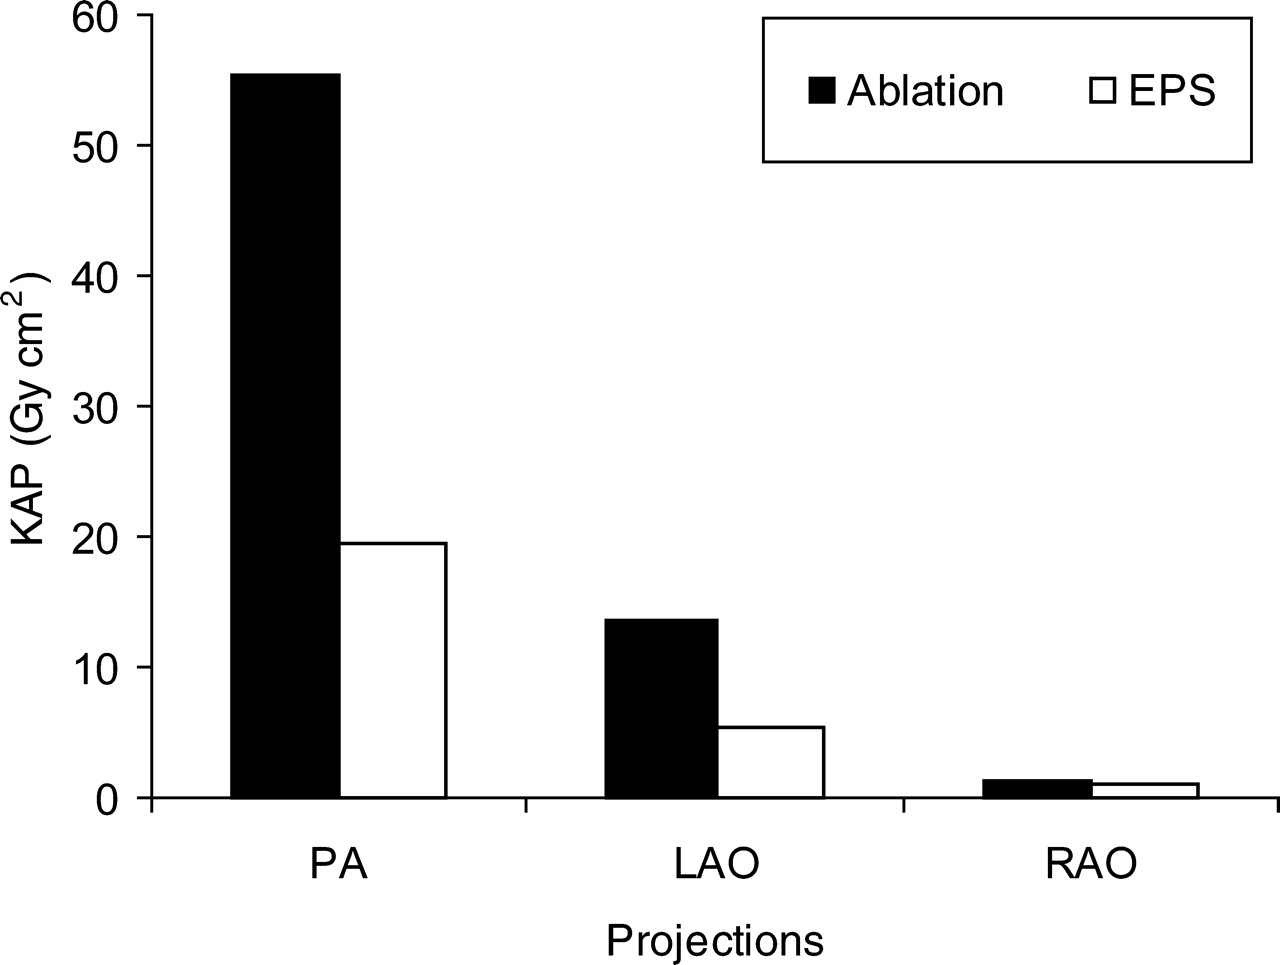
In Figure 1 the contribution of each projection to KAP values for all patients is demonstrated. The anteroposterior projection, the preferred projection of the operators, contributed to the highest KAP values.
Contribution of each projection to KAP value for all patients, in electrophysiological study and ablation procedures.
Phantom radiation dose measurements
The measured organ doses at the Rando phantom as well as the number of TLDs used per organ are presented in Table 3. For comparison, the corresponding organ doses calculated with WinODS are given in Table 3 as well. The effective dose deduced from measurements with the Rando Phantom is 7.5 mSv. This value is comparable with the one obtained using the NRPB approach which was 7.1 mSv. The phantom effective doses do not agree with the corresponding values estimated by using the WinODS software which were 12.1 mSv. The corresponding total risk for fatal cancer, for a typical procedure for the patients is 4.2×10⁻⁴.
Measured organ doses at the Rando phantom
| Tissue | Number of TLDs | Dose Rando (mGy) | Dose WinODS (mGy) |
|---|---|---|---|
| Gonads | 2 | 0.05 | 0 |
| RBM | 19 | 13.5 | 7.03 |
| Colon | 6 | 0.1 | 0.01 |
| Lung | 47 | 21.27 | 29.01 |
| Stomach | 11 | 7.99 | 11.41 |
| Bladder | 4 | 0.05 | 0 |
| Breast | 0 | 0.05 | 0 |
| Liver | 15 | 8.7 | 20.83 |
| Oesophagus | 11 | 28.99 | 6.82 |
| Thyroid | 3 | 2.9 | 0.14 |
| Skin | 26 | 2.15 | 4.2 |
| Bone surface | 10 | 0.22 | 2.31 |
| Adrenals | 2 | 0.15 | 11.04 |
| Brain | 9 | 1.82 | 0 |
| Kidney | 6 | 0.15 | 1.56 |
| Muscle | 10 | 45.85 | 3.57 |
| Pancreas | 3 | 3.57 | 3.56 |
| Spleen | 6 | 3.68 | 19.41 |
| Thymus | 1 | 2.57 | 3.55 |
Personnel radiation dose measurements
In Table 4, the effective dose per procedure for the primary operator, the assistant operator, the technician radiographer, and the nurse calculated from the TLD measurements using the two different methods presented in the literature, is demonstrated. If the higher calculated effective dose is considered, then the total risk per procedure of developing a fatal cancer estimated by multiplying the effective dose by the risk factor for radiation workers, (4.6×10⁻² Sv−1), was 3.0×10⁻⁶ for the primary operator, 2.5×10⁻⁶ for the assistant operator, 2.3×10⁻⁷ for the technician, and 2.85×10⁻⁷ for the nurse.
Effective dose per procedure calculated from the TLD measurements
| Dose (µGy) | Dose/procedure (µGy) | Effective dose (Niklason)(µSv) | Effective dose (Faulkner) (µSv) | |
|---|---|---|---|---|
| Primary operator | 39.8 | 65.6 | ||
| Eyes | 270 | 7.10 | ||
| Chest under apron | 30 | 0.79 | ||
| Chest over apron | 520 | 13.68 | ||
| Thyroid | 145 | 3.82 | ||
| Left hand | 675 | 17.76 | ||
| Left knee | 460 | 12.11 | ||
| Assistant Operator | 39.4 | 54.1 | ||
| Eyes | 200 | 4.65 | ||
| Chest under apron | 30 | 0.70 | ||
| Chest over apron | 275 | 6.39 | ||
| Thyroid | 165 | 3.84 | ||
| Left hand | 485 | 11.28 | ||
| Left knee | 575 | 13.38 | ||
| Radiographer | 2.0 | 3.1 | ||
| Chest under apron | 0 | 0 | ||
| Chest over apron | 100 | 2.33 | ||
| Nurse | 2.5 | 3.9 | ||
| Chest under apron | 0 | 0 | ||
| Chest over apron | 125 | 2.91 | ||
Radiation risk to the patient
The corresponding total risk for fatal cancer for the patients due to irradiation during the procedures can be calculated if the radiation risk factor 5.6×10⁻² Sv−1 for the general population is multiplied by the calculated effective doses. If the lowest and highest values are considered, the total risk is estimated between 3.4×10⁻⁵ and 2×10⁻³ for ablation procedures, and between 3.9×10⁻⁵ and 10−3 for electrophysiological procedures.
Discussion
The aim of this study was to assess all radiation dosimetric aspects of cardiac electrophysiological procedures. Thus, we measured patient skin doses and assessed patient effective doses, and we also performed dose measurements in an anthropomorphic phantom in order to compare them with effective dose calculations. We calculated radiation risk to the patient during these procedures. We also performed personnel radiation dose measurements in order to calculate the risk arising from these procedures. Although several reports have dealt with radiation issues during ablation procedures, no such comprehensive study exists.
The estimated average effective dose values measured for electrophysiological procedures are among the lowest that have been reported in the literature for cardiac catheterization procedures,20–27 despite our rather long exposure times. This can be attributed to the fact that exposure time is mainly due to fluoroscopy, whereas as we have previously shown,28,29 the main reason for increased patient radiation doses is digital cine exposure time. Considering the effective dose calculated for ablation procedures, McFadden et al.4 have reported 17 mSv, Kovoor et al.5 6.34 mSv per 60 min of fluoroscopy, while Lickfett et al.6 have reported effective dose values in the range of 1.48–49.75 mSv. In this study, the estimated patient effective dose values when calculated separately for ablations and diagnostic electrophysiological procedures were found to be (median value and range) 15.2 (2.1–59.6) mSv and 3.2 (1.3–23.9) mSv, respectively when the NRPB method was used. Important differences in effective dose values were found when both NRPB and WinODS methods were used and could be attributed to the different input data that the two methods use in calculating effective dose. The fact that the effective dose measured in the phantom for a typical procedure is in good agreement with the value calculated by using the NRPB method, supports the use of this rather than the WinODS method for such purposes.
According to our data, the projection that contributed more to KAP values was the PA projection. This can be attributed to the fact that this was the preferred projection of the operators. Actually, as we have previously shown, the LAO projection is responsible for more radiation dose per unit time of exposure.29
The risk for fatal cancer calculated here for the patients is low, particularly when considered in the context of the benefits of a successful electrophysiological and ablation procedure. Regarding medical personnel, the dose received per procedure was also found to be relatively small. Significant reductions in staff doses may be achieved using protective shielding.
Study limitations
The main limitation of our study is that all cases were performed in a modern electrophysiological laboratory by an experienced operator with a high workload and exposure to all kinds of ablation procedures. Secondly, our study has a relatively small number of patients. Thirdly, the majority of cases was not pulmonary vein isolation that currently represents the most demanding ablation procedure. This might explain differences from other reports. Thus, our results may not be valid for other electrophysiological laboratories and for operators being at the steep part of their learning curves.
Acknowledging these limitations, we conclude that as far as radiation exposure is concerned, electrophysiological studies followed by RF ablation should be considered safe procedures for both patient and personnel when performed in catheterization laboratories with modern equipment, experienced operators, and standard safety precautions. Still, optimization of protection should be constantly sought through continuous review of procedures, conducting regular measurements that make the operators aware of their performance and producing data that allow comparison with practice elsewhere.
