


Abstract
The aim of this analysis was to provide comprehensive information on invasive cardiac arrhythmia therapies in the European Society of Cardiology (ESC) area over the past 10 years.
The European Heart Rhythm Association (EHRA) has collected data on invasive arrhythmia therapies since 2008. This year 53 of the 56 ESC member countries provided data for the EHRA White Book. Here we present updated data on procedure rates together with information on demographics, economy, vital statistics, local healthcare systems and training activities. Considerable heterogeneity in the access to invasive arrhythmia therapies still exists across the five geographical ESC regions. In 2016, the device implantation rates per million population were 3-6 times higher in the Western region than in the non-European and Eastern ESC member countries. Catheter ablation activity was highest in the Western countries followed by the Northern and Southern areas. In the non-European countries, atrial fibrillation ablation rate was more than tenfold lower than in the European countries. On the other hand, the growth rate over the past ten years was highest in the non-European and Eastern countries. In some Eastern European countries with relative low gross domestic product the procedure rates exceeded the average values.
It was encouraging to note that during the past decade the growth in invasive arrhythmia therapies was greatest in the areas historically with relatively low activity. Nevertheless, there is substantial disparity and continued efforts are needed to improve harmonization of cardiac arrhythmia therapies in the ESC area.
What’s new?
This is the first time that 10-year trends in the rate of CIED implantations and catheter ablation procedures in the ESC member countries have been presented in detail.
The procedure rates per million population are highest in the Western countries followed by the Northern and Southern European countries.
Current procedure rates are lower in the non-European and Eastern European ESC member countries, but growth rate over the past ten years was highest in these areas.
Key areas of growth are in ablation of ventricular arrhythmias in patients with structural heart disease and novel therapeutic modalities such as left atrial appendage closure devices, leadless pacemakers and subcutaneous implantable defibrillators.
The data will form a steady backbone for future strategic initiatives to harmonise arrhythmia therapies in the ESC area.
Introduction
Access to reliable and up-to-date data on the use and availability of invasive electrophysiological procedures plays an important role in recognising and gaps in cardiac arrhythmia care in the European Society of Cardiology (ESC) area. The European Heart Rhythm Association (EHRA) has collected comprehensive data on the rates of invasive electrophysiology procedures and device implantations along with information on demographics, economy, vital statistics and healthcare resources and reimbursements policies together with the National Cardiac Societies and Working Groups for ten years (1). In 2017 53 of the 56 ESC member countries provided data for the EHRA White Book (2). The participation rate was higher than ever and covered around 95% of the ESC area population.
This year we celebrate the ten-year anniversary of the EHRA White Book. The project was initially overseen by Prof Christian Wolpert and Prof Panos Vardas in 2008. Like in the past (3–7) the main objectives of this auxiliary analysis of the EHRA White Book data were to deliver up-to-date information on the rates of invasive arrhythmia therapies in the ESC area, and to provide each country an opportunity to view its data in a larger context. In order to facilitate detection of potential cross-national disparities and gaps in the rates of cardiac implantable electronic device (CIED) implantations and catheter ablation procedures the statistics for the four geographical European ESC regions (Figure 1) and for the non-European ESC member countries are presented separately. This time we have provided unique data on trends in device implantation and ablation rates over the past ten years. The data presented in this article will be augmented by the launch of a website showing complete 10-year data for each country and allowing even more detailed comparisons between different countries and regions (www.ehra-whitebook-analysis.com).
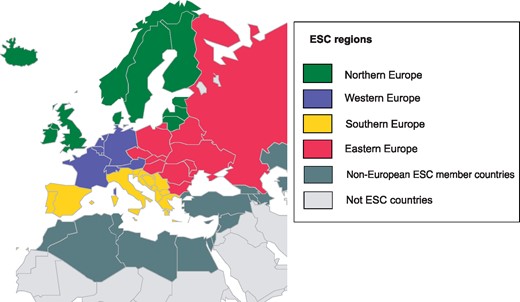
Geographic representation of the 56 European Society of Cardiology (ESC) member countries. The European regions were composed according to the UN Statistics Division (http://unstats.un.org/unsd/methods/m49/m49regin.htm).
Comprehensive information on the contemporary status of invasive arrhythmia therapies and the ability to directly compare the numbers at the ESC level will provide physicians, health care administrators and policy makers in each country with robust means to demonstrate to the national authorities shortfalls in resource allocation, reimbursement and training requirements. It is our hope that these data will inspire national and international strategic initiatives and awareness activities to acquire more resources for cardiac arrhythmia management and eventually to harmonise arrhythmia care among the ESC member countries.
Methods
Every year the EHRA invites all ESC member countries to participate in the EHRA White Book project. Since 2008 detailed data on invasive electrophysiology procedures together with descriptive and quantitative information on the demographics and economic aspects as well as on the training of electrophysiologists in the constituent ESC member countries have been collected annually. This has been done by surveying the National Cardiac Societies and Arrhythmia Working Groups. After completion of the data collection in early May the national societies or working groups were asked to crosscheck and authorise publication of the information at the Europace congress. In addition, this year all National Cardiac Societies received a copy of the previously reported data, and they were asked to correct potential inaccuracies and to add missing values.
The data on demographics, economy, vital statistics and healthcare resources in each country were acquired from the latest available edition of the World Health Organization (WHO) health statistics (8).
In 2016 a total of 1 087 259 488 people lived in the ESC member countries. After excluding those countries that did not report data it was calculated that in 2016 the EHRA White Book data collection covered 96.1% of the population for pacemaker implantations, 96.1% for implantable cardioverter defibrillator (ICD) implantations, 95.2% for cardiac resynchronisation therapies, 94.5% for catheter ablations and 94.4% for atrial fibrillation (AF) ablations, respectively.
This analysis is based on current and past editions of the EHRA White Book. It provides up-to-date information on the rates of the CIED implantations and catheter ablation procedures in the ESC member countries over the past 10 years. The data presented in this article will be further enhanced on the EHRA White Book website (www.ehra-whitebook-analysis.com). On the website, the complete ten-year data are presented for each country in a format that allows more detailed comparisons between different countries and regions.
Demographics and general societal and economic aspects
The ESC member countries are a heterogeneous group of nations with varying political, financial and demographic characteristics. Distribution of the population within these regions over the last 10 years is shown in Table 1. During this decade, the population in the ESC member countries increased by 5.5% (approximately 57 million people). The population growth was highest in the non-European ESC member countries and lowest in the Eastern region.
Populations in the five geographical European Society of Cardiology regions in 2007-2016
| Region | Country | ISO code | 2007 | 2008 | 2009 | 2010 | 2011 | 2012 | 2013 | 2014 | 2015 | 2016 |
|---|---|---|---|---|---|---|---|---|---|---|---|---|
| Northern Europe | Denmark | DK | 5 461 199 | 5 489 022 | 5 519 441 | 5 515 575 | 5 529 888 | 5 543 453 | 5 556 452 | 5 569 077 | 5 581 503 | 5 593 785 |
| Estonia | EE | 1 341 672 | 1 340 675 | 1 340 271 | 1 291 170 | 1 282 963 | 1 274 709 | 1 266 375 | 1 257 921 | 1 265 420 | 1 258 545 | |
| Finland | FI | 5 288 720 | 5 313 399 | 5 338 871 | 5 255 068 | 5 259 250 | 5 262 930 | 5 266 114 | 5 268 799 | 5 476 922 | 5 498 211 | |
| Iceland | IS | 311 396 | 319 355 | 319 246 | 308 910 | 311 058 | 313 183 | 315 281 | 317 351 | 331 918 | 335 878 | |
| Ireland | IE | 4 339 026 | 4 422 077 | 4 459 305 | 4 622 917 | 4 670 976 | 4 722 028 | 4 775 982 | 4 832 765 | 4 892 305 | 4 952 473 | |
| Latvia | LV | 2 276 100 | 2 266 094 | 2 254 834 | 2 083 703 | 2 204 708 | 2 191 580 | 2 178 443 | 2 165 165 | 1 986 705 | 1 965 686 | |
| Lithuania | LT | 3 375 618 | 3 358 114 | 3 339 455 | 3 545 319 | 3 535 547 | 3 525 761 | 3 515 858 | 3 505 738 | 2 884 433 | 2 854 235 | |
| Norway | NO | 4 709 153 | 4 768 212 | 4 828 726 | 4 676 305 | 4 691 849 | 5 000 000 | 5 085 582 | 5 147 792 | 5 207 689 | 5 265 158 | |
| Sweden | SE | 9 148 092 | 9 219 638 | 9 298 515 | 9 074 055 | 9 088 728 | 9 103 788 | 9 647 386 | 9 723 809 | 9 801 616 | 9 880 604 | |
| United Kingdom | GB | 60 975 356 | 61 383 156 | 61 791 956 | 62 348 447 | 62 698 362 | 63 047 162 | 63 395 574 | 63 742 977 | 64 088 222 | 64 430 428 | |
| Northern Europe total | 97 226 331 | 97 879 742 | 98 490 619 | 98 721 469 | 99 273 329 | 99 984 594 | 101 003 047 | 101 531 394 | 101 516 733 | 102 035 003 | ||
| Western Europe | Austria | AT | 8 315 379 | 8 336 549 | 8 363 040 | 8 214 160 | 8 217 280 | 8 219 743 | 8 221 646 | 8 223 062 | 8 665 550 | 8 711 770 |
| Belgium | BE | 10 625 701 | 10 480 393 | 10 646 804 | 10 423 493 | 10 431 477 | 10 438 353 | 10 444 268 | 10 449 361 | 11 323 973 | 11 409 077 | |
| France | FR | 61 963 276 | 62 130 520 | 62 342 668 | 64 768 389 | 65 102 719 | 65 630 692 | 65 951 611 | 66 259 012 | 66 553 766 | 66 836 154 | |
| Germany | DE | 82 262 640 | 82 119 776 | 81 874 768 | 81 644 454 | 81 471 834 | 81 305 856 | 81 147 265 | 80 996 685 | 80 854 408 | 80 722 792 | |
| Luxembourg | LU | 479 994 | 488 650 | 486 181 | 497 538 | 503 302 | 509 074 | 514 862 | 520 672 | 570 252 | 582 291 | |
| Netherlands | NL | 16 381 696 | 16 445 594 | 16 445 593 | 16 783 092 | 16 653 734 | 16 730 632 | 16 805 037 | 16 877 351 | 16 947 904 | 17 016 967 | |
| Switzerland | CH | 7 551 117 | 7 512 123 | 7 567 659 | 7 623 438 | 7 639 961 | 7 925 517 | 7 996 026 | 8 061 516 | 8 121 830 | 8 179 294 | |
| Western Europe total | 187 579 803 | 187 513 605 | 187 726 713 | 189 954 564 | 190 020 307 | 190 759 867 | 191 080 715 | 191 387 659 | 193 037 683 | 193 458 345 | ||
| Eastern Europe | Belarus | BY | 9 702 116 | 9 680 841 | 9 665 120 | 9 612 632 | 9 577 552 | 9 643 566 | 9 625 888 | 9 608 058 | 9 498 364 | 9 570 376 |
| Bulgaria | BG | 7 659 764 | 7 623 395 | 7 585 131 | 7 148 785 | 7 093 635 | 7 037 935 | 6 981 642 | 6 924 716 | 7 186 893 | 7 144 653 | |
| Czech Republic | CZ | 10 322 689 | 10 429 692 | 10 491 492 | 10 201 707 | 10 190 213 | 10 177 300 | 10 609 762 | 10 627 448 | 10 644 842 | 10 660 932 | |
| Hungary | HU | 10 055 780 | 10 038 188 | 10 022 650 | 9 992 339 | 9 976 062 | 9 958 453 | 9 939 470 | 9 919 128 | 9 897 541 | 9 874 784 | |
| Moldova | MD | 3 855 442 | 3 811 763 | 3 770 698 | 3 731 799 | 3 694 121 | 3 656 843 | 3 619 925 | 3 583 288 | 3 546 847 | 3 510 485 | |
| Poland | PL | 38 115 968 | 38 115 908 | 38 153 388 | 38 463 689 | 38 441 588 | 38 415 284 | 38 383 809 | 38 346 279 | 38 562 189 | 38 523 261 | |
| Romania | RO | 21 537 564 | 21 504 442 | 21 469 960 | 21 959 278 | 21 904 551 | 21 848 504 | 21 790 479 | 21 729 871 | 21 666 350 | 21 599 736 | |
| Russian Federation | RU | 142 114 912 | 141 956 416 | 141 909 248 | 139 390 205 | 138 739 892 | 142 517 670 | 142 500 482 | 142 470 272 | 142 423 773 | 142 355 415 | |
| Slovakia | SK | 5 397 766 | 5 406 972 | 5 418 374 | 5 470 306 | 5 477 038 | 5 483 088 | 5 488 339 | 5 492 677 | 5 415 949 | 5 445 802 | |
| Ukraine | UA | 46 465 620 | 46 077 832 | 45 872 976 | 45 415 596 | 45 134 707 | 45 416 589 | 44 573 205 | 44 291 413 | 44 429 471 | 44 209 733 | |
| Eastern Europe total | 295 227 621 | 294 645 449 | 294 359 037 | 291 386 336 | 290 229 359 | 294 155 232 | 293 513 001 | 292 993 150 | 293 272 219 | 292 895 177 | ||
| Southern Europe | Albania | AL | 3 152 625 | 3 181 949 | 3 194 417 | 3 204 000 | 2 994 667 | 3 002 859 | 3 011 405 | 3 020 209 | 3 029 278 | 3 038 594 |
| Bosnia & Herzegovina | BA | 3 768 032 | 3 842 265 | 3 838 161 | 4 621 598 | 4 622 163 | 3 879 296 | 3 875 723 | 3 871 643 | 3 867 055 | 3 861 912 | |
| Croatia | HR | 4 435 982 | 4 434 508 | 4 429 078 | 4 486 881 | 4 483 804 | 4 480 043 | 4 475 611 | 4 470 534 | 4 464 844 | 4 313 707 | |
| Greece | GR | 11 192 849 | 11 237 068 | 11 282 751 | 10 749 943 | 10 760 136 | 10 767 827 | 10 772 967 | 10 775 557 | 10 775 643 | 10 773 253 | |
| Italy | IT | 59 375 288 | 59 832 180 | 60 192 696 | 60 748 965 | 61 016 804 | 61 261 254 | 61 482 297 | 61 680 122 | 61 855 120 | 62 007 540 | |
| Kosovo | XK | 1 785 477 | 1 794 984 | 1 804 838 | 1 815 048 | 1 825 632 | 1 836 529 | 1 847 708 | 1 859 203 | 1 870 981 | 1 883 018 | |
| FYR Macedonia | MK | 2 043 559 | 2 039 961 | 2 042 485 | 2 072 086 | 2 077 328 | 2 082 370 | 2 087 171 | 2 091 719 | 2 096 015 | 2 100 025 | |
| Malta | MT | 409 092 | 412 001 | 413 290 | 406 771 | 408 333 | 409 836 | 411 277 | 412 655 | 413 965 | 415 196 | |
| Montenegro | ME | 626 189 | 628 804 | 631 536 | 666 730 | 661 807 | 657 394 | 653 474 | 650 036 | 647 073 | 644 578 | |
| Portugal | PT | 10 608 335 | 10 622 412 | 10 632 482 | 10 735 765 | 10 760 305 | 10 781 459 | 10 799 270 | 10 813 834 | 10 825 309 | 10 833 816 | |
| San Marino | SM | 32 055 | 28 775 | 28 976 | 31 477 | 31 817 | 32 140 | 32 448 | 32 742 | 33 020 | 33 285 | |
| Serbia | RS | 7 381 579 | 7 350 222 | 7 320 807 | 7 344 847 | 7 310 555 | 7 276 604 | 7 243 007 | 7 209 764 | 7 176 794 | 7 143 921 | |
| Slovenia | SI | 2 019 406 | 2 039 399 | 2 042 335 | 2 003 136 | 2 000 092 | 1 996 617 | 1 992 690 | 1 988 292 | 1 983 412 | 1 978 029 | |
| Spain | ES | 45 236 004 | 45 983 169 | 46 367 550 | 46 505 963 | 46 736 257 | 46 766 403 | 46 593 236 | 47 737 941 | 48 146 134 | 48 563 476 | |
| Southern Europe total | 152 066 472 | 153 427 697 | 154 221 402 | 155 393 210 | 155 689 700 | 155 230 631 | 155 278 284 | 156 614 251 | 157 184 643 | 157 590 350 | ||
| Non-European ESC member countries | Algeria | DZ | 34 002 400 | 34 619 419 | 35 268 128 | 33 769 669 | 34 994 937 | 37 367 226 | 38 087 812 | 38 813 722 | 39 542 166 | 40 263 711 |
| Armenia | AM | 3 226 520 | 3 234 031 | 3 243 729 | 2 966 802 | 2 967 975 | 2 970 495 | 3 064 267 | 3 060 927 | 3 056 382 | 3 051 250 | |
| Azerbaijan | AZ | 9 015 038 | 9 111 089 | 9 206 777 | 9 301 673 | 9 397 279 | 9 493 600 | 9 590 159 | 9 686 210 | 9 780 780 | 9 872 765 | |
| Cyprus | CY | 841 353 | 793 007 | 803 147 | 1 102 677 | 1 120 489 | 1 138 071 | 1 155 403 | 1 172 458 | 1 189 197 | 1 205 575 | |
| Egypt | EG | 75 814 404 | 77 516 306 | 78 866 635 | 80 471 869 | 82 079 636 | 83 688 164 | 85 294 388 | 86 895 099 | 88 487 396 | 94 666 993 | |
| Georgia Republic of | GE | 4 388 400 | 4 383 750 | 4 410 900 | 4 600 825 | 4 585 874 | 4 570 934 | 4 942 157 | 4 935 880 | 4 931 226 | 4 928 052 | |
| Israel | IL | 7 180 115 | 7 308 795 | 7 485 600 | 7 353 985 | 7 473 052 | 7 590 758 | 7 707 042 | 7 821 850 | 8 049 314 | 8 174 527 | |
| Kazakhstan | KZ | 16 459 828 | 16 649 642 | 16 863 280 | 17 084 817 | 17 304 513 | 17 736 896 | 17 736 896 | 17 948 816 | 18 157 122 | 18 360 353 | |
| Kyrgyzstan | KGZ | 5 255 561 | 5 298 689 | 5 358 180 | 5 410 468 | 5 450 776 | 5 496 737 | 5 548 042 | 5 604 212 | 5 957 300 | 5 727 553 | |
| Lebanon | LB | 4 334 429 | 4 424 106 | 4 475 008 | 4 125 247 | 4 143 101 | 4 140 289 | 4 131 583 | 4 136 895 | 6 184 701 | 6 237 738 | |
| Libya | LY | 5 786 146 | 5 894 108 | 6 002 252 | 6 173 579 | 6 597 960 | 5 613 380 | 6 002 347 | 6 244 174 | 6 411 776 | 6 541 948 | |
| Morocco | MA | 30 594 445 | 30 940 455 | 31 285 174 | 31 627 428 | 31 968 361 | 32 309 239 | 32 649 130 | 33 478 299 | 33 322 699 | 33 655 786 | |
| Syria | SY | 20 543 421 | 21 180 801 | 21 389 802 | 22 198 110 | 22 517 750 | 22 530 746 | 22 457 336 | 22 597 531 | 17 064 854 | 17 185 170 | |
| Tunisia | TN | 10 212 857 | 10 315 836 | 10 420 551 | 10 525 041 | 10 629 186 | 10 732 900 | 10 835 873 | 10 937 521 | 11 037 225 | 11 134 588 | |
| Turkey | TR | 70 586 256 | 71 517 100 | 72 561 312 | 73 722 988 | 74 724 269 | 75 627 384 | 76 667 864 | 77 695 904 | 78 741 053 | 80 274 604 | |
| Non-European ESC member countries total | 298 241 173 | 303 187 134 | 307 640 475 | 310 435 178 | 315 955 158 | 321 006 819 | 325 870 299 | 331 029 498 | 331 913 191 | 341 280 613 | ||
| Total ESC member countries | 1 030 341 400 | 1 036 653 627 | 1 042 438 246 | 1 045 890 757 | 1 051 167 853 | 1 061 137 143 | 1 066 745 346 | 1 073 555 952 | 1 076 924 469 | 1 087 259 488 | ||
Vital statistics and gross domestic product
Population and vital statistics and gross domestic product (GDP) in the 56 ESC member countries are presented in Table 2. Total GDP ranged from 1.56 (San Marino) to 3495 (Germany) trillion US dollars (USD). The GDP per capita was more than 100 times higher in Luxembourg (105 829 USD) than in Kyrgyzstan (956 USD).
Population, vital statistics and gross domestic product (GDP) in the 56 ESC member countries.
| Country | Population | Population growth rate (%) | Life expectancy at birth (years) | Death rate per 1000 population | GDP (x 1000 billion USD) | GDP per capita (USD) | Total health expenditure as % of GDP |
|---|---|---|---|---|---|---|---|
| Albania | 3 038 594 | 0.31 | 78.3 | 5.40 | 12.14 | 4 210 | 5.88 |
| Algeria | 40 263 711 | 1.82 | 76.8 | N/A | 168.32 | 4 129 | N/A |
| Armenia | 3 051 250 | −0.17 | 74.6 | 9.20 | 10.75 | 3 596 | 4.48 |
| Austria | 8 711 770 | 0.53 | 81.5 | 9.20 | 387.30 | 44 561 | 11.21 |
| Azerbaijan | 9 872 765 | 0.94 | 72.5 | 5.90 | 35.69 | 3 759 | 6.04 |
| Belarus | 9 570 376 | 0.76 | 72.7 | 12.80 | 48.13 | 5 092 | 5.69 |
| Belgium | 11 409 077 | 0.75 | 81.0 | 9.80 | 470.18 | 41 491 | 10.59 |
| Bosnia & Herzegovina | 3 861 912 | −0.13 | 76.7 | 9.40 | 16.53 | 4 289 | 9.57 |
| Bulgaria | 7 144 653 | −0.59 | 74.5 | 14.40 | 50.45 | 7 091 | 8.44 |
| Croatia | 4 313 707 | −3.39 | 75.9 | 12.00 | 49.86 | 11 858 | 7.80 |
| Cyprus | 1 205 575 | 1.38 | 78.7 | 6.10 | 19.93 | 23 425 | 7.37 |
| Czech Republic | 10 660 932 | 0.15 | 78.6 | 10.00 | 193.54 | 18 326 | 7.41 |
| Denmark | 5 593 785 | 0.22 | 79.4 | 9.30 | 302.57 | 53 243 | 10.80 |
| Egypt | 94 666 993 | 6.98 | 72.7 | N/A | N/A | N/A | N/A |
| Estonia | 1 258 545 | −0.54 | 76.7 | 11.80 | 23.48 | 17 896 | 6.38 |
| Finland | 5 498 211 | 0.39 | 80.9 | 9.60 | 239.19 | 43 492 | 9.68 |
| France | 66 836 154 | 0.42 | 81.8 | 8.70 | 2 488.28 | 38 537 | 11.54 |
| Georgia Republic of | 4 928 052 | −0.06 | 76.2 | 13.20 | 14.46 | 3 908 | 7.42 |
| Germany | 80 722 792 | −0.16 | 80.7 | 10.70 | 3 494.90 | 42 326 | 11.30 |
| Greece | 10 773 253 | −0.02 | 80.5 | 10.50 | 195.88 | 18 078 | 8.08 |
| Hungary | 9 874 784 | −0.23 | 75.9 | 12.80 | 117.07 | 11 903 | 7.40 |
| Iceland | 335 878 | 1.19 | 83.0 | 6.30 | 19.44 | 57 889 | 8.86 |
| Ireland | 4 952 473 | 1.23 | 80.8 | 6.40 | 307.92 | 65 871 | 7.78 |
| Israel | 8 174 527 | 1.56 | 82.4 | 5.20 | 311.74 | 36 557 | 7.81 |
| Italy | 62 007 540 | 0.25 | 82.2 | 10.30 | 1 852.50 | 30 294 | 9.25 |
| Kazakhstan | 18 360 353 | 1.12 | 70.8 | 7.50 | 128.11 | 7 138 | 4.36 |
| Kosovo | 1 883 018 | 0.64 | 71.6 | N/A | 6.56 | N/A | N/A |
| Kyrgyzstan | 5 727 553 | −3.86 | 70.7 | 5.80 | 5.79 | 956 | 6.48 |
| Latvia | 1 965 686 | −1.06 | 74.5 | 14.10 | 27.95 | 14 141 | 5.88 |
| Lebanon* | 6 237 738 | 0.86 | 77.6 | N/A | 51.82 | 11 271 | N/A |
| Libya* | 6 541 948 | 2.03 | 76.5 | N/A | 39.39 | 6 169 | N/A |
| Lithuania | 2 854 235 | −1.05 | 74.9 | 13.70 | 42.78 | 14 899 | 6.55 |
| Luxembourg | 582 291 | 2.11 | 82.3 | 6.70 | 60.98 | 105 829 | 6.94 |
| FYR Macedonia | 2 100 025 | 0.30 | 76.2 | 9.30 | 10.49 | 5 060 | 9.75 |
| Malta | 415 196 | −0.39 | 80.4 | 7.70 | 10.46 | 24 298 | 6.42 |
| Moldova | 3 510 485 | 1.00 | 70.7 | 11.10 | 6.65 | 1 872 | N/A |
| Montenegro | 644 578 | 0.41 | 78.6 | 9.30 | 4.24 | 6 809 | 10.90 |
| Morocco | 33 655 786 | 1.10 | 76.9 | N/A | 104.91 | 3 101 | 9.72 |
| Netherlands | 17 016 967 | −0.10 | 81.3 | 8.40 | 769.93 | 45 210 | 6.35 |
| Norway | 5 265 158 | 0.08 | 81.8 | 7.90 | 376.27 | 71 497 | 9.50 |
| Poland | 38 523 261 | −1.03 | 77.6 | 9.90 | 467.35 | 12 309 | 10.32 |
| Portugal | 10 833 816 | −0.31 | 79.3 | 10.20 | 205.86 | 19 759 | 5.57 |
| Romania | 21 599 736 | −0.05 | 75.1 | 11.40 | 186.51 | 9 439 | 7.07 |
| Russian Federation | 142 355 415 | 0.80 | 70.8 | 13.50 | 1 267.75 | 8 838 | 6.13 |
| San Marino | 33 285 | −0.46 | 83.3 | 7.30 | 1.56 | 49 579 | 10.37 |
| Serbia | 7 143 921 | 0.55 | 75.5 | 14.20 | 37.76 | 5 294 | 8.05 |
| Slovakia | 5 445 802 | −0.27 | 77.1 | 9.50 | 90.26 | 16 648 | 9.23 |
| Slovenia | 1 978 029 | 0.87 | 78.2 | 9.10 | 44.12 | 21 370 | 9.03 |
| Spain | 48 563 476 | 0.81 | 81.7 | 8.50 | 1 252.16 | 27 012 | 11.93 |
| Sweden | 9 880 604 | 0.71 | 82.1 | 9.20 | 517.44 | 51 604 | 11.66 |
| Switzerland | 8 179 294 | 0.71 | 82.6 | 8.00 | 662.48 | 79 578 | N/A |
| Syria* | 17 185 170 | 0.19 | 74.9 | N/A | N/A | N/A | 6.48 |
| Tunisia | 11 134 588 | 0.88 | 76.1 | N/A | 42.39 | 3 777 | N/A |
| Turkey | 80 274 604 | 1.95 | 74.8 | 4.70 | 735.72 | 9 317 | 5.41 |
| Ukraine | 44 209 733 | −0.49 | 71.8 | 14.80 | 87.20 | 2 052 | 7.10 |
| United Kingdom | 64 430 428 | 0.53 | 80.7 | 9.00 | 2 649.89 | 40 412 | 9.12 |
These 3 countries did not submit any data for the EHRA White Book 2017.
Reasonably high-quality data on cause of death are available in most ESC member countries, although they are lacking in many other parts of the world. World Health Organization (WHO) health statistics from 2014 revealed several important differences in the vital statistics between the ESC member countries (8). For example, the life expectancy at birth varied from 70.7 years (Kyrgyzstan and Moldova) to 83.3 years (San Marino). The death rate per 1000 population was lowest in Turkey (4.70%) and highest in Ukraine (14.80%). It is noteworthy that in most countries with life expectancy over 80 years, the GDP per capita is also relatively high (Table 2).
Healthcare systems
The organisation of healthcare across the ESC member countries is heterogeneous. Many countries provide national healthcare services with full coverage to the whole population while in others healthcare services are primarily delivered by commercial health insurance companies (Table 3). The proportion on people with no health insurance was highest in the Eastern European and non-European ESC member countries. In the Northern, Southern and Western European ESC member countries, patients do not need to provide any co-payment for invasive electrophysiology procedures, whereas in many Eastern European (e.g., Armenia, Azerbaijan, Romania) and non-European ESC member countries (e.g., Egypt, Georgia, Kyrgyzstan and Turkey) a co-payment is necessary for all invasive electrophysiology procedures (Table 3).
Healthcare service and insurance systems in the 56 ESC member countries
| Distribution of insurance | Co-payment necessary | ||||||||
|---|---|---|---|---|---|---|---|---|---|
| modality (%) | for therapies | ||||||||
| Country | Basic insurance availability | Uninsured citizens (% of population) | Public insurance | Private insurance | Private co-payment | Possibility to subscribe to private health insurance plans | ICD | PM | Ablation |
| Albania | Yes | 0 | 100 | N/A | 0 | Yes | No | No | Yes |
| Algeria | Yes | 30 | 100 | N/A | N/A | Yes | No | Yes | No |
| Armenia | No | 68 | 33 | 64 | 3 | Yes | Yes | Yes | Yes |
| Austria | Yes | 1 | 70 | 0 | 30 | Yes | No | No | No |
| Azerbaijan | Yes | N/A | N/A | N/A | N/A | Yes | Yes | Yes | Yes |
| Belarus | Yes | 0 | 100 | N/A | N/A | Yes | No | No | No |
| Belgium | Yes | 1 | 90 | 0 | 10 | Yes | No | No | Yes |
| Bosnia & Herzegovina | No | 25 | 75 | N/A | 25 | No | Yes | Yes | N/A |
| Bulgaria | Yes | 17.7 | 80.78 | N/A | 0.72 | Yes | Yes | No | Yes |
| Croatia | Yes | 10 | 90 | 5 | 5 | Yes | No | No | No |
| Cyprus | No | 15 | 85 | 15 | 0 | Yes | No | No | No |
| Czech Republic | Yes | 0.1 | 99 | 1 | 0 | No | No | No | No |
| Denmark | Yes | 0 | 100 | 0 | 0 | Yes | No | No | No |
| Egypt | No | 35 | 64 | 1 | 35 | Yes | Yes | Yes | Yes |
| Estonia | No | 5 | N/A | N/A | N/A | N/A | No | No | No |
| Finland | Yes | 0 | 75.6 | 3 | 21.4 | Yes | No | No | No |
| France | Yes | 0 | 100 | N/A | N/A | No | No | No | No |
| Georgia Republic of | Yes | N/A | N/A | N/A | N/A | Yes | Yes | Yes | Yes |
| Germany | Yes | 1 | 87 | 11 | 2 | Yes | No | No | No |
| Greece | Yes | 30 | 85 | 10 | 5 | Yes | No | No | No |
| Hungary | Yes | 1 | 99 | 1 | 0 | Yes | No | No | No |
| Iceland | Yes | 0 | 100 | 0 | 0 | No | No | No | No |
| Ireland | Yes | 0 | 54 | 46 | 0 | Yes | No | No | No |
| Israel | Yes | 0 | 100 | 0 | 0 | Yes | No | No | Yes |
| Italy | Yes | 0 | 100 | 0 | 0 | Yes | No | No | No |
| Kazakhstan | No | N/A | N/A | N/A | N/A | Yes | No | No | No |
| Kosovo | No | N/A | N/A | N/A | N/A | No | Yes | Yes | N/A |
| Kyrgyzstan | No | N/A | N/A | N/A | N/A | Yes | Yes | Yes | Yes |
| Latvia | Yes | 1 | 80 | 12 | 8 | Yes | Yes | Yes | No |
| Lebanon* | |||||||||
| Libya* | |||||||||
| Lithuania | Yes | 0 | 98 | 0 | 2 | Yes | No | No | No |
| Luxembourg | Yes | 0 | 100 | N/A | N/A | Yes | No | No | No |
| FYR Macedonia | Yes | 10 | 80 | 10 | 10 | Yes | No | No | No |
| Malta | Yes | 0 | N/A | N/A | N/A | Yes | No | No | No |
| Moldova | Yes | 5 | 98 | 1.1 | 0.9 | Yes | No | No | No |
| Montenegro | Yes | 0 | 95 | 2 | 3 | Yes | No | No | No |
| Morocco | No | 40 | 80 | 19 | 1 | Yes | N/A | No | No |
| Netherlands | Yes | 0 | 0 | 100 | 0 | Yes | No | No | No |
| Norway | Yes | 0 | 99 | 0 | 1 | Yes | No | No | No |
| Poland | Yes | N/A | N/A | N/A | N/A | Yes | No | No | No |
| Portugal | Yes | 0 | 100 | 0 | 0 | Yes | No | No | No |
| Romania | Yes | N/A | 100 | N/A | N/A | No | Yes | Yes | Yes |
| Russian Federation | Yes | N/A | 90 | 7 | 3 | Yes | No | Yes | No |
| San Marino | Yes | 0 | 100 | 0 | 0 | Yes | No | No | No |
| Serbia | Yes | 5 | 90 | 5 | 5 | Yes | No | No | No |
| Slovakia | Yes | 0 | 70 | 30 | 0 | No | No | No | No |
| Slovenia | Yes | 1 | 4 | 0 | 96 | N/A | No | No | No |
| Spain | Yes | 1 | 79 | 5 | 16 | Yes | Yes | Yes | No |
| Sweden | Yes | 0 | 100 | 0 | N/A | Yes | No | No | No |
| Switzerland | Yes | 10 | 0 | 0 | 100 | Yes | No | No | No |
| Syria* | |||||||||
| Tunisia | Yes | 30 | 90 | 10 | 0 | Yes | No | No | Yes |
| Turkey | Yes | 1 | 99 | 1 | N/A | Yes | Yes | Yes | Yes |
| Ukraine | No | N/A | N/A | N/A | N/A | Yes | No | No | No |
| United Kingdom | No | 95 | 89 | 11 | 0 | Yes | No | No | No |
These 3 countries did not submit data for the EHRA White Book 2017.
The number of hospitals and hospital beds available for healthcare are shown in Figure 2. The number of the hospitals and hospital beds were highest in Cyprus and Belarus, respectively. The number of hospitals and beds were not associated with the financial profile of the countries or healthcare expenditure. Rather, these data indicate that some countries have directed more resources towards hospital care than ambulatory and home care. For example, the number of beds per 100 000 inhabitants was 823 in Germany and only 254 in Sweden, despite the relatively high GDP and healthcare expenditure in both countries.
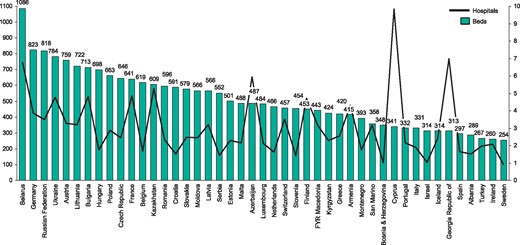
Hospitals and hospital beds per 100 000 inhabitants in the ESC member countries.
A national institution to coordinate and guide device recalls was present in 15 of the participating ESC member countries, whereas in 38 (72%) countries it was not available (Figure 3).
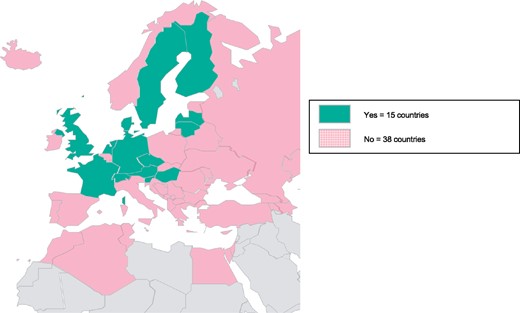
Availability of national institution to coordinate and guide device recalls in the ESC member countries in 2016.
Healthcare expenditure
Healthcare expenditure nowadays represents the biggest government spending item in many countries. In Figure 4 the healthcare expenditure is presented as percentage of the national GDP and in Figure 5 as expenditure per capita. The mean healthcare expenditure in the ESC area as percentage of the GDP was 8.3%. It was highest in the Russian Federation (11.9%) and lowest in the Israel (4.4%).
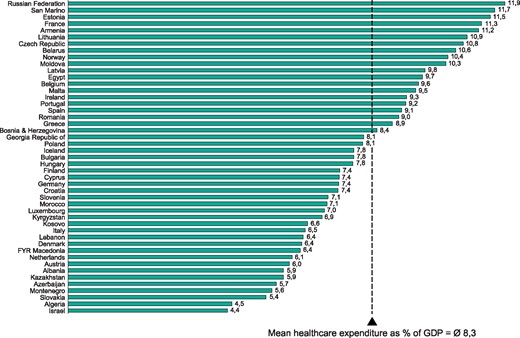
Healthcare expenditure as percentage of national gross domestic product (GDP) in the ESC member countries in 2014. The mean healthcare expenditure as % of GDP is weighted by population.
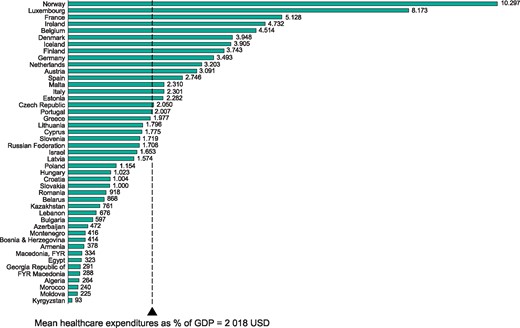
Healthcare expenditure per capita in the ESC member countries in 2014. Mean number of expenditure is weighted by population.
The health care expenditure per capita was highest in Norway (10 297 USD) and lowest in Kyrgyzstan (93 USD). Hence, there was more than 100-fold difference between the lowest and the highest healthcare expenditure per capita in the ESC area. Given the trend towards a progressive aging of populations and less healthy lifestyles, there is pressure to increase the healthcare expenditure. Despite this, the mean healthcare expenditure per capita in the ESC area was lower in 2014 (2018 USD) than in 2013 (2733 USD).
Certification of professional excellence
General information
Fifty-one (91% of the ESC member countries) and 50 (89%) countries provided data on certification of physicians in device therapy and invasive electrophysiology, respectively (2). A national certification program for CIED therapy and invasive cardiac electrophysiology (EP) was available in 25 (45% of the ESC member countries) of these countries. Certification was an obligatory practice requirement for CIED therapy in 10 countries and for EP in 12 countries, respectively (Figure 6 and 7). A national certification for allied professionals was available in 17 countries and certification was required for practice in 11 countries (Figure 8).
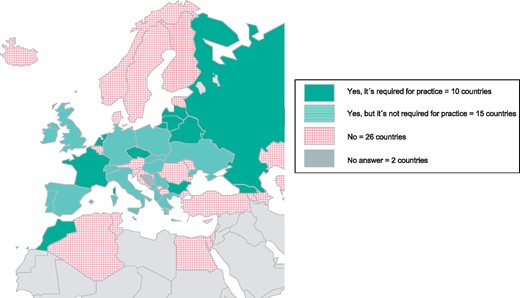
Certification for cardiac implantable electronic device (CIED) therapy in the ESC member countries in 2016.
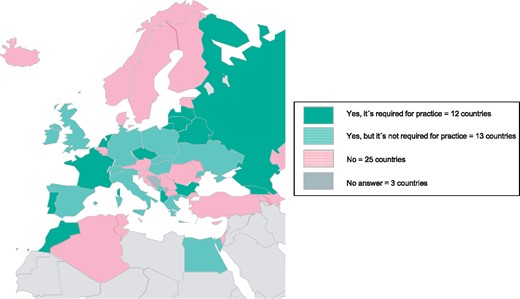
Certification for invasive electrophysiology in the ESC member countries in 2016.
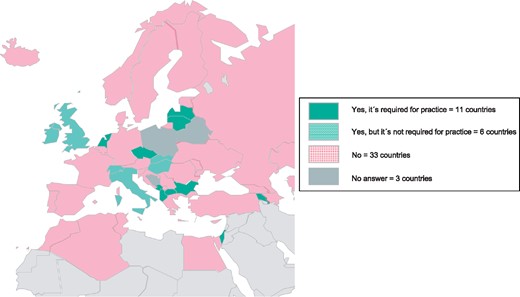
Certification for allied professionals in the ESC member countries in 2016.
Training centres were accredited in 17 countries, but certification of training centres was mandatory to train fellows in only 13 countries (Figure 9). Several centres in various regions were available as training centres for the EHRA Training Fellowship Program and allowed many young physicians from emerging economies to be trained in high volume centres abroad.
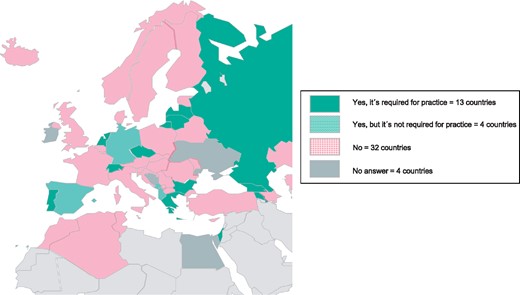
Certification for training centres in the ESC member countries in 2016.
EHRA certification
The EHRA certification program plays a key role in EHRA's goal to promote unified and clear standards for the training of cardiac rhythm management specialists and to assure high-quality arrhythmia care across the ESC area. The requirements for the certification (Level 2) are passing the EHRA exam and completion of the EHRA logbook of interventional procedures/operations. The certification is valid for 10 years.
In 2016, 106 physicians from 32 countries participated in the EP exam, and 158 physicians from 32 countries in the CIED exam. Most them were male (84% in the EP exam and 75% in the CIED exam). The pass rate was 83% in the invasive EP examination was and 58% in the CIED examination. The highest number of candidates participating in the CIED and EP exam were from the Netherlands (24 candidates) and Germany (11), respectively. Over the past ten years 848 physicians from 59 countries have participated in the EP exam and 1271 in the CIED exam (Figure 10). Of them 495 have passed the EP exam (58%) and 830 have passed the CIED exam (65%), respectively. A total of 279 and 384 physicians have achieved full (Level 2) certification in the EP and in the CIED program, respectively.
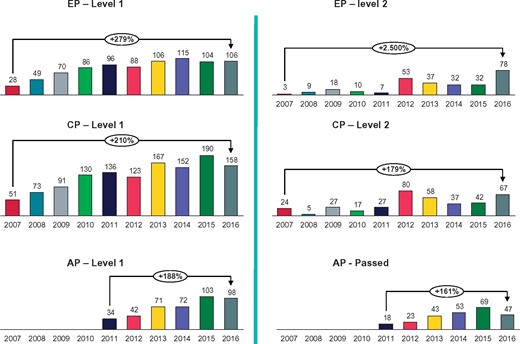
The number of individuals who have participated in the EHRA exam (level 1 certification) and those who have achieved full certification (level 2) over the past 10 years.
The EHRA certification program for allied professionals (AP) in cardiac pacing and implantable cardioverter defibrillators was launched in 2011. Since then 420 APs from 19 countries have participated in the EHRA examination and 253 of them have been certified (60%). Last year the pass rate in the AP exam was 48%, which was markedly lower than 2015 (67%). Like in the past, the highest number of participants were from the Netherlands. The AP examination is currently available in four languages (English, Dutch, German and Italian).
Pacemakers
General information
The 52 countries (93% of the ESC member countries) which submitted the requested data on pacemaker (PM) implantation for this year's edition of the EHRA White Book are listed in Table 4. Lebanon, Libya and Syria did not provide any data and Belgium only provided data on the number of the PM implantation facilities. A national registry for PM implantations was available in 22 (39%) of the ESC member countries (Table 4). The vast majority of implants were performed by cardiologists, and the remaining implantations were performed by physicians with various training backgrounds, including surgeons, anaesthesiologists, paediatricians, and internists. In four countries (Belarus, Kyrgyzstan, Slovenia, and Ukraine) the proportion of implanting cardiologists was less than 50% (Table 5).
Pacemaker (PM) implantation facilities and implantation rates in 2016 and comparison with four previous years
| Number of PM | Development potential - target | PM implantations | |||||||||||
|---|---|---|---|---|---|---|---|---|---|---|---|---|---|
| implanting centres 2016 | PM implantations 2016 | number of PM implantations | per million inhabitants | ||||||||||
| Country | ISO code | National Registry for PM implants | Absolute number | Per million inhabitants | Absolute number | Per million inhabitants | To attain mean ESC area level | To attain mean EU- 28 level | 2012 | 2013 | 2014 | 2015 | 2016 |
| Albania | AL | No | 6 | 2 | 440 | 145 | 1 591 | 2 753 | N/A | N/A | 44 | N/A | 145 |
| Algeria | DZ | No | 19 | 0 | 3 248 | 81 | 21 081 | 36 483 | N/A | 65 | 65 | 74 | 81 |
| Armenia | AM | No | 3 | 1 | 188 | 62 | 1 598 | 2 765 | 74 | 31 | 42 | 38 | 62 |
| Austria | AT | Yes | 72 | 8 | 7 567 | 869 | – | 7 894 | 957 | 967 | 1 006 | 912 | 869 |
| Azerbaijan | AZ | No | 6 | 1 | 452 | 46 | 5 169 | 8 946 | N/A | 14 | 19 | 40 | 46 |
| Belarus | BY | No | 10 | 1 | 3 005 | 314 | 5 011 | 8 672 | 275 | 292 | 309 | 332 | 314 |
| Belgium* | BE | Yes | 104 | 9 | N/A | N/A | N/A | N/A | 1 224 | 1 237 | 1 235 | 1 110 | N/A |
| Bosnia & Herzegovina | BA | No | 6 | 2 | 1 008 | 261 | 2 022 | 3 499 | 234 | 224 | 215 | 221 | 261 |
| Bulgaria | BG | Yes | 20 | 3 | 3 816 | 534 | – | 6 474 | 448 | 503 | 538 | 550 | 534 |
| Croatia | HR | No | 17 | 4 | 2 740 | 635 | – | 3 909 | 561 | 540 | 582 | 639 | 635 |
| Cyprus | CY | No | 6 | 5 | 290 | 241 | 631 | 1 092 | 211 | 216 | 213 | 235 | 241 |
| Czech Republic | CZ | Yes | 37 | 3 | 9 311 | 873 | – | 9 660 | 899 | 887 | 889 | 843 | 873 |
| Denmark | DK | Yes | 15 | 3 | 4 899 | 876 | – | 5 068 | 841 | 850 | 866 | 863 | 876 |
| Egypt | EG | No | 33 | 0 | 4 428 | 47 | 49 564 | 85 777 | 30 | 33 | 38 | 40 | 47 |
| Estonia | EE | No | 5 | 4 | 1 006 | 799 | – | 1 140 | 748 | 912 | 838 | 857 | 799 |
| Finland | FI | No | 20 | 4 | 6 180 | 1 124 | – | – | 990 | 1 020 | 1 051 | 1 063 | 1 124 |
| France | FR | No | 453 | 7 | 69 042 | 1 033 | – | – | 958 | 945 | 958 | 961 | 1 033 |
| Georgia Rebublic of | GE | No | 15 | 3 | 849 | 172 | 2 580 | 4 465 | 102 | 125 | 123 | 166 | 172 |
| Germany | DE | Yes | 1 200 | 15 | 110 100 | 1 364 | – | – | 1 311 | 1 152 | 1 152 | 1 320 | 1 364 |
| Greece | GR | Yes | 56 | 5 | 9 400 | 873 | – | 9 762 | 691 | 724 | 742 | 817 | 873 |
| Hungary | HU | Yes | 18 | 2 | 6 424 | 651 | – | 8 947 | 607 | 618 | 645 | 650 | 651 |
| Iceland | IS | No | 2 | 6 | 322 | 959 | – | – | 967 | 996 | 939 | 928 | 959 |
| Ireland | IE | N/A | 17 | 3 | 2 290 | 462 | 2 593 | 4 487 | 451 | 479 | N/A | 465 | 462 |
| Israel | IL | No | 20 | 2 | 4 200 | 514 | 4 280 | 7 407 | 558 | 515 | 537 | 490 | 514 |
| Italy | IT | Yes | 434 | 7 | 65 100 | 1 050 | – | – | 1 001 | 1 012 | 1 029 | 1 055 | 1 050 |
| Kazakhstan | KZ | No | 28 | 2 | 1 964 | 107 | 9 613 | 16 636 | 69 | 84 | 131 | 99 | 107 |
| Kosovo | XK | N/A | 3 | 2 | 46 | 24 | 986 | 1 706 | N/A | N/A | 68 | 65 | 24 |
| Kyrgyzstan | KGZ | No | 3 | 1 | 92 | 16 | 2 999 | 5 190 | N/A | N/A | 22 | 21 | 16 |
| Latvia | LV | Yes | 3 | 2 | 1 228 | 625 | – | 1 781 | 548 | 591 | 571 | 705 | 625 |
| Lebanon* | LB | N/A | N/A | N/A | N/A | N/A | N/A | N/A | N/A | 218 | 218 | N/A | N/A |
| Libya* | LY | N/A | N/A | N/A | N/A | N/A | N/A | N/A | N/A | N/A | N/A | N/A | N/A |
| Lithuania | LT | No | 5 | 2 | 2 588 | 907 | – | – | 756 | 772 | 789 | 895 | 907 |
| Luxembourg | LU | No | 4 | 7 | 404 | 694 | – | 528 | 621 | 365 | 670 | 689 | 694 |
| FYR Macedonia | MK | No | 3 | 1 | 403 | 192 | 1 099 | 1 903 | 166 | 154 | 170 | 224 | 192 |
| Malta | MT | No | 1 | 2 | 427 | 1 028 | – | – | 644 | 552 | 887 | 966 | 1 028 |
| Moldova | MD | Yes | 2 | 1 | 317 | 90 | 1 838 | 3 181 | N/A | 79 | N/A | N/A | 90 |
| Montenegro | ME | No | 1 | 2 | 320 | 496 | 337 | 584 | 218 | 312 | 280 | 382 | 496 |
| Morocco | MA | N/A | 12 | 0 | 1 823 | 54 | 17 621 | 30 495 | 38 | 34 | 44 | 54 | 54 |
| Netherlands | NL | Yes | 85 | 5 | 10 000 | 588 | – | 15 419 | 560 | 605 | 600 | 590 | 588 |
| Norway | NO | Yes | 22 | 4 | 3 908 | 742 | – | 4 771 | 691 | 680 | 755 | 791 | 742 |
| Poland | PL | No | 147 | 4 | 30 295 | 786 | – | 34 906 | 716 | 716 | 742 | 791 | 786 |
| Portugal | PT | No | 43 | 4 | 9 613 | 887 | – | 9 816 | 825 | 814 | 817 | 810 | 887 |
| Romania | RO | No | 24 | 1 | 5 161 | 239 | 11 309 | 19 571 | 144 | 110 | 196 | 181 | 239 |
| Russian Federation | RU | Yes | 142 | 1 | 36 462 | 256 | 74 532 | 128 987 | 212 | 244 | 266 | 284 | 256 |
| San Marino | SM | Yes | 0 | 0 | 21 | 631 | – | 30 | 809 | 431 | 367 | 333 | 631 |
| Serbia | RS | Yes | 16 | 2 | 3 004 | 420 | 3 740 | 6 473 | 431 | 546 | 507 | 519 | 420 |
| Slovakia | SK | Yes | 14 | 3 | 3 776 | 693 | – | 4 934 | 567 | 630 | 606 | 677 | 693 |
| Slovenia | SI | Yes | 9 | 5 | 1 620 | 819 | – | 1 792 | 668 | 646 | 736 | 623 | 819 |
| Spain | ES | Yes | 230 | 5 | 37 466 | 771 | – | 44 003 | 758 | 782 | 761 | 803 | 771 |
| Sweden | SE | Yes | 43 | 4 | 9 378 | 949 | – | – | 1 041 | 995 | 969 | 947 | 949 |
| Switzerland | CH | Yes | 71 | 9 | 6 601 | 807 | – | 7 411 | 753 | 767 | 815 | 786 | 807 |
| Syria* | SY | N/A | N/A | N/A | N/A | N/A | N/A | N/A | N/A | N/A | N/A | N/A | N/A |
| Tunisia | TN | No | 19 | 2 | 2 700 | 242 | 5 830 | 10 089 | 233 | 240 | 201 | 231 | 242 |
| Turkey | TR | No | 245 | 3 | 9 993 | 124 | 42 029 | 72 736 | N/A | N/A | 94 | 117 | 124 |
| Ukraine | UA | No | 38 | 1 | 5 444 | 123 | 23 147 | 40 058 | 121 | 148 | 119 | 109 | 123 |
| United Kingdom | GB | Yes | 215 | 3 | 46 227 | 717 | – | 58 380 | 615 | 702 | 708 | 719 | 717 |
| Total ESC member countries | 56 | 4 022 | 3.80 | 547 586 | 524 | 553 | 554 | 564 | 589 | 592 | |||
These 4 countries did not submit any data on PM implantations for the EHRA White Book 2017.
Specialty of physicians performing device implantations and lead extraction
| Specialist performing | Specialist performing | Specialist performing | Specialist performing loop | Specialist performing | ||||||||||||
|---|---|---|---|---|---|---|---|---|---|---|---|---|---|---|---|---|
| PM implantations (%) | ICD implantations (%) | CRT implantations (%) | recorder implantations (%) | lead extractions (%) | ||||||||||||
| Country | ISO code | Cardiologists | Surgeons | Other | Cardiologists | Surgeons | Other | Cardiologists | Surgeons | Other | Cardiologists | Surgeons | Other | Cardiologists | Surgeons | Other |
| Albania | AL | 95 | 5 | 0 | 100 | 0 | 0 | 100 | 0 | 0 | 0 | 0 | 0 | 100 | 0 | 0 |
| Algeria | DZ | 95 | 5 | 0 | 100 | 0 | 0 | 100 | 0 | 0 | 100 | 0 | 0 | 60 | 40 | 0 |
| Armenia | AM | 100 | 0 | 0 | 100 | 0 | 0 | 100 | 0 | 0 | 100 | 0 | 0 | 100 | 0 | 0 |
| Austria | AT | 50 | 50 | 0 | 50 | 50 | 0 | 66 | 33 | 0 | 80 | 20 | 0 | 20 | 80 | 0 |
| Azerbaijan | AZ | 50 | 50 | 0 | 100 | 0 | 0 | 100 | 0 | 0 | 100 | 0 | 0 | 100 | 0 | 0 |
| Belarus | BY | 0 | 100 | 0 | 0 | 100 | 0 | 0 | 100 | 0 | 0 | 100 | 0 | 0 | 100 | 0 |
| Belgium | BE | N/A | N/A | N/A | N/A | N/A | N/A | N/A | N/A | N/A | N/A | N/A | N/A | N/A | N/A | N/A |
| Bosnia & Herzegovina | BA | 90 | 10 | 0 | 100 | 0 | 0 | 100 | 0 | 0 | 100 | 0 | 0 | N/A | N/A | N/A |
| Bulgaria | BG | 98 | 2 | 0 | 100 | 0 | 0 | 100 | 0 | 0 | 100 | 0 | 0 | 100 | 0 | 0 |
| Croatia | HR | 93 | 7 | 0 | 97 | 3 | 0 | 100 | 0 | 0 | 100 | 0 | 0 | N/A | N/A | N/A |
| Cyprus | CY | 100 | 0 | 0 | 100 | 0 | 0 | 100 | 0 | 0 | 100 | 0 | 0 | 100 | 0 | 0 |
| Czech Republic | CZ | 95 | 5 | 0 | 98 | 2 | 0 | 98 | 2 | 0 | 100 | 0 | 0 | N/A | N/A | N/A |
| Denmark | DK | 100 | 0 | 0 | 100 | 0 | 0 | 100 | 0 | 0 | 100 | 0 | 0 | 90 | 10 | 0 |
| Egypt | EG | 70 | 0 | 30 | 80 | 0 | 20 | 70 | 0 | 30 | 50 | 0 | 50 | 80 | 0 | 20 |
| Estonia | EE | 100 | 0 | 0 | 100 | 0 | 0 | 100 | 0 | 0 | 100 | 0 | 0 | 100 | 0 | 0 |
| Finland | FI | 90 | 5 | 5 | 100 | 0 | 0 | 100 | 0 | 0 | 100 | 0 | 0 | 100 | 0 | 0 |
| France | FR | 95 | 5 | 0 | 100 | 0 | 0 | 100 | 0 | 0 | 100 | 0 | 0 | 95 | 5 | 0 |
| Georgia Rebublic of | GE | 95 | 5 | 0 | 99 | 1 | 0 | 99 | 1 | 0 | 100 | 0 | 0 | 100 | 0 | 0 |
| Germany | DE | 68 | 20 | 12 | 67 | 21 | 12 | N/A | N/A | N/A | N/A | N/A | N/A | 18 | 82 | 0 |
| Greece | GR | 99 | 1 | 0 | 98 | 2 | 0 | 98 | 2 | 0 | 100 | 0 | 0 | 90 | 10 | 0 |
| Hungary | HU | 95 | 5 | 0 | 97 | 3 | 0 | 97 | 3 | 0 | 100 | 0 | 0 | N/A | N/A | N/A |
| Iceland | IS | 70 | 30 | 0 | 60 | 40 | 0 | 100 | 0 | 0 | 100 | 0 | 0 | 0 | 0 | 100 |
| Ireland | IE | 100 | 0 | 0 | 100 | 0 | 0 | 100 | 0 | 0 | 100 | 0 | 0 | 40 | 60 | 0 |
| Israel | IL | 100 | 0 | 0 | 100 | 0 | 0 | 100 | 0 | 0 | 100 | 0 | 0 | 98 | 2 | 0 |
| Italy | IT | 100 | 0 | 0 | 100 | 0 | 0 | 100 | 0 | 0 | 100 | 0 | 0 | N/A | N/A | N/A |
| Kazakhstan | KZ | N/A | N/A | N/A | N/A | N/A | N/A | N/A | N/A | N/A | N/A | N/A | N/A | N/A | N/A | N/A |
| Kosovo | XK | 100 | 0 | 0 | 100 | 0 | 0 | 100 | 0 | 0 | N/A | N/A | N/A | N/A | N/A | N/A |
| Kyrgyzstan | KGZ | 0 | 100 | 0 | N/A | N/A | N/A | 0 | 100 | 0 | 0 | 100 | 0 | 0 | 100 | 0 |
| Latvia | LV | 70 | 30 | 0 | 70 | 30 | 0 | 70 | 30 | 0 | 70 | 30 | 0 | 0 | 100 | 0 |
| Lebanon* | LB | N/A | N/A | N/A | N/A | N/A | N/A | N/A | N/A | N/A | N/A | N/A | N/A | N/A | N/A | N/A |
| Libya* | LY | N/A | N/A | N/A | N/A | N/A | N/A | N/A | N/A | N/A | N/A | N/A | N/A | N/A | N/A | N/A |
| Lithuania | LT | 99 | 1 | 0 | 100 | 0 | 0 | 100 | 0 | 0 | 100 | 0 | 0 | 100 | 0 | 0 |
| Luxembourg | LU | 90 | 10 | 0 | 95 | 5 | 0 | 95 | 5 | 0 | 100 | 0 | 0 | 10 | 90 | 0 |
| FYR Macedonia | MK | 100 | 0 | 0 | 100 | 0 | 0 | 100 | 0 | 0 | 100 | 0 | 0 | 50 | 50 | 0 |
| Malta | MT | 100 | 0 | 0 | 100 | 0 | 0 | 100 | 0 | 0 | 100 | 0 | 0 | 100 | 0 | 0 |
| Moldova | MD | 100 | 0 | 0 | 100 | 0 | 0 | N/A | N/A | N/A | N/A | N/A | N/A | N/A | N/A | N/A |
| Montenegro | ME | 67 | 33 | 0 | 70 | 30 | 0 | 100 | 0 | 0 | 50 | 50 | 0 | 50 | 50 | 0 |
| Morocco | MA | 98 | 2 | 0 | 99 | 1 | 0 | 100 | 0 | 0 | N/A | N/A | N/A | 100 | 0 | 0 |
| Netherlands | NL | 95 | 2 | 3 | 95 | 3 | 2 | 97 | 3 | 0 | 85 | 5 | 10 | 90 | 10 | 0 |
| Norway | NO | 99.6 | 0.4 | 0 | 99.6 | 0.4 | 0 | 95 | 5 | 0 | 100 | 0 | 0 | 100 | 0 | 0 |
| Poland | PL | 99 | 1 | 0 | 99 | 1 | 0 | 99 | 1 | 0 | 100 | 0 | 0 | 99 | 1 | 0 |
| Portugal | PT | 100 | 0 | 0 | 100 | 0 | 0 | 100 | 0 | 0 | 100 | 0 | 0 | 90 | 10 | 0 |
| Romania | RO | 100 | 0 | 0 | 100 | 0 | 0 | 100 | 0 | 0 | 100 | 0 | 0 | 100 | 0 | 0 |
| Russian Federation | RU | 80 | 18 | 2 | 70 | 30 | 0 | 60 | 40 | 0 | N/A | N/A | N/A | N/A | N/A | N/A |
| San Marino | SM | 100 | 0 | 0 | 100 | 0 | 0 | 100 | 0 | 0 | 100 | 0 | 0 | 100 | 0 | 0 |
| Serbia | RS | 100 | 0 | 0 | 100 | 0 | 0 | 100 | 0 | 0 | 100 | 0 | 0 | 90 | 10 | 0 |
| Slovakia | SK | 98 | 2 | 0 | 99 | 1 | 0 | 100 | 0 | 0 | 100 | 0 | 0 | 99 | 1 | 0 |
| Slovenia | SI | 30 | 70 | 0 | 58 | 42 | 0 | 89 | 11 | 0 | 83 | 17 | 0 | 0 | 100 | 0 |
| Spain | ES | 72 | 24 | 4 | 92 | 8 | 0 | 98 | 2 | 0 | 100 | 0 | 0 | 30 | 70 | 0 |
| Sweden | SE | 51 | 25 | 21 | 68 | 15 | 10 | N/A | N/A | N/A | N/A | N/A | N/A | N/A | N/A | N/A |
| Switzerland | CH | 97 | 3 | 0 | 97 | 3 | 0 | 100 | 0 | 0 | 100 | 0 | 0 | 90 | 10 | 0 |
| Syria* | SY | N/A | N/A | N/A | N/A | N/A | N/A | N/A | N/A | N/A | N/A | N/A | N/A | N/A | N/A | N/A |
| Tunisia | TN | 100 | 0 | 0 | 100 | 0 | 0 | 100 | 0 | 0 | 100 | 0 | 0 | 75 | 25 | 0 |
| Turkey | TR | 95 | 5 | 0 | 99 | 1 | 0 | 97 | 3 | 0 | 100 | 0 | 0 | 75 | 25 | 0 |
| Ukraine | UA | 10.5 | 89.5 | 0 | 25 | 75 | 0 | 10 | 90 | 0 | 30 | 70 | 0 | 0 | 100 | 0 |
| United Kingdom | GB | 100 | 0 | 0 | 100 | 0 | 0 | 100 | 0 | 0 | 99 | 0 | 1 | 100 | 0 | 0 |
These 3 countries did not submit data for the EHRA White Book 2017.
PM facilities and procedure rate
In 2016 a total of 547 586 PMs were implanted in 4022 centres across the ESC area (Table 4). The mean number of centres implanting PMs per million inhabitants was 3.80 approximately the same as in the preceding year (3.85) (Figure 11). Countries with the highest density of implanting facilities were Germany (14.9 per million in habitants), Belgium (9.1) and Switzerland (8.7) and those with the lowest density were Egypt and Morocco. The changes in the number of implanting centres from 2015 to 2016 are shown in Table 6 and Figure 12.
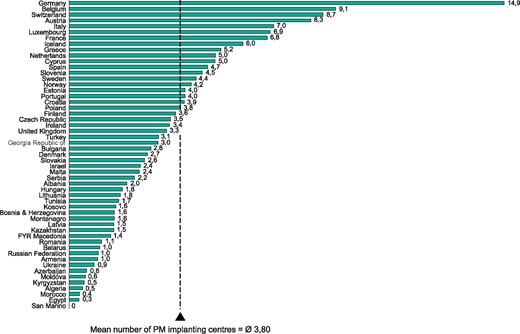
Number of pacemaker (PM) implanting centres per million inhabitants in the ESC member countries in 2016. The mean number of implantation centres is weigthed by population.
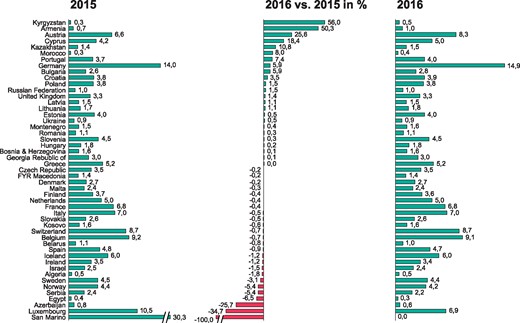
Change in the number of pacemaker implanting centres per million inhabitants from 2015 to 2016.
Changes in the number of pacemaker (PM) implantation centres from 2015 to 2016
| Number of PM | Number of PM | |||||
|---|---|---|---|---|---|---|
| implanting centres 2015 | implanting centres 2016 | |||||
| Country | ISO code | Absolute number | Per million inhabitants | Absolute number | Per million inhabitants | Change % |
| Albania | AL | N/A | N/A | 6 | 1.97 | N/A |
| Algeria | DZ | 19 | 0.48 | 19 | 0.47 | −1.8% |
| Armenia | AM | 2 | 0.65 | 3 | 0.98 | 50.3% |
| Austria | AT | 57 | 6.58 | 72 | 8.26 | 25.6% |
| Azerbaijan | AZ | 8 | 0.82 | 6 | 0.61 | −25.7% |
| Belarus | BY | 10 | 1.05 | 10 | 1.04 | −0.8% |
| Belgium | BE | 104 | 9.18 | 104 | 9.12 | −0.7% |
| Bosnia & Herzegovina | BA | 6 | 1.55 | 6 | 1.55 | 0.1% |
| Bulgaria | BG | 19 | 2.64 | 20 | 2.80 | 5.9% |
| Croatia | HR | 17 | 3.81 | 17 | 3.94 | 3.5% |
| Cyprus | CY | 5 | 4.20 | 6 | 4.98 | 18.4% |
| Czech Republic | CZ | 37 | 3.48 | 37 | 3.47 | −0.2% |
| Denmark | DK | 15 | 2.69 | 15 | 2.68 | −0.2% |
| Egypt | EG | 33 | 0.37 | 33 | 0.35 | −6.5% |
| Estonia | EE | 5 | 3.95 | 5 | 3.97 | 0.5% |
| Finland | FI | 20 | 3.65 | 20 | 3.64 | −0.4% |
| France | FR | 453 | 6.81 | 453 | 6.78 | −0.4% |
| Georgia Rebublic of | GE | 15 | 3.04 | 15 | 3.04 | 0.1% |
| Germany | DE | 1 135 | 14.04 | 1 200 | 14.87 | 5.9% |
| Greece | GR | 56 | 5.20 | 56 | 5.20 | 0.0% |
| Hungary | HU | 18 | 1.82 | 18 | 1.82 | 0.2% |
| Iceland | IS | 2 | 6.03 | 2 | 5.95 | −1.2% |
| Ireland | IE | 17 | 3.47 | 17 | 3.43 | −1.2% |
| Israel | IL | 20 | 2.48 | 20 | 2.45 | −1.5% |
| Italy | IT | 435 | 7.03 | 434 | 7.00 | −0.5% |
| Kazakhstan | KZ | 25 | 1.38 | 28 | 1.53 | 10.8% |
| Kosovo | XK | 3 | 1.60 | 3 | 1.59 | −0.6% |
| Kyrgyzstan | KGZ | 2 | 0.34 | 3 | 0.52 | 56.0% |
| Latvia | LV | 3 | 1.51 | 3 | 1.53 | 1.1% |
| Lebanon* | LB | N/A | N/A | N/A | N/A | N/A |
| Libya* | LY | N/A | N/A | N/A | N/A | N/A |
| Lithuania | LT | 5 | 1.73 | 5 | 1.75 | 1.1% |
| Luxembourg | LU | 6 | 10.52 | 4 | 6.87 | −34.7% |
| FYR Macedonia | MK | 3 | 1.43 | 3 | 1.43 | −0.2% |
| Malta | MT | 1 | 2.42 | 1 | 2.41 | −0.3% |
| Moldova | MD | N/A | N/A | 2 | 0.57 | N/A |
| Montenegro | ME | 1 | 1.55 | 1 | 1.55 | 0.4% |
| Morocco | MA | 11 | 0.33 | 12 | 0.36 | 8.0% |
| Netherlands | NL | 85 | 5.02 | 85 | 5.00 | −0.4% |
| Norway | NO | 23 | 4.42 | 22 | 4.18 | −5.4% |
| Poland | PL | 145 | 3.76 | 147 | 3.82 | 1.5% |
| Portugal | PT | 40 | 3.70 | 43 | 3.97 | 7.4% |
| Romania | RO | 24 | 1.11 | 24 | 1.11 | 0.3% |
| Russian Federation | RU | 140 | 0.98 | 142 | 1.00 | 1.5% |
| San Marino | SM | 1 | 30.28 | 0 | 0.00 | −100.0% |
| Serbia | RS | 17 | 2.37 | 16 | 2.24 | −5.4% |
| Slovakia | SK | 14 | 2.58 | 14 | 2.57 | −0.5% |
| Slovenia | SI | 9 | 4.54 | 9 | 4.55 | 0.3% |
| Spain | ES | 230 | 4.78 | 230 | 4.74 | −0.9% |
| Sweden | SE | 44 | 4.49 | 43 | 4.35 | −3.1% |
| Switzerland | CH | 71 | 8.74 | 71 | 8.68 | −0.7% |
| Syria* | SY | N/A | N/A | N/A | N/A | N/A |
| Tunisia | TN | N/A | N/A | 19 | 1.71 | N/A |
| Turkey | TR | N/A | N/A | 245 | 3.05 | N/A |
| Ukraine | UA | 38 | 0.86 | 38 | 0.86 | 0.5% |
| United Kingdom | GB | 211 | 3.29 | 215 | 3.34 | 1.4% |
| Total ESC member countries | 3 660 | 3.85 | 4 022 | 3.80 | -1.2% | |
These 3 countries did not submit data for the EHRA White Book 2017
The mean PM implantation rate in the participating ESC member countries was slightly higher in 2016 than in 2015 (524 vs. 518 PM units per million inhabitants). As seen in Figures 13 and 14, where the ESC member countries are grouped into quartiles according to the number of PM implantations per million inhabitants, there was a marked heterogeneity in the PM implantation rate per million inhabitants in the ESC area. The implantation rate was highest in Germany (1364), followed by Finland (1124) and Italy (1050). The three countries with the lowest PM implantation rate were Kyrgyzstan (16), Kosovo (24) and Azerbaijan (46).
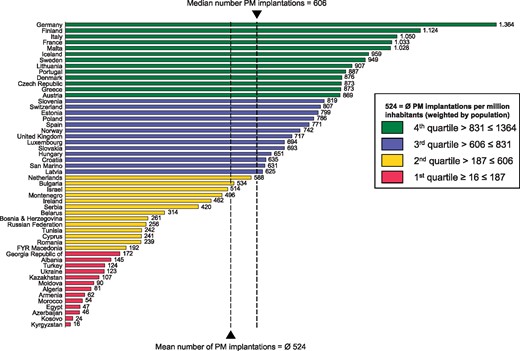
Pacemaker implantations per million inhabitants in the ESC member countries in 2016. The mean number of implantations is weigthed by population.
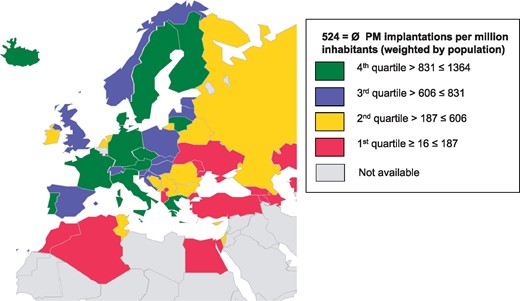
Pacemaker implantations per million inhabitants in the ESC member countries in 2016. The mean number of implantations is weighted by population.
The changes in the number of PM implantations per million inhabitants from 2015 to 2016 are shown in Table 7 and Figure 15, and a comparison to the previous four years in each country is shown in Table 4. The PM implantation rate decreased in 18 countries including some Western and Northern countries with high activities (e.g., United Kingdom, the Netherlands, Italy, Spain and Norway). The increase in the number of new PM implantations was highest in countries with rather small implant numbers (e.g., San Marino, Slovenia and Montenegro). The changes in the de novo PM implantations and PM replacements rate are shown in Figure 16 and Figure 17, respectively. The relationship between the mean annual PM implantation rate per million inhabitants and the number of PM implanting centres per million inhabitants in the ESC member countries and in the EU28 is shown in Figure 18.
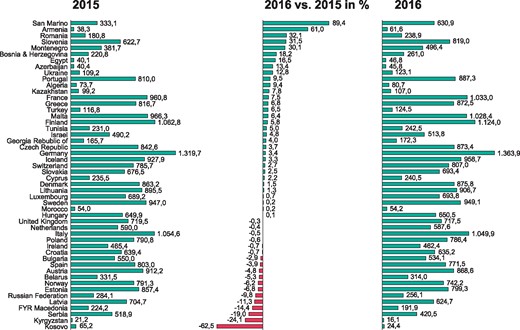
Change in the number of pacemaker implantations per million inhabitants from 2015 to 2016.
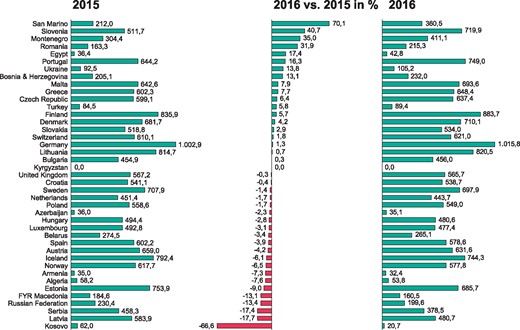
Change in the number of new pacemaker implantations per million inhabitants from 2015 to 2016.
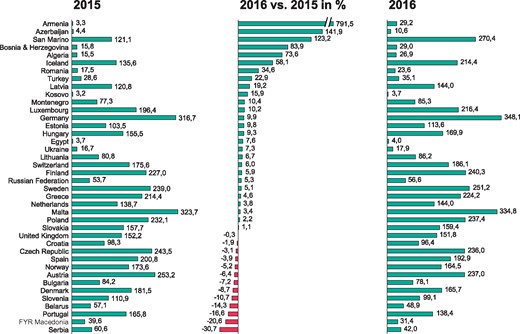
Change in the number of pacemaker replacements per million inhabitants from 2015 to 2016.
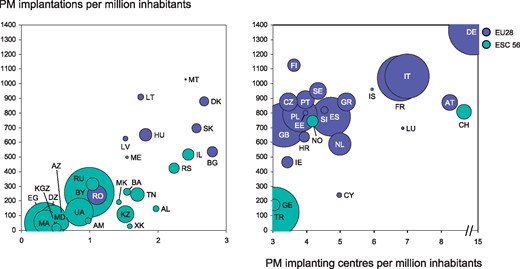
Pacemaker implantation centres and rates in the ESC and European Union (EU28) member countries in 2016. Bubble size is related to population in the country. The ISO codes of the countries are explained in Table 1.
Changes in pacemaker (PM) implantations from 2015 to 2016
| Number of PM | Number of PM | |||||
|---|---|---|---|---|---|---|
| implantations 2015 | implantations 2016 | |||||
| Country | ISO code | Absolute number | Per million inhabitants | Absolute number | Per million inhabitants | Change % |
| Albania | AL | N/A | N/A | 440 | 145 | N/A |
| Algeria | DZ | 2 915 | 74 | 3 248 | 81 | 9.4% |
| Armenia | AM | 117 | 38 | 188 | 62 | 61.0% |
| Austria | AT | 7 905 | 912 | 7 567 | 869 | −4.8% |
| Azerbaijan | AZ | 395 | 40 | 452 | 46 | 13.4% |
| Belarus | BY | 3 149 | 332 | 3 005 | 314 | −5.3% |
| Belgium* | BE | 12 572 | 1 110 | N/A | N/A | N/A |
| Bosnia & Herzegovina | BA | 854 | 221 | 1 008 | 261 | 18.2% |
| Bulgaria | BG | 3 953 | 550 | 3 816 | 534 | −2.9% |
| Croatia | HR | 2 855 | 639 | 2 740 | 635 | −0.7% |
| Cyprus | CY | 280 | 235 | 290 | 241 | 2.2% |
| Czech Republic | CZ | 8 969 | 843 | 9 311 | 873 | 3.7% |
| Denmark | DK | 4 818 | 863 | 4 899 | 876 | 1.5% |
| Egypt | EG | 3 552 | 40 | 4 428 | 47 | 16.5% |
| Estonia | EE | 1 085 | 857 | 1 006 | 799 | −6.8% |
| Finland | FI | 5 821 | 1 063 | 6 180 | 1 124 | 5.8% |
| France | FR | 63 946 | 961 | 69 042 | 1 033 | 7.5% |
| Georgia Rebublic of | GE | 817 | 166 | 849 | 172 | 4.0% |
| Germany | DE | 106 700 | 1 320 | 110 100 | 1 364 | 3.4% |
| Greece | GR | 8 800 | 817 | 9 400 | 873 | 6.8% |
| Hungary | HU | 6 432 | 650 | 6 424 | 651 | 0.1% |
| Iceland | IS | 308 | 928 | 322 | 959 | 3.3% |
| Ireland | IE | 2 277 | 465 | 2 290 | 462 | −0.7% |
| Israel | IL | 3 946 | 490 | 4 200 | 514 | 4.8% |
| Italy | IT | 65 234 | 1 055 | 65 100 | 1 050 | −0.5% |
| Kazakhstan | KZ | 1 801 | 99 | 1 964 | 107 | 7.8% |
| Kosovo | XK | 122 | 65 | 46 | 24 | −62.5% |
| Kyrgyzstan | KGZ | 126 | 21 | 92 | 16 | −24.1% |
| Latvia | LV | 1 400 | 705 | 1 228 | 625 | −11.3% |
| Lebanon* | LB | N/A | N/A | N/A | N/A | N/A |
| Libya* | LY | N/A | N/A | N/A | N/A | N/A |
| Lithuania | LT | 2 583 | 895 | 2 588 | 907 | 1.3% |
| Luxembourg | LU | 393 | 689 | 404 | 694 | 0.7% |
| FYR Macedonia | MK | 470 | 224 | 403 | 192 | −14.4% |
| Malta | MT | 400 | 966 | 427 | 1 028 | 6.4% |
| Moldova | MD | N/A | N/A | 317 | 90 | N/A |
| Montenegro | ME | 247 | 382 | 320 | 496 | 30.1% |
| Morocco | MA | 1 801 | 54 | 1 823 | 54 | 0.2% |
| Netherlands | NL | 10 000 | 590 | 10 000 | 588 | −0.4% |
| Norway | NO | 4 121 | 791 | 3 908 | 742 | −6.2% |
| Poland | PL | 30 494 | 791 | 30 295 | 786 | −0.6% |
| Portugal | PT | 8 769 | 810 | 9 613 | 887 | 9.5% |
| Romania | RO | 3 918 | 181 | 5 161 | 239 | 32.1% |
| Russian Federation | RU | 40 461 | 284 | 36 462 | 256 | −9.8% |
| San Marino | SM | 11 | 333 | 21 | 631 | 89.4% |
| Serbia | RS | 3 724 | 519 | 3 004 | 420 | −19.0% |
| Slovakia | SK | 3 664 | 677 | 3 776 | 693 | 2.5% |
| Slovenia | SI | 1 235 | 623 | 1 620 | 819 | 31.5% |
| Spain | ES | 38 662 | 803 | 37 466 | 771 | −3.9% |
| Sweden | SE | 9 282 | 947 | 9 378 | 949 | 0.2% |
| Switzerland | CH | 6 381 | 786 | 6 601 | 807 | 2.7% |
| Syria* | SY | N/A | N/A | N/A | N/A | N/A |
| Tunisia | TN | 2 550 | 231 | 2 700 | 242 | 5.0% |
| Turkey | TR | 9 200 | 117 | 9 993 | 124 | 6.5% |
| Ukraine | UA | 4 851 | 109 | 5 444 | 123 | 12.8% |
| United Kingdom | GB | 46 110 | 719 | 46 227 | 717 | −0.3% |
| Total ESC member countries | 550 476 | 529 | 547 586 | 524 | -1.0% | |
These 4 countries did not submit data on PM implantations for the EHRA White Book 2017.
Trends in PM implantation activity over the past 10 years
The number of PM implantations in the European and non-European ESC member countries over the entire EHRA White Book data collection period and comparison with the total ESC area and the 28 member countries of the European Union (EU28) are shown in Figure 19. The corresponding numbers for the European ESC regions are presented in Figure 20. In 2016 the rate of PM implantations was almost fourfold higher in the European ESC member countries, than in the non-European ESC member countries (759 vs 198). Within Europe the most active area was Western Europe with 1174 PM implantations per million population. The changes from 2007 to 2016 in the number of PM implanting centres for all participating countries are shown in Figure 21.
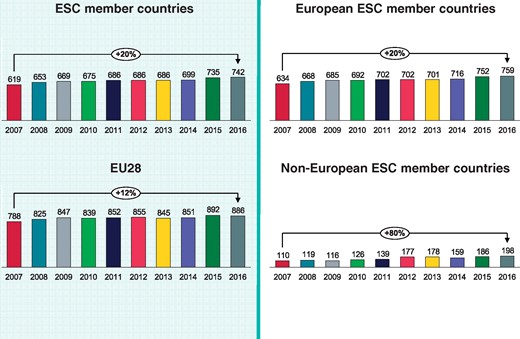
Pacemaker implantations per million inhabitants 2007-2016 in the European and non-European ESC member countries and comparison to the total ESC area and the 28 member countries of the European Union (EU28).
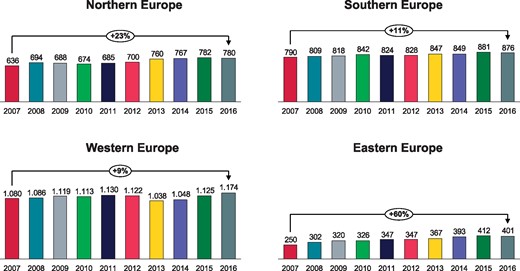
Pacemaker implantations per million inhabitants 2007-2016 in the four European ESC regions.
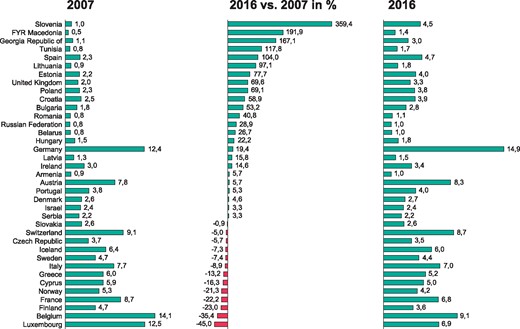
Change in the number of pacemaker implanting centres per million inhabitants from 2007 to 2016.
The growth in PM implantation rate per million population was highest in the non-European (80%) and Eastern European (60%) countries. In the Northern (23%), Southern (11%) and Western European region (9%), there was a small but steady growth in the number of PM implantations from 2007 to 2016. Countries with the highest and lowest activities in each region and trends over the ten-year period are shown in Figures 22-26. The changes from 2007 to 2016 in the number of PM implantations for all participating countries are shown in Figure 27. The most active countries in the five geographical ESC regions were Germany (1364 PM implantations per million inhabitants), Finland (1124), Italy (1050), Czech Republic (873), and Israel (514). Overall the growth in the PM implantation rates was small compared to the changes in other device therapies and catheter ablations which with a very few exceptions had more than 100% increases over the past 10 years.
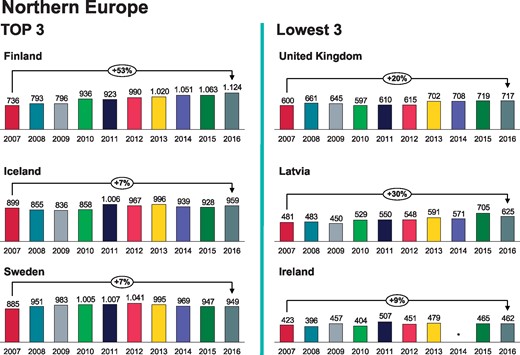
Pacemaker implantations per million inhabitants 2007-2016 in Northern Europe. *No data available.
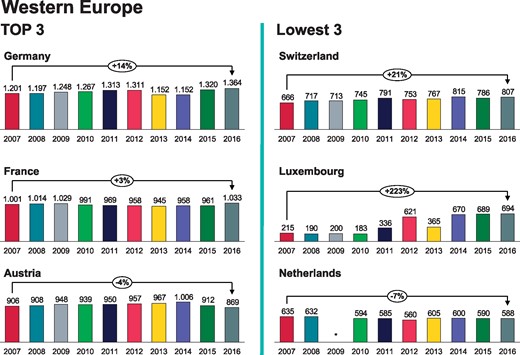
Pacemaker implantations per million inhabitants 2007-2016 in Western Europe. *No data available.
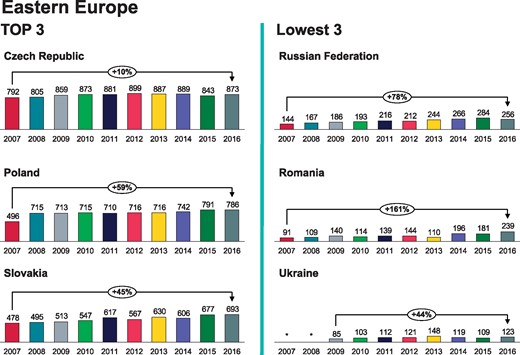
Pacemaker implantations per million inhabitants 2007-2016 in Eastern Europe. *No data available.
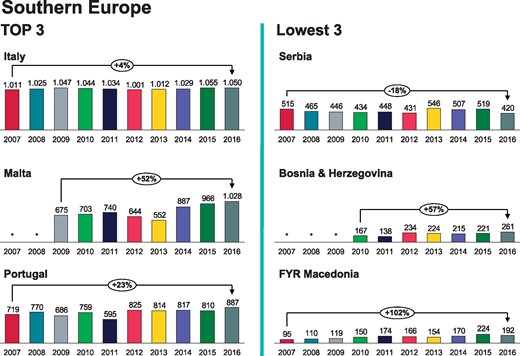
Pacemaker implantations per million inhabitants 2007-2016 in Southern Europe. *No data available.
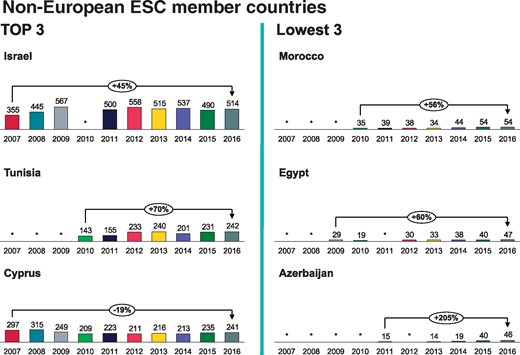
Pacemaker implantations per million inhabitants 2007-2016 in non-European ESC member countries. *No data available.
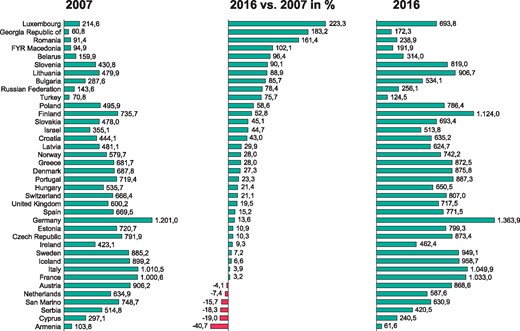
Change in the number of pacemaker implantations per million inhabitants from 2007 to 2016.
Leadless pacemakers
Leadless pacing, as an alternative to traditional pacing (9,10) has become available in a number of ESC member countries in the past few years. This was the second year that data on leadless pacemaker implantations was collected for the EHRA White Book. In 2016 a total of 1067 leadless pacemakers were implanted in 19 countries. This was about four times more than in 2015 (244). No leadless pacemakers were implanted in 21 countries, and data on these devices were not available from 16 ESC member countries. The most active countries in the ESC area with regards to leadless pacemaker implantations were Spain (182 implantations), Switzerland (167) and the Netherlands (150) (Figure 28).
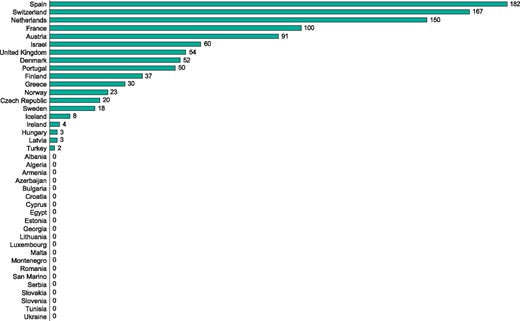
Number of leadless pacemaker implantations in 2016.
Implantable cardioverter defibrillators
General information
The data from the 52 countries (93%) which submitted data for the EHRA White Book on implantable cardioverter defibrillator (ICD) implantations in 2016 are listed in Table 8. Lebanon, Libya, and Syria did not provide any data and Belgium provided data only on ICD implantation facilities. In 22 countries, a national registry for ICD implantations was in use. Most of the ICD implantations were performed by cardiologists, and the remaining implantations were performed by physicians having various other training backgrounds, mainly surgical. However, in Austria, Belarus, and Ukraine, the proportion of implanting cardiologists was less than 50% (Table 5).
Implantable cardioverter-defibrillator (ICD) implantation facilities and rates in 2016 and comparison with four previous years
| Number of ICD implanting | ICD implantations | Development potential - target number of | ICD implantations per million | ||||||||||
|---|---|---|---|---|---|---|---|---|---|---|---|---|---|
| centres 2016 | 2016 | ICD implantations | inhabitants | ||||||||||
| Country | ISO code | National Registry for ICD implants | Absolute number | Per million inhabitants | Absolute number | Per million inhabitants | To attain mean ESC area level | To attain mean EU-28 level | 2012 | 2013 | 2014 | 2015 | 2016 |
| Albania | AL | No | 4 | 1.32 | 16 | 5 | 307 | 539 | N/A | N/A | 1 | N/A | 5 |
| Algeria | DZ | No | 9 | 0.22 | 67 | 2 | 4 070 | 7 146 | N/A | 1 | 2 | 2 | 2 |
| Armenia | AM | No | 3 | 0.98 | 37 | 12 | 308 | 542 | 11 | 9 | 8 | 7 | 12 |
| Austria | AT | Yes | 38 | 4.36 | 1 457 | 167 | – | 1 546 | 145 | 158 | 166 | 161 | 167 |
| Azerbaijan | AZ | No | 5 | 0.51 | 29 | 3 | 998 | 1 752 | N/A | 1 | 2 | 2 | 3 |
| Belarus | BY | No | 10 | 1.04 | 136 | 14 | 967 | 1 698 | 12 | 16 | 18 | 14 | 14 |
| Belgium* | BE | Yes | 23 | 2.02 | N/A | N/A | N/A | N/A | 210 | 163 | 154 | 135 | N/A |
| Bosnia & Herzegovina | BA | No | 6 | 1.55 | 56 | 15 | 390 | 685 | 14 | 17 | 14 | 22 | 15 |
| Bulgaria | BG | Yes | 10 | 1.40 | 73 | 10 | 722 | 1 268 | 7 | 5 | 7 | 7 | 10 |
| Croatia | HR | No | 14 | 3.25 | 412 | 96 | 436 | 766 | 26 | 35 | 39 | 87 | 96 |
| Cyprus | CY | No | 5 | 4.15 | 80 | 66 | 122 | 214 | 46 | 52 | 62 | 63 | 66 |
| Czech Republic | CZ | Yes | 19 | 1.78 | 2 362 | 222 | – | – | 277 | 301 | 201 | 192 | 222 |
| Denmark | DK | Yes | 6 | 1.07 | 1 262 | 226 | – | – | 218 | 231 | 217 | 216 | 226 |
| Egypt | EG | No | N/A | N/A | 278 | 3 | 9 570 | 16 800 | 2 | 2 | 3 | 3 | 3 |
| Estonia | EE | No | 2 | 1.59 | 73 | 58 | 127 | 223 | 79 | 82 | 76 | 72 | 58 |
| Finland | FI | No | 19 | 3.46 | 1 303 | 237 | – | – | 166 | 194 | 220 | 219 | 237 |
| France | FR | No | 164 | 2.45 | 8 174 | 122 | – | 11 861 | 106 | 114 | 114 | 118 | 122 |
| Georgia Rebublic of | GE | No | 12 | 2.44 | 182 | 37 | 498 | 875 | 12 | 12 | 21 | 28 | 37 |
| Germany | DE | No | 780 | 9.66 | 27 000 | 334 | – | – | 326 | 336 | 295 | 358 | 334 |
| Greece | GR | Yes | 24 | 2.23 | 1 685 | 156 | – | 1 912 | 87 | 97 | 100 | 110 | 156 |
| Hungary | HU | Yes | 13 | 1.32 | 958 | 97 | 998 | 1 752 | 85 | 95 | 96 | 100 | 97 |
| Iceland | IS | No | 1 | 2.98 | 50 | 149 | – | 60 | 134 | 171 | 186 | 178 | 149 |
| Ireland | IE | No | 17 | 3.43 | 761 | 154 | – | 879 | 144 | 153 | N/A | 151 | 154 |
| Israel | IL | Yes | 20 | 2.45 | 1 026 | 126 | – | 1 451 | 137 | 166 | 215 | 162 | 126 |
| Italy | IT | Yes | 396 | 6.39 | 14 500 | 234 | – | – | 196 | 204 | 223 | 238 | 234 |
| Kazakhstan | KZ | No | 25 | 1.36 | 791 | 43 | 1 856 | 3 258 | 7 | 12 | 22 | 29 | 43 |
| Kosovo | XK | N/A | 1 | 0.53 | 3 | 2 | 190 | 334 | N/A | N/A | 2 | 6 | 2 |
| Kyrgyzstan | KGZ | No | 3 | 0.52 | 0 | 0 | 579 | 1 016 | N/A | N/A | 0 | N/A | 0 |
| Latvia | LV | Yes | 3 | 1.53 | 150 | 76 | 199 | 349 | 32 | 40 | 35 | 45 | 76 |
| Lebanon* | LB | N/A | N/A | N/A | N/A | N/A | N/A | N/A | N/A | 73 | 73 | N/A | N/A |
| Libya* | LY | N/A | N/A | N/A | N/A | N/A | N/A | N/A | N/A | N/A | N/A | N/A | N/A |
| Lithuania | LT | No | 3 | 1.05 | 149 | 52 | 289 | 507 | 42 | 35 | 38 | 43 | 52 |
| Luxembourg | LU | No | 1 | 1.72 | 94 | 161 | – | 103 | 149 | 138 | 119 | 114 | 161 |
| FYR Macedonia | MK | No | 3 | 1.43 | 21 | 10 | 212 | 373 | 7 | 6 | 5 | 14 | 10 |
| Malta | MT | No | 1 | 2.41 | 42 | 101 | – | 74 | 132 | 163 | 87 | 85 | 101 |
| Moldova | MD | Yes | 1 | 0.28 | 8 | 2 | 355 | 623 | N/A | 0 | N/A | N/A | 2 |
| Montenegro | ME | No | 1 | 1.55 | 59 | 92 | 65 | 114 | 44 | 58 | 63 | 82 | 92 |
| Morocco | MA | N/A | 5 | 0.15 | 36 | 1 | 3 402 | 5 973 | 1 | 1 | 1 | 2 | 1 |
| Netherlands | NL | Yes | 29 | 1.70 | 3 500 | 206 | – | – | 160 | 244 | 212 | 207 | 206 |
| Norway | NO | Yes | 11 | 2.09 | 915 | 174 | – | 934 | 199 | 214 | 220 | 233 | 174 |
| Poland | PL | No | 133 | 3.45 | 8 467 | 220 | – | – | 182 | 234 | 219 | 221 | 220 |
| Portugal | PT | No | 32 | 2.95 | 1 141 | 105 | – | 1 923 | 92 | 105 | 116 | 113 | 105 |
| Romania | RO | No | 15 | 0.69 | 535 | 25 | 2 184 | 3 833 | 8 | 9 | 15 | 14 | 25 |
| Russian Federation | RU | Yes | 49 | 0.34 | 1 418 | 10 | 14 391 | 25 264 | 11 | 13 | 12 | 17 | 10 |
| San Marino | SM | Yes | 0 | 0.00 | 10 | 300 | – | – | 404 | 616 | 550 | 242 | 300 |
| Serbia | RS | Yes | 13 | 1.82 | 586 | 82 | 722 | 1 268 | 38 | 62 | 63 | 61 | 82 |
| Slovakia | SK | Yes | 4 | 0.73 | 615 | 113 | – | 966 | 105 | 108 | 120 | 123 | 113 |
| Slovenia | SI | Yes | 2 | 1.01 | 315 | 159 | – | 351 | 61 | 71 | 88 | 115 | 159 |
| Spain | ES | Yes | 180 | 3.71 | 5 656 | 116 | – | 8 618 | 112 | 120 | 125 | 133 | 116 |
| Sweden | SE | Yes | 30 | 3.04 | 1 375 | 139 | – | 1 753 | 193 | 198 | 216 | 139 | 139 |
| Switzerland | CH | Yes | 49 | 5.99 | 1 121 | 137 | – | 1 452 | 195 | 202 | 218 | 224 | 137 |
| Syria* | SY | N/A | N/A | N/A | N/A | N/A | N/A | N/A | N/A | N/A | N/A | N/A | N/A |
| Tunisia | TN | No | 8 | 0.72 | 201 | 18 | 1 126 | 1 976 | 9 | 11 | 13 | 13 | 18 |
| Turkey | TR | No | 220 | 3 | 9 254 | 115 | – | 14 246 | N/A | N/A | 81 | 81 | 115 |
| Ukraine | UA | No | 8 | 0.18 | 49 | 1 | 4 469 | 7 846 | 1 | 2 | 1 | 1 | 1 |
| United Kingdom | GB | Yes | 125 | 1.94 | 7 242 | 112 | – | 11 434 | 91 | 92 | 102 | 105 | 112 |
| Total ESC member countries | 56 | 2 555 | 2.65 | 105 730 | 101 | 96 | 105 | 103 | 110 | 107 | |||
These 4 countries did not submit any data on ICD implantations for the EHRA White Book 2017.
ICD facilities and procedure rates
In 2016 a total of 105 730 ICDs were implanted in 2555 centres across the ESC area (Table 8). The mean number of centres implanting ICDs in the ESC area was slightly higher in 2016 than in 2015 (2.65 vs. 2.38 per million population). The country with the highest density of ICD implanting facilities was Germany (9.7 centres per million population) followed by Italy (6.4.) and Switzerland 6.0) (Figure 29).
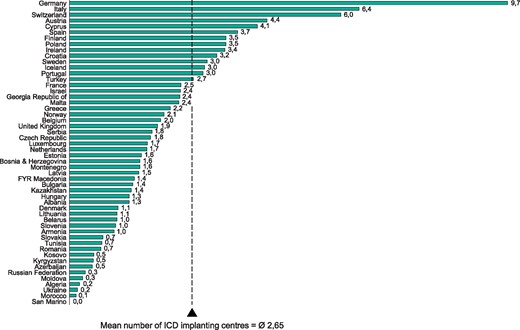
Implantable cardioverter-defibrillator (ICD) implanting centres per million inhabitants in 2016. The mean number of implantation centres is weighted by population.
In the participating countries, the mean number of ICD implantations per million inhabitants was approximately the same in 2016 as in the previous year (101 vs. 102). As seen in Figures 30 and 31 there were large variations in the ICD implantation rates in the ESC area. In Western Europe, the number of ICD implantations per million inhabitants (294) was almost twice as high as in any other ESC region. Among the participating countries the implantation rate was highest in Germany (334 per million inhabitants) followed by San Marino (300) and Finland (237). The lowest reported implantation rate was in Morocco and Ukraine (1 per million inhabitants), while Kyrgyzstan reported no ICD implantation in 2016.
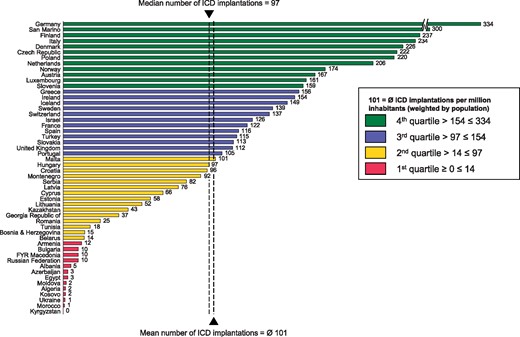
Implantable cardioverter-defibrillator implantations per million inhabitants in 2016. Mean number of implantations is weighted by population.
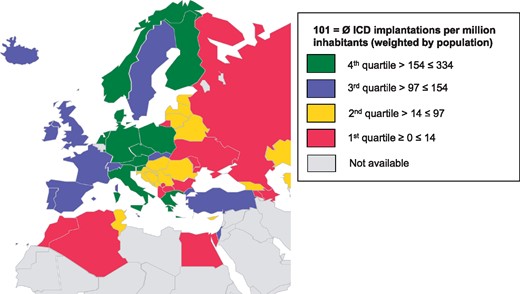
Implantable cardioverter-defibrillator implantations in the ESC member countries in 2016.
The changes from 2015 to 2016 in the number of centres implanting ICDs are shown in Table 9 and Figure 32, and the changes in the number of ICD implantations per million inhabitants during the same period are presented in Table 10 and Figure 33. A comparison to the previous four years in each country is shown in Table 8. The ICD implantation rate continued to increase especially in the Eastern European and non-European ESC member countries (e.g., Romania, Latvia, Kazakhstan and Turkey), whereas in some countries with well-developed ICD programs (e.g., Germany, Spain and Norway) the implantation rate decreased slightly. In Figures 34 and 35 these numbers are divided into de novo implantations and ICD generator replacements. The relationship between the mean annual ICD implantation rate per million inhabitants and the number of ICD implanting centres per million inhabitants in the ESC member countries and in the EU28 is shown in Figure 36.
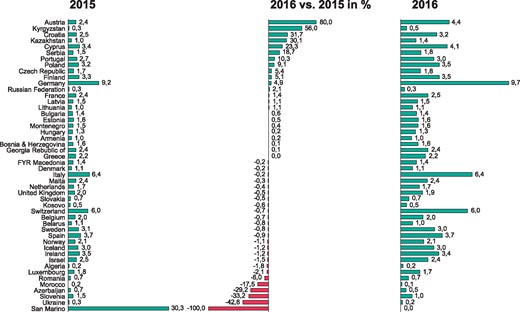
Change in the number of ICD implanting centres per million inhabitants from 2015 to 2016.
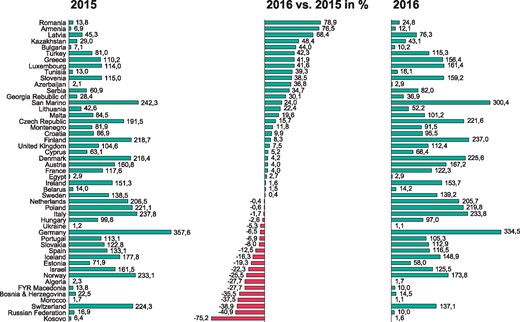
Change in the number of ICD implantations per million inhabitants from 2015 to 2016.
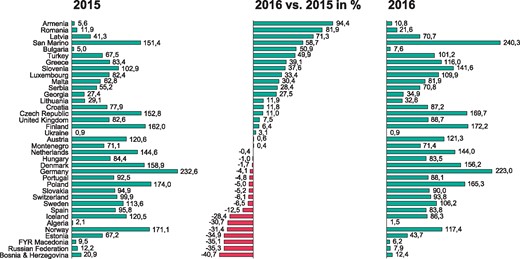
Change in the number of new ICD implantations per million inhabitants from 2015 to 2016.
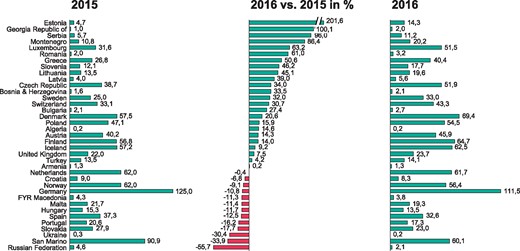
Change in the number of ICD replacements per million inhabitants from 2015 to 2016.
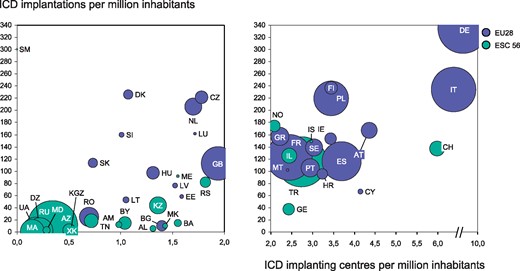
Implantable cardioverter defibrillator implantation centres and rates in the ESC and European Union (EU28) member countries in 2016. Bubble size is related to population in the country. The ISO codes of the countries are explained in Table 1.
Changes in the number of ICD implantation centres in year 2015 vs. 2016
| Number of ICD implanting centres 2015 | Number of ICD implanting centres 2016 | |||||
|---|---|---|---|---|---|---|
| Country | ISO code | Absolute number | Per millon inhabitants | Absolute number | Per million inhabitants | Change % |
| Albania | AL | N/A | N/A | 4 | 1.32 | N/A |
| Algeria | DZ | 9 | 0.23 | 9 | 0.22 | −1.8% |
| Armenia | AM | 3 | 0.98 | 3 | 0.98 | 0.2% |
| Austria | AT | 21 | 2.42 | 38 | 4.36 | 80.0% |
| Azerbaijan | AZ | 7 | 0.72 | 5 | 0.51 | −29.2% |
| Belarus | BY | 10 | 1.05 | 10 | 1.04 | −0.8% |
| Belgium | BE | 23 | 2.03 | 23 | 2.02 | −0.7% |
| Bosnia & Herzegovina | BA | 6 | 1.55 | 6 | 1.55 | 0.1% |
| Bulgaria | BG | 10 | 1.39 | 10 | 1.40 | 0.6% |
| Croatia | HR | 11 | 2.46 | 14 | 3.25 | 31.7% |
| Cyprus | CY | 4 | 3.36 | 5 | 4.15 | 23.3% |
| Czech Republic | CZ | 18 | 1.69 | 19 | 1.78 | 5.4% |
| Denmark | DK | 6 | 1.07 | 6 | 1.07 | −0.2% |
| Egypt | EG | 17 | 0.19 | N/A | N/A | N/A |
| Estonia | EE | 2 | 1.58 | 2 | 1.59 | 0.5% |
| Finland | FI | 18 | 3.29 | 19 | 3.46 | 5.1% |
| France | FR | 161 | 2.42 | 164 | 2.45 | 1.4% |
| Georgia Rebublic of | GE | 12 | 2.43 | 12 | 2.44 | 0.1% |
| Germany | DE | 745 | 9.21 | 780 | 9.66 | 4.9% |
| Greece | GR | 24 | 2.23 | 24 | 2.23 | 0.0% |
| Hungary | HU | 13 | 1.31 | 13 | 1.32 | 0.2% |
| Iceland | IS | 1 | 3.01 | 1 | 2.98 | −1.2% |
| Ireland | IE | 17 | 3.47 | 17 | 3.43 | −1.2% |
| Israel | IL | 20 | 2.48 | 20 | 2.45 | −1.5% |
| Italy | IT | 396 | 6.40 | 396 | 6.39 | −0.2% |
| Kazakhstan | KZ | 19 | 1.05 | 25 | 1.36 | 30.1% |
| Kosovo | XK | 1 | 0.53 | 1 | 0.53 | −0.6% |
| Kyrgyzstan | KGZ | 2 | 0.34 | 3 | 0.52 | 56.0% |
| Latvia | LV | 3 | 1.51 | 3 | 1.53 | 1.1% |
| Lebanon* | LB | N/A | N/A | N/A | N/A | N/A |
| Libya* | LY | N/A | N/A | N/A | N/A | N/A |
| Lithuania | LT | 3 | 1.04 | 3 | 1.05 | 1.1% |
| Luxembourg | LU | 1 | 1.75 | 1 | 1.72 | −2.1% |
| FYR Macedonia | MK | 3 | 1.43 | 3 | 1.43 | −0.2% |
| Malta | MT | 1 | 2.42 | 1 | 2.41 | −0.3% |
| Moldova | MD | N/A | N/A | 1 | 0.28 | N/A |
| Montenegro | ME | 1 | 1.55 | 1 | 0.28 | −81.6% |
| Morocco | MA | 6 | 0.18 | 5 | 0.28 | 58.2% |
| Netherlands | NL | 29 | 1.71 | 29 | 0.28 | −83.4% |
| Norway | NO | 11 | 2.11 | 11 | 0.28 | −86.5% |
| Poland | PL | 122 | 3.16 | 133 | 0.28 | −91.0% |
| Portugal | PT | 29 | 2.68 | 32 | 0.28 | −89.4% |
| Romania | RO | 16 | 0.74 | 15 | 0.28 | −61.4% |
| Russian Federation | RU | 48 | 0.34 | 49 | 0.28 | −15.5% |
| San Marino | SM | 1 | 30.28 | 0 | 0.28 | −99.1% |
| Serbia | RS | 11 | 1.53 | 13 | 0.28 | −81.4% |
| Slovakia | SK | 4 | 0.74 | 4 | 0.28 | −61.4% |
| Slovenia | SI | 3 | 1.51 | 2 | 0.28 | −81.2% |
| Spain | ES | 180 | 3.74 | 180 | 0.28 | −92.4% |
| Sweden | SE | 30 | 3.06 | 30 | 0.28 | −90.7% |
| Switzerland | CH | 49 | 6.03 | 49 | 0.28 | −95.3% |
| Syria* | SY | N/A | N/A | N/A | 0.28 | N/A |
| Tunisia | TN | N/A | N/A | 8 | 0.28 | N/A |
| Turkey | TR | n/a | N/A | 220 | 0.28 | N/A |
| Ukraine | UA | 14 | 0.32 | 8 | 0.28 | −9.6% |
| United Kingdom | GB | 125 | 1.95 | 125 | 0.28 | −85.4% |
| Total ESC member countries | 2 266 | 2.20 | 2 555 | 2.65 | 20.6% | |
These 3 countries did not submit data for the EHRA White Book 2017.
Changes in the number of implantable cardioverter defibrillator (ICD) implantations from 2015 to 2016
| Number of ICD implants 2015 | Number of ICD implants 2016 | |||||
|---|---|---|---|---|---|---|
| Country | ISO code | Absolute number | Per millio inhabitants | Absolute number | Per million inhabitants | Change % |
| Albania | AL | N/A | N/A | 16 | 5.27 | N/A |
| Algeria | DZ | 91 | 2.30 | 67 | 1.66 | −27.7% |
| Armenia | AM | 21 | 6.87 | 37 | 12.13 | 76.5% |
| Austria | AT | 1 393 | 160.75 | 1 457 | 167.25 | 4.0% |
| Azerbaijan | AZ | 21 | 2.15 | 29 | 2.94 | 36.8% |
| Belarus | BY | 133 | 14.00 | 136 | 14.21 | 1.5% |
| Belgium* | BE | 1 531 | 135.20 | N/A | N/A | N/A |
| Bosnia & Herzegovina | BA | 87 | 22.50 | 56 | 14.50 | −35.5% |
| Bulgaria | BG | 51 | 7.10 | 73 | 10.22 | 44.0% |
| Croatia | HR | 388 | 86.90 | 412 | 95.51 | 9.9% |
| Cyprus | CY | 75 | 63.07 | 80 | 66.36 | 5.2% |
| Czech Republic | CZ | 2 039 | 191.55 | 2 362 | 221.56 | 15.7% |
| Denmark | DK | 1 208 | 216.43 | 1 262 | 225.61 | 4.2% |
| Egypt | EG | 253 | 2.86 | 278 | 2.94 | 2.7% |
| Estonia | EE | 91 | 71.91 | 73 | 58.00 | −19.3% |
| Finland | FI | 1 198 | 218.74 | 1 303 | 236.99 | 8.3% |
| France | FR | 7 825 | 117.57 | 8 174 | 122.30 | 4.0% |
| Georgia Rebublic of | GE | 140 | 28.39 | 182 | 36.93 | 30.1% |
| Germany | DE | 28 914 | 357.61 | 27 000 | 334.48 | −6.5% |
| Greece | GR | 1 188 | 110.25 | 1 685 | 156.41 | 41.9% |
| Hungary | HU | 986 | 99.62 | 958 | 97.01 | −2.6% |
| Iceland | IS | 59 | 177.75 | 50 | 148.86 | −16.3% |
| Ireland | IE | 740 | 151.26 | 761 | 153.66 | 1.6% |
| Israel | IL | 1 300 | 161.50 | 1 026 | 125.51 | −22.3% |
| Italy | IT | 14 709 | 237.80 | 14 500 | 233.84 | −1.7% |
| Kazakhstan | KZ | 527 | 29.02 | 791 | 43.08 | 48.4% |
| Kosovo | XK | 12 | 6.41 | 3 | 1.59 | −75.2% |
| Kyrgyzstan | KGZ | N/A | N/A | 0 | 0.00 | N/A |
| Latvia | LV | 90 | 45.30 | 150 | 76.31 | 68.4% |
| Lebanon* | LB | N/A | N/A | N/A | N/A | N/A |
| Libya* | LY | N/A | N/A | N/A | N/A | N/A |
| Lithuania | LT | 123 | 42.64 | 149 | 52.20 | 22.4% |
| Luxembourg | LU | 65 | 113.98 | 94 | 161.43 | 41.6% |
| FYR Macedonia | MK | 29 | 13.84 | 21 | 10.00 | −27.7% |
| Malta | MT | 35 | 84.55 | 42 | 101.16 | 19.6% |
| Moldova | MD | N/A | N/A | 8 | 2.28 | N/A |
| Montenegro | ME | 53 | 81.91 | 59 | 91.53 | 11.8% |
| Morocco | MA | 57 | 1.71 | 36 | 1.07 | −37.5% |
| Netherlands | NL | 3 500 | 206.52 | 3 500 | 205.68 | −0.4% |
| Norway | NO | 1 214 | 233.12 | 915 | 173.78 | −25.5% |
| Poland | PL | 8 526 | 221.10 | 8 467 | 219.79 | −0.6% |
| Portugal | PT | 1 224 | 113.07 | 1 141 | 105.32 | −6.9% |
| Romania | RO | 300 | 13.85 | 535 | 24.77 | 78.9% |
| Russian Federation | RU | 2 401 | 16.86 | 1 418 | 9.96 | −40.9% |
| San Marino | SM | 8 | 242.28 | 10 | 300.44 | 24.0% |
| Serbia | RS | 437 | 60.89 | 586 | 82.03 | 34.7% |
| Slovakia | SK | 665 | 122.79 | 615 | 112.93 | −8.0% |
| Slovenia | SI | 228 | 114.95 | 315 | 159.25 | 38.5% |
| Spain | ES | 6 406 | 133.05 | 5 656 | 116.47 | −12.5% |
| Sweden | SE | 1 358 | 138.55 | 1 375 | 139.16 | 0.4% |
| Switzerland | CH | 1 822 | 224.33 | 1 121 | 137.05 | −38.9% |
| Syria* | SY | N/A | N/A | N/A | N/A | N/A |
| Tunisia | TN | 143 | 12.96 | 201 | 18.05 | 39.3% |
| Turkey | TR | 6 381 | 81.04 | 9 254 | 115.28 | 42.3% |
| Ukraine | UA | 52 | 1.17 | 49 | 1.11 | −5.3% |
| United Kingdom | GB | 6 701 | 104.56 | 7 242 | 112.40 | 7.5% |
| Total ESC member countries | 106 798 | 103 | 105 730 | 101 | -2.1% | |
These 4 countries did not submit data for ICD implantation the EHRA White Book 2017
Trends in ICD implantation activity over the past 10 years
The number of ICD implantations per million population over the past 10 years in the European and non-European ESC member countries and comparison with the total ESC area and the 28 member countries of the European Union (EU28) are shown in Figure 37. The corresponding numbers for the European ESC regions are presented in Figure 38. In the Eastern European (59) and non-European ESC member countries (54) ICD implantation rate was almost three times lower than in the Western ESC member countries (229).
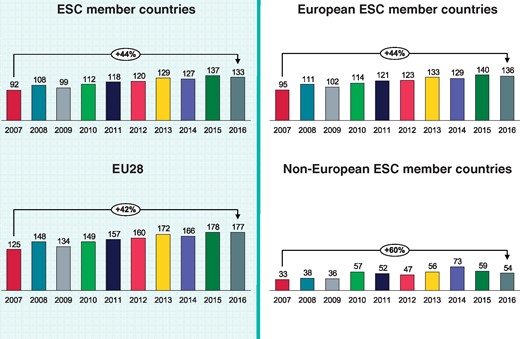
Implantable cardioverter-defibrillator per million inhabitants 2007-2016 in the European and non-European ESC member countries and comparison to the total ESC area and the 28 member countries of the European Union (EU28).
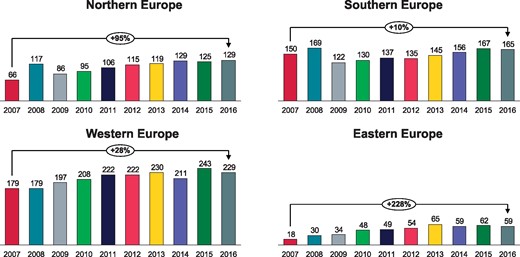
Implantable cardioverter-defibrillator implantations per million inhabitants 2007-2016 in the four European ESC regions.
However, the growth in the rate of ICD implantations per million population was highest in the Eastern European (228%) and Northern European (95%) countries. In the Southern European countries, the increase in the ICD implantation rate over the past 10 years was only 11%. Countries with the highest and lowest activities in each region and trends over the ten-year data collection period are shown in Figures 39-43. The most active countries in the five geographical ESC regions (after excluding San Marino) were Germany (334 ICD implantations per million inhabitants), Finland (237), Italy (234), Czech Republic (222), and Israel (126). The changes from 2007 to 2016 in the number of ICD implanting centres and ICD implantation for each participating country are shown in Figure 44 and Figure 45, respectively. During the 10-year period, the rate of ICD implantation increased in all countries except for Switzerland, Italy, Armenia and San Marino.
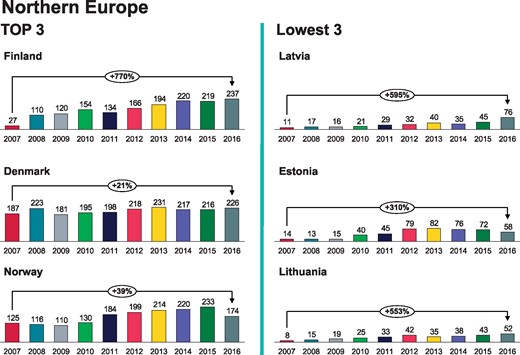
Implantable cardioverter-defibrillator implantations per million inhabitants 2007-2016 in Northern Europe.
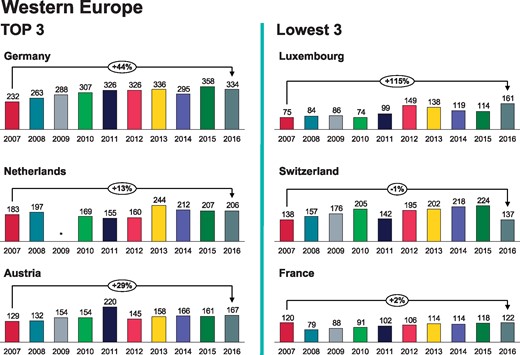
Implantable cardioverter-defibrillator implantations per million inhabitants 2007-2016 in Western Europe. *No data available.
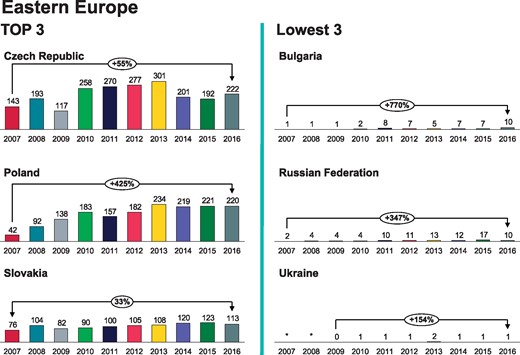
Implantable cardioverter-defibrillator implantations per million inhabitants 2007-2016 in Eastern Europe. *No data available.
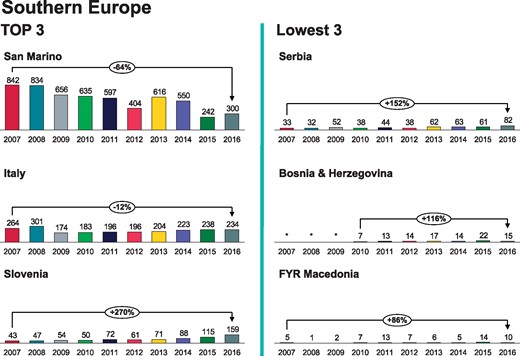
Implantable cardioverter-defibrillator implantations per million inhabitants 2007-2016 in Southern Europe. *No data available.
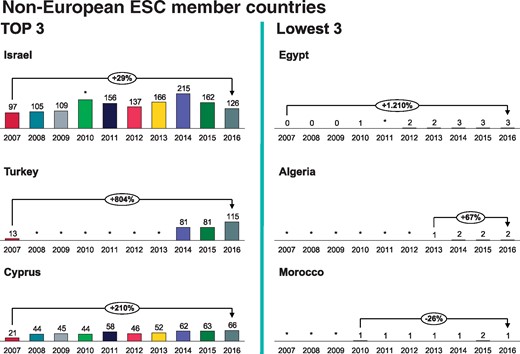
Implantable cardioverter-defibrillator implantations per million inhabitants 2007-2016 in the non-European ESC member countries. * No data available.
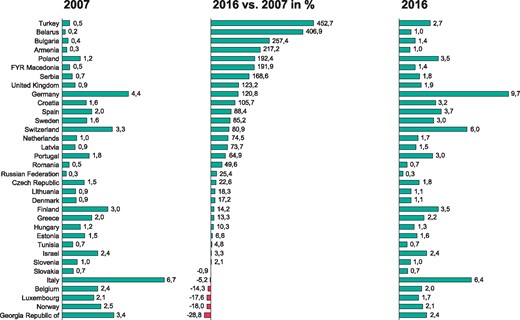
Change in the number of ICD implanting centres per million inhabitants from 2007 to 2016.
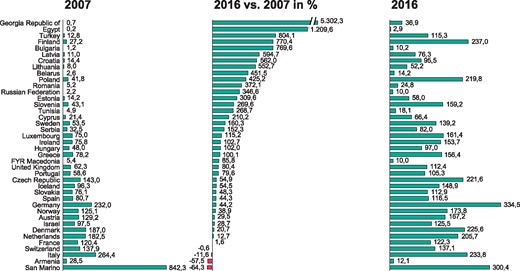
Change in the number of ICD implantations per million inhabitants from 2007 to 2016.
Subcutaneous ICDs
The subcutaneous ICD (S-ICD) is a recently developed device for prevention of sudden cardiac death. It is implanted entirely under the skin with no intravascular leads. It is best suited for patients with no need for pacing and increased risk for transvenous lead complications (11).
This was the second year that data on S-ICD implantations was collected for the EHRA White Book. Only 43 countries (77%) provided data on the S-ICD implantations. A total of 2012 S-ICDs were implanted in 22 countries in 2016, which is about 90% more than in the previous year (1049). The most active country with regards to the S-ICD implantations was France with 820 implantations followed by the United Kingdom (310 implantations) and the Netherlands (300 implantations). No S-ICDs were implanted in 21 of the participating countries (Figure 46).
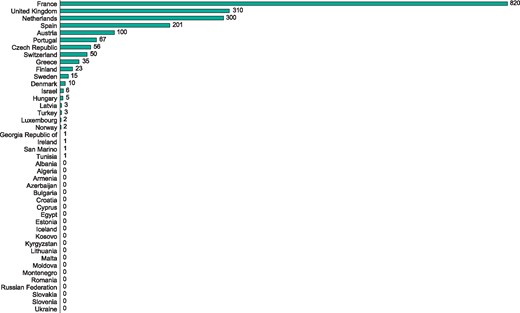
Number of subcutaneous ICD (S-ICD) implantations in 2016.
Cardiac resynchronisation therapy devices
General information
The 46 (82%) countries which submitted data on cardiac resynchronization therapy (CRT) for the EHRA White Book are listed in Table 11. Ten countries reported no data or only limited data on CRT therapy. The majority of CRT implantations were done by cardiologists, and the remaining implantations were performed by physicians having various other training backgrounds, mainly surgeons. However, in Belarus, Kazakhstan, Kyrgyzstan and Ukraine most of the CRT implantations were done by surgeons (Table 5).
Cardiac resynchronisation therapy device (CRT-P and CRT-D) implantation facilities and rates in the ESC member countries in 2016 and comparison with four previous years
| Number of CRT | Total CRT | Development potential - target number of CRT | CRT implantations per million | |||||||||||
|---|---|---|---|---|---|---|---|---|---|---|---|---|---|---|
| implanting centres 2016 | CRT implantations 2016 | implantations 2016 | implantations | inhabitants | ||||||||||
| Country | ISO code | Absolute number | Per million inhabitants | CRT-P implantations | CRT-D implantations | Absolute number | Per million inhabitants | To attain mean ESC area level | To attain mean EU-28 level | 2012 | 2013 | 2014 | 2015 | 2016 |
| Absolute number | Absolute number | |||||||||||||
| Albania | AL | 4 | 1.32 | 18 | 4 | 22 | 7 | 257 | 471 | N/A | N/A | 1 | N/A | 7 |
| Algeria | DZ | 8 | 0.20 | 62 | 27 | 89 | 2 | 3 411 | 6 242 | N/A | 2 | 1 | 3 | 2 |
| Armenia | AM | 3 | 0.98 | 10 | 10 | 20 | 7 | 258 | 473 | 6 | 3 | 1 | 3 | 7 |
| Austria | AT | 36 | 4.13 | 400 | 870 | 1 270 | 146 | – | 1 350 | 107 | 143 | 150 | 157 | 146 |
| Azerbaijan | AZ | 5 | 0.51 | 2 | 63 | 65 | 7 | 836 | 1 530 | N/A | 2 | 2 | 2 | 7 |
| Belarus | BY | 6 | 0.63 | N/A | N/A | 60 | 6 | 811 | 1 484 | 4 | 6 | 5 | 11 | 6 |
| Belgium* | BE | 40 | 3.51 | N/A | N/A | N/A | N/A | N/A | N/A | 82 | 117 | 127 | 131 | N/A |
| Bosnia & Herzegovina | BA | 3 | 0.78 | 8 | 9 | 17 | 4 | 327 | 599 | 5 | 6 | 6 | 4 | 4 |
| Bulgaria | BG | 10 | 1.40 | 325 | 46 | 371 | 52 | 605 | 1 108 | 28 | 37 | 44 | 41 | 52 |
| Croatia | HR | 11 | 2.55 | 132 | 145 | 277 | 64 | 365 | 669 | 13 | 18 | 28 | 58 | 64 |
| Cyprus | CY | 4 | 3.32 | N/A | N/A | 25 | 21 | 102 | 187 | 25 | 22 | 25 | 25 | 21 |
| Czech Republic | CZ | 19 | 1.78 | 450 | 1 643 | 2 093 | 196 | – | – | 127 | 162 | 176 | 183 | 196 |
| Denmark | DK | 5 | 0.89 | 500 | 629 | 1 129 | 202 | – | – | 170 | 180 | 173 | 176 | 202 |
| Egypt | EG | N/A | N/A | 600 | 26 | 626 | 7 | 8 019 | 14 675 | 4 | 5 | 6 | 6 | 7 |
| Estonia | EE | 2 | 1.59 | 23 | 21 | 44 | 35 | 107 | 195 | 53 | 55 | 41 | 58 | 35 |
| Finland | FI | 15 | 2.73 | 212 | 366 | 578 | 105 | – | 852 | 72 | 83 | 100 | 96 | 105 |
| France | FR | 180 | 2.69 | 4 046 | 6 686 | 10 732 | 161 | – | – | 131 | 140 | 144 | 157 | 161 |
| Georgia Rebublic of | GE | 10 | 2.03 | 13 | 99 | 112 | 23 | 417 | 764 | 7 | 8 | 11 | 13 | 23 |
| Germany | DE | 750 | 9.29 | 3 700 | 17 850 | 21 550 | 267 | – | – | 221 | 150 | 242 | 261 | 267 |
| Greece | GR | 16 | 1.49 | 650 | 100 | 750 | 70 | 913 | 1 670 | 45 | 46 | 54 | 67 | 70 |
| Hungary | HU | 14 | 1.42 | 471 | 636 | 1 107 | 112 | – | 1 531 | 89 | 99 | 95 | 110 | 112 |
| Iceland | IS | 1 | 2.98 | 11 | 8 | 19 | 57 | 28 | 52 | 32 | 44 | 82 | 63 | 57 |
| Ireland | IE | 17 | 3.43 | 90 | 240 | 330 | 67 | 420 | 768 | 61 | 79 | N/A | 65 | 67 |
| Israel | IL | 20 | 2.45 | 239 | 1 196 | 1 435 | 176 | – | – | 118 | 158 | 170 | 180 | 176 |
| Italy | IT | 378 | 6.10 | 2 300 | 10 800 | 13 100 | 211 | – | – | 194 | 198 | 200 | 207 | 211 |
| Kazakhstan | KZ | 23 | 1.25 | N/A | N/A | 414 | 23 | 1 555 | 2 846 | 9 | 12 | 15 | 17 | 23 |
| Kosovo* | XK | 1 | 0.53 | N/A | N/A | N/A | N/A | N/A | N/A | N/A | N/A | 0 | 2 | N/A |
| Kyrgyzstan* | KGZ | 2 | 0.35 | N/A | N/A | N/A | N/A | N/A | N/A | N/A | N/A | 0 | N/A | N/A |
| Latvia | LV | 2 | 1.02 | 26 | 85 | 111 | 56 | 167 | 305 | 35 | 29 | 48 | 54 | 56 |
| Lebanon* | LB | N/A | N/A | N/A | N/A | N/A | N/A | N/A | N/A | N/A | 24 | 39 | N/A | N/A |
| Libya* | LY | N/A | N/A | N/A | N/A | N/A | N/A | N/A | N/A | N/A | N/A | N/A | N/A | N/A |
| Lithuania | LT | 3 | 1.05 | 140 | 41 | 181 | 63 | 242 | 442 | 39 | 47 | 55 | 68 | 63 |
| Luxembourg | LU | 1 | 1.72 | 11 | 25 | 36 | 62 | 49 | 90 | 59 | 43 | 65 | 60 | 62 |
| FYR Macedonia | MK | 3 | 1.43 | 47 | 9 | 56 | 27 | 178 | 326 | 5 | 8 | 13 | 18 | 27 |
| Malta | MT | 1 | 2.41 | 8 | 31 | 39 | 94 | – | 64 | 83 | 39 | 116 | 99 | 94 |
| Moldova* | MD | N/A | N/A | N/A | N/A | N/A | N/A | N/A | N/A | N/A | 0 | N/A | N/A | N/A |
| Montenegro | ME | 1 | 1.55 | 15 | 16 | 31 | 48 | 55 | 100 | 29 | 15 | 34 | 29 | 48 |
| Morocco | MA | 3 | 0.09 | 38 | 43 | 81 | 2 | 2 851 | 5 217 | 2 | 2 | 2 | 3 | 2 |
| Netherlands | NL | 29 | 1.70 | 450 | 1 650 | 2 100 | 123 | – | 2 638 | 124 | 123 | 114 | 118 | 123 |
| Norway | NO | 9 | 1.71 | 179 | 341 | 520 | 99 | – | 816 | 77 | 84 | 100 | 108 | 99 |
| Poland | PL | N/A | N/A | 691 | 3 473 | 4 164 | 108 | – | 5 972 | 73 | 78 | 97 | 103 | 108 |
| Portugal | PT | 28 | 2.58 | 204 | 597 | 801 | 74 | 918 | 1 679 | 52 | 60 | 64 | 71 | 74 |
| Romania | RO | 12 | 0.56 | 238 | 183 | 421 | 19 | 1 830 | 3 348 | 7 | 9 | 13 | 13 | 19 |
| Russian Federation | RU | 39 | 0.27 | 284 | 711 | 995 | 7 | 12 059 | 22 067 | 6 | 7 | 6 | 7 | 7 |
| San Marino | SM | 0 | 0.00 | 0 | 2 | 2 | 60 | 3 | 5 | 62 | 0 | 31 | 61 | 60 |
| Serbia | RS | 6 | 0.84 | 242 | 71 | 313 | 44 | 605 | 1 107 | 42 | 45 | 45 | 44 | 44 |
| Slovakia | SK | 5 | 0.92 | 164 | 326 | 490 | 90 | – | 844 | 61 | 82 | 96 | 109 | 90 |
| Slovenia | SI | 2 | 1.01 | 45 | 90 | 135 | 68 | 168 | 307 | 70 | 66 | 75 | 83 | 68 |
| Spain | ES | 130 | 2.68 | 1 124 | 2 032 | 3 156 | 65 | 4 114 | 7 528 | 53 | 58 | 63 | 71 | 65 |
| Sweden | SE | 22 | 2.23 | 709 | 993 | 1 702 | 172 | – | – | 49 | 100 | 88 | 154 | 172 |
| Switzerland | CH | 31 | 3.79 | 329 | 628 | 957 | 117 | – | 1 268 | 66 | 62 | 73 | 141 | 117 |
| Syria* | SY | N/A | N/A | N/A | N/A | N/A | N/A | N/A | N/A | N/A | N/A | N/A | N/A | N/A |
| Tunisia | TN | 4 | 0.36 | 150 | 40 | 190 | 17 | 943 | 1 726 | 23 | 21 | 16 | 19 | 17 |
| Turkey | TR | 170 | 2.12 | 359 | 3 126 | 3 485 | 43 | 6 800 | 12 444 | N/A | N/A | 32 | 36 | 43 |
| Ukraine | UA | 10 | 0.23 | 43 | 29 | 72 | 2 | 3 745 | 6 853 | 1 | 2 | 2 | 2 | 2 |
| United Kingdom | GB | 126 | 1.96 | 4 318 | 7 063 | 11 381 | 177 | – | – | 110 | 122 | 149 | 159 | 177 |
| Total ESC member countries | 2 220 | 2.41 | 24 076 | 63 079 | 87 654 | 85 | 73 | 71 | 84 | 91 | 93 | |||
These 7 countries did not submit any data on CRT implantations for the EHRA White Book 2017.
CRT facilities and procedure rates
According to the White Book data 87 654 CRT devices were implanted in 2220 national centres across the ESC area in 2016. The number of CRT implanting centres per million inhabitants in the ESC member countries is shown in Table 11 and Figure 47. The mean number of the CRT implanting centres was markedly higher in 2016 than in 2015 (2.41 vs. 1.68 centres per million inhabitants). Countries with the highest density of CRT implanting centres were Germany (9.3 per million population), Italy (6.1) and Austria (4.1). The density of the CRT implanting centres was less than one per million inhabitants in 16 countries. In these countries except for Denmark the implantation rate was also low. The changes in the number of implanting centres from 2015 to 2016 are shown in Table 12 and Figure 48.
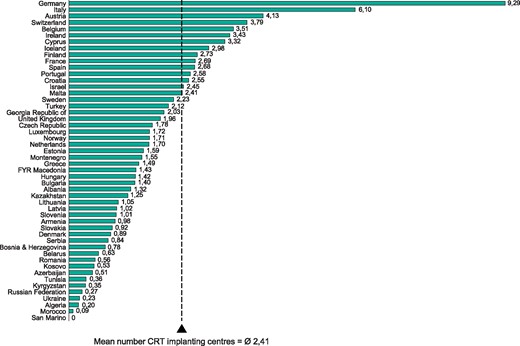
Cardiac resynchronization therapy (CRT) device implanting centres per million inhabitants in 2016. The mean number of CRT implantation centres is weighted by population.
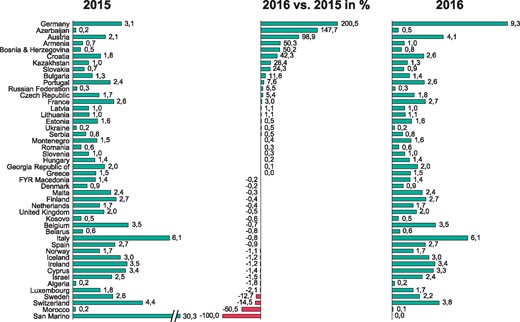
Change in the number of CRT implanting centres per million inhabitants from 2015 to 2016.
Changes in the number of ardiac resynchronisation therapy (CRT) implanting centres in from 2015 to 2016
| Number of CRT implanting centres 2015 | Number of CRT implanting centres 2016 | |||||
|---|---|---|---|---|---|---|
| Country | ISO code | Absolute number | Per million inhabitants | Absolute number | Per million inhabitants | Change % |
| Albania | AL | N/A | N/A | 4 | 1.32 | N/A |
| Algeria | DZ | 8 | 0.20 | 8 | 0.20 | −1.8% |
| Armenia | AM | 2 | 0.65 | 3 | 0.98 | 50.3% |
| Austria | AT | 18 | 2.08 | 36 | 4.13 | 98.9% |
| Azerbaijan | AZ | 2 | 0.20 | 5 | 0.51 | 147.7% |
| Belarus | BY | 6 | 0.63 | 6 | 0.63 | −0.8% |
| Belgium | BE | 40 | 3.53 | 40 | 3.51 | −0.7% |
| Bosnia & Herzegovina | BA | 2 | 0.52 | 3 | 0.78 | 50.2% |
| Bulgaria | BG | 9 | 1.25 | 10 | 1.40 | 11.8% |
| Croatia | HR | 8 | 1.79 | 11 | 2.55 | 42.3% |
| Cyprus | CY | 4 | 3.36 | 4 | 3.32 | −1.4% |
| Czech Republic | CZ | 18 | 1.69 | 19 | 1.78 | 5.4% |
| Denmark | DK | 5 | 0.90 | 5 | 0.89 | −0.2% |
| Egypt* | EG | 17 | 0.19 | N/A | N/A | N/A |
| Estonia | EE | 2 | 1.58 | 2 | 1.59 | 0.5% |
| Finland | FI | 15 | 2.74 | 15 | 2.73 | −0.4% |
| France | FR | 174 | 2.61 | 180 | 2.69 | 3.0% |
| Georgia Rebublic of | GE | 10 | 2.03 | 10 | 2.03 | 0.1% |
| Germany | DE | 250 | 3.09 | 750 | 9.29 | 200.5% |
| Greece | GR | 16 | 1.48 | 16 | 1.49 | 0.0% |
| Hungary | HU | 14 | 1.41 | 14 | 1.42 | 0.2% |
| Iceland | IS | 1 | 3.01 | 1 | 2.98 | −1.2% |
| Ireland | IE | 17 | 3.47 | 17 | 3.43 | −1.2% |
| Israel | IL | 20 | 2.48 | 20 | 2.45 | −1.5% |
| Italy | IT | 380 | 6.14 | 378 | 6.10 | −0.8% |
| Kazakhstan | KZ | 18 | 0.99 | 23 | 1.25 | 26.4% |
| Kosovo | XK | 1 | 0.53 | 1 | 0.53 | −0.6% |
| Kyrgyzstan | KGZ | N/A | N/A | 2 | 0.35 | N/A |
| Latvia | LV | 2 | 1.01 | 2 | 1.02 | 1.1% |
| Lebanon* | LB | N/A | N/A | N/A | N/A | N/A |
| Libya* | LY | N/A | N/A | N/A | N/A | N/A |
| Lithuania | LT | 3 | 1.04 | 3 | 1.05 | 1.1% |
| Luxembourg | LU | 1 | 1.75 | 1 | 1.72 | −2.1% |
| FYR Macedonia | MK | 3 | 1.43 | 3 | 1.43 | −0.2% |
| Malta | MT | 1 | 2.42 | 1 | 2.41 | −0.3% |
| Moldova* | MD | N/A | N/A | N/A | N/A | N/A |
| Montenegro | ME | 1 | 1.55 | 1 | 1.55 | 0.4% |
| Morocco | MA | 6 | 0.18 | 3 | 0.09 | −50.5% |
| Netherlands | NL | 29 | 1.71 | 29 | 1.70 | −0.4% |
| Norway | NO | 9 | 1.73 | 9 | 1.71 | −1.1% |
| Poland* | PL | N/A | N/A | N/A | N/A | N/A |
| Portugal | PT | 26 | 2.40 | 28 | 2.58 | 7.6% |
| Romania | RO | 12 | 0.55 | 12 | 0.56 | 0.3% |
| Russian Federation | RU | 37 | 0.26 | 39 | 0.27 | 5.5% |
| San Marino | SM | 1 | 30.28 | 0 | 0.00 | −100.0% |
| Serbia | RS | 6 | 0.84 | 6 | 0.84 | 0.5% |
| Slovakia | SK | 4 | 0.74 | 5 | 0.92 | 24.3% |
| Slovenia | SI | 2 | 1.01 | 2 | 1.01 | 0.3% |
| Spain | ES | 130 | 2.70 | 130 | 2.68 | −0.9% |
| Sweden | SE | 25 | 2.55 | 22 | 2.23 | −12.7% |
| Switzerland | CH | 36 | 4.43 | 31 | 3.79 | −14.5% |
| Syria* | SY | N/A | N/A | N/A | N/A | N/A |
| Tunisia | TN | N/A | N/A | 4 | 0.36 | N/A |
| Turkey | TR | N/A | N/A | 170 | 2.12 | N/A |
| Ukraine | UA | 10 | 0.23 | 10 | 0.23 | 0.5% |
| United Kingdom | GB | 126 | 1.97 | 126 | 1.96 | −0.5% |
| Total ESC member countries | 1 527 | 1.68 | 2 220 | 2.41 | 43.1% | |
These 6 countries did not submit any data on CRT implanting centres for the EHRA White Book 2017.
CRT implantation rates with the ESC member countries divided into quartiles are shown as a bar graph in Figure 49 and as a geographical map in Figure 50. There was a slight increase in both the absolute number of implants (87 654 vs. 84 205) and the rate of implants per million inhabitants (85 vs. 82) compared to 2015. Like in the past, there were large variations in the CRT implantation rates within the ESC area. In 2016 the CRT implantation rate per million inhabitants was 267 in Germany, while in ten countries it was less than 10. Figures 51 and 52 show the corresponding numbers for CRT pacemakers (CRT-P) and CRT defibrillators (CRT-D). The ratio of CRT-D/CRT-P implants was 2.62 with a mean of 62.7 CRT-Ds and 23.9 CRT-Ps per million inhabitants. Both the overall CRT implantation rate (267 per million inhabitants) and CRT-D implantation rate (221) were highest in Germany, while the CRT-P implantation rate was highest in Denmark (89). The changes from 2015 to 2016 in the number of total CRT, CRT-P and CRT-D implantations are shown in Table 13 and Figures53 to 55 respectively The relationship between the annual CRT implantation rate and the number of CRT implanting centres per million population in the EU28 countries and the ESC area is shown in Figure 56.
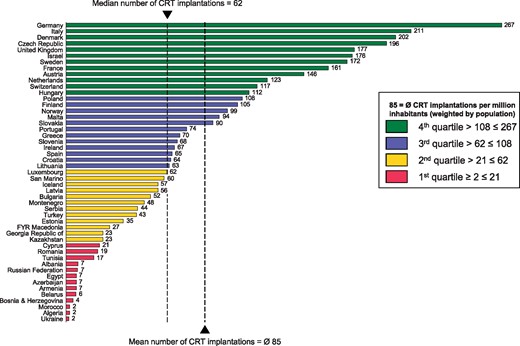
Cardiac resynchronization therapy device implantations per million inhabitants 2016. The mean number of CRT implantations is weighted by population.
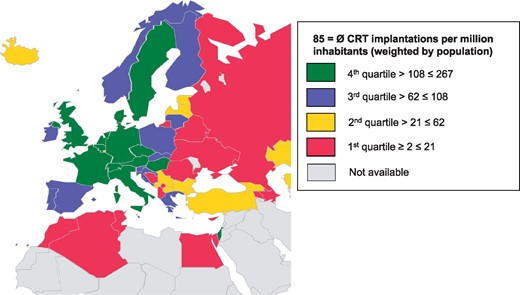
Cardiac resynchronization therapy device implantations in the ESC member countries in 2016.
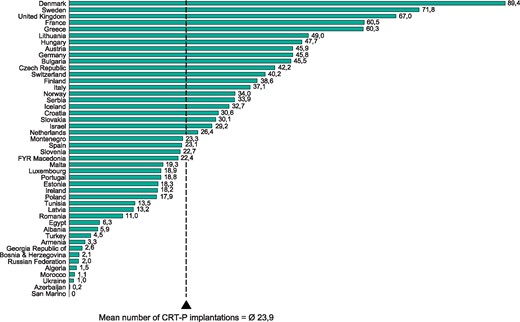
Cardiac resynchronization therapy pacemaker (CRT-P) implantations per million inhabitants in 2016. The mean number of implantations is weighted by population.
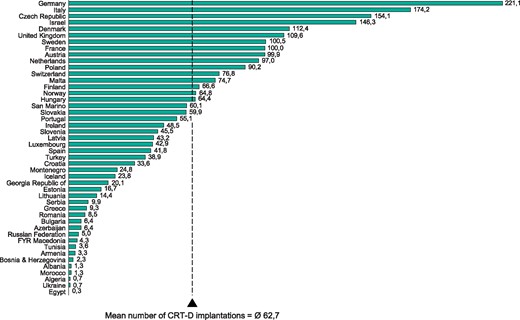
Cardiac resynchronization therapy defibrillator (CRT-D) implantations per million inhabitants in 2016. The mean number of implantations is weighted by population.
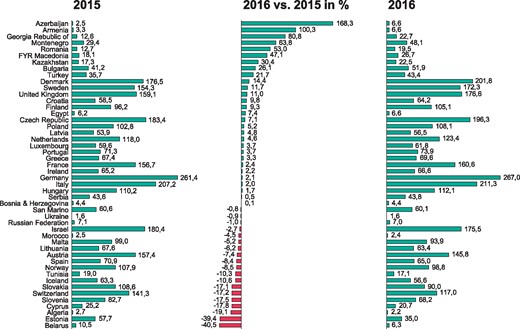
Change in the number of total CRT implantations per million inhabitants from 2015 to 2016.
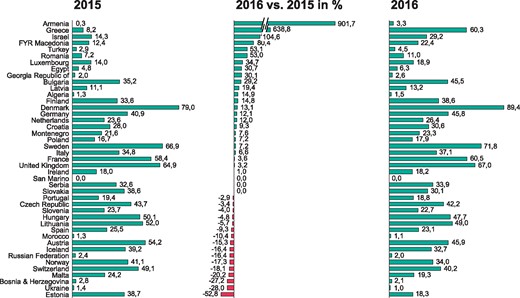
Change in the number of CRT-P implantations per million inhabitants from 2015 to 2016.
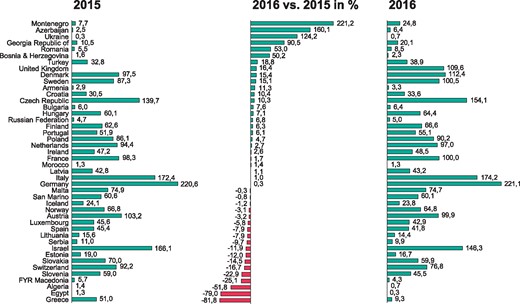
Change in the number of CRT-D implantations per million inhabitants from 2015 to 2016.
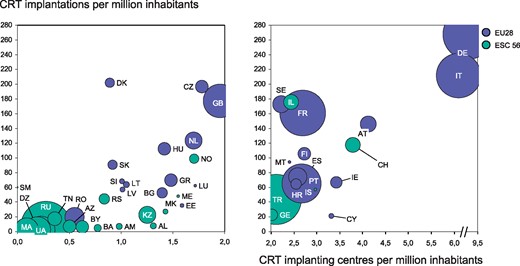
Cardiac resynchronization therapy implantation centres and rates in the ESC and European Union (EU28) member countries in 2016. Bubble size is related to population in the country.
Change in the number of total cardiac resynchronisation therapy (CRT) device implantations from 2015 to 2016
| Total CRT implantations 2015 | Total CRT implantations 2016 | |||||
|---|---|---|---|---|---|---|
| Country | ISO code | Absolute number | Per million inhabitants | Absolute number | Per million inhabitants | Change % |
| Albania | AL | N/A | N/A | 22 | 7 | N/A |
| Algeria | DZ | 108 | 2.73 | 89 | 2 | −19.1% |
| Armenia | AM | 10 | 3.27 | 20 | 7 | 100.3% |
| Austria | AT | 1 364 | 157.40 | 1 270 | 146 | −7.4% |
| Azerbaijan | AZ | 24 | 2.45 | 65 | 7 | 168.3% |
| Belarus | BY | 100 | 10.53 | 60 | 6 | −40.5% |
| Belgium* | BE | 1 485 | 131.14 | N/A | N/A | N/A |
| Bosnia & Herzegovina | BA | 17 | 4.40 | 17 | 4 | 0.1% |
| Bulgaria | BG | 296 | 41.19 | 371 | 52 | 26.1% |
| Croatia | HR | 261 | 58.46 | 277 | 64 | 9.8% |
| Cyprus | CY | 30 | 25.23 | 25 | 21 | −17.8% |
| Czech Republic | CZ | 1 952 | 183.38 | 2 093 | 196 | 7.1% |
| Denmark | DK | 985 | 176.48 | 1 129 | 202 | 14.4% |
| Egypt | EG | 545 | 6.16 | 626 | 7 | 7.4% |
| Estonia | EE | 73 | 57.69 | 44 | 35 | −39.4% |
| Finland | FI | 527 | 96.22 | 578 | 105 | 9.3% |
| France | FR | 10 432 | 156.75 | 10 732 | 161 | 2.4% |
| Georgia Rebublic of | GE | 62 | 12.57 | 112 | 23 | 80.8% |
| Germany | DE | 21 139 | 261.45 | 21 550 | 267 | 2.1% |
| Greece | GR | 726 | 67.37 | 750 | 70 | 3.3% |
| Hungary | HU | 1 091 | 110.23 | 1 107 | 112 | 1.7% |
| Iceland | IS | 21 | 63.27 | 19 | 57 | −10.6% |
| Ireland | IE | 319 | 65.20 | 330 | 67 | 2.2% |
| Israel | IL | 1 452 | 180.39 | 1 435 | 176 | −2.7% |
| Italy | IT | 12 815 | 207.18 | 13 100 | 211 | 2.0% |
| Kazakhstan | KZ | 314 | 17.29 | 414 | 23 | 30.4% |
| Kosovo* | XK | 4 | 2.14 | N/A | N/A | N/A |
| Kyrgyzstan* | KGZ | N/A | N/A | N/A | N/A | N/A |
| Latvia | LV | 107 | 53.86 | 111 | 56 | 4.8% |
| Lebanon* | LB | N/A | N/A | N/A | N/A | N/A |
| Libya* | LY | N/A | N/A | N/A | N/A | N/A |
| Lithuania | LT | 195 | 67.60 | 181 | 63 | −6.2% |
| Luxembourg | LU | 34 | 59.62 | 36 | 62 | 3.7% |
| FYR Macedonia | MK | 38 | 18.13 | 56 | 27 | 47.1% |
| Malta | MT | 41 | 99.04 | 39 | 94 | −5.2% |
| Moldova* | MD | N/A | N/A | N/A | N/A | N/A |
| Montenegro | ME | 19 | 29.36 | 31 | 48 | 63.8% |
| Morocco | MA | 84 | 2.52 | 81 | 2 | −4.5% |
| Netherlands | NL | 2 000 | 118.01 | 2 100 | 123 | 4.6% |
| Norway | NO | 562 | 107.92 | 520 | 99 | −8.5% |
| Poland | PL | 3 964 | 102.79 | 4 164 | 108 | 5.2% |
| Portugal | PT | 772 | 71.31 | 801 | 74 | 3.7% |
| Romania | RO | 276 | 12.74 | 421 | 19 | 53.0% |
| Russian Federation | RU | 1 006 | 7.06 | 995 | 7 | −1.0% |
| San Marino | SM | 2 | 60.57 | 2 | 60 | −0.8% |
| Serbia | RS | 313 | 43.61 | 313 | 44 | 0.5% |
| Slovakia | SK | 588 | 108.57 | 490 | 90 | −17.1% |
| Slovenia | SI | 164 | 82.69 | 135 | 68 | −17.5% |
| Spain | ES | 3 415 | 70.93 | 3 156 | 65 | −8.4% |
| Sweden | SE | 1 512 | 154.26 | 1 702 | 172 | 11.7% |
| Switzerland | CH | 1 148 | 141.35 | 957 | 117 | −17.2% |
| Syria* | SY | N/A | N/A | N/A | N/A | N/A |
| Tunisia | TN | 210 | 19.03 | 190 | 17 | −10.3% |
| Turkey | TR | 2 810 | 35.69 | 3 485 | 43 | 21.7% |
| Ukraine | UA | 73 | 1.64 | 72 | 2 | −0.9% |
| United Kingdom | GB | 10 198 | 159.12 | 11 381 | 177 | 11.0% |
| Total ESC member countries | 85 683 | 83 | 87 654 | 85 | 2.3% | |
These 7 countries did not submit any data on CRT implantations for the EHRA White Book 2017
Trends in CRT implantation activity over the past 10 years
The number of CRT implantations in the European and non-European ESC member countries from 2007 to 2016 and comparison with the total ESC area and the 28 member countries of the European Union (EU28) are shown in Figure 57. The corresponding numbers for the European ESC regions are presented in Figure 58. The changes in the number of implanting centres and CRT implantations per million inhabitants in each participating country from 2007 to 2016 are shown in Figure 59 and Figure 60, respectively. During these ten years, the growth in CRT implantation rate per million population was highest in the Eastern European (235%) followed by the Northern (157%) and the non-European ESC member countries (146%). Countries with the highest and lowest activities in each region and trends over the ten-year period are shown in Figures 61-65. The growth in the CRT implantation rate exceeded 100% in most countries, and only in Armenia the rate of the implantations was lower in 2016 than in 2007. The changes in the number of CRT-P and CRT-D implantations from 2007 to 2016 in each participating country are shown in Figure 66 and Figure 67, respectively.
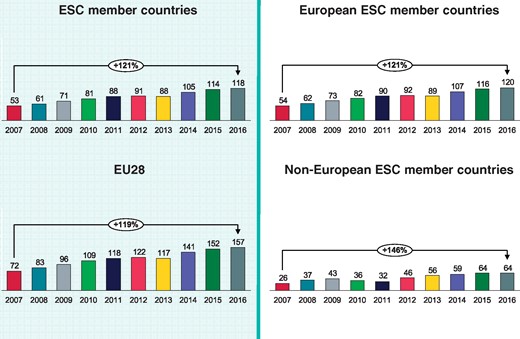
Cardiac resynchronization therapy device implantations per million inhabitants 2007-2016 in the European and non-European ESC member countries and comparison to the total ESC area and the 28 member countries of the European Union (EU28).
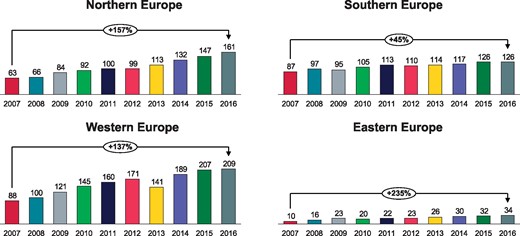
Cardiac resynchronization therapy device implantations per million inhabitants 2007-2016 in the four European ESC regions.
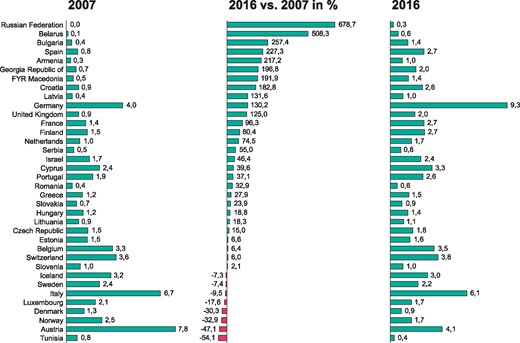
Change in the number of CRT implanting centres per million inhabitants from 2007 to 2016.
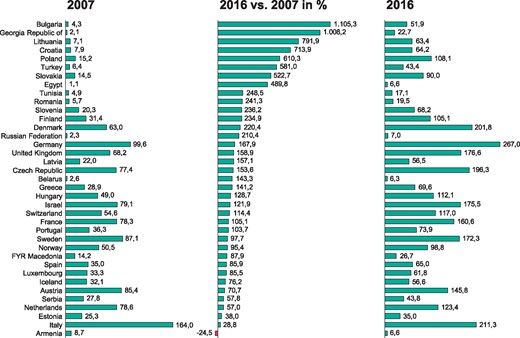
Change in the number of total CRT implantations per million inhabitants from 2007 to 2016.
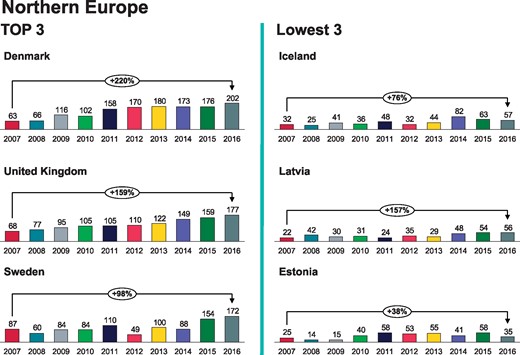
Cardiac resynchronization therapy implantations per million inhabitants 2007-2016 in Northern Europe.
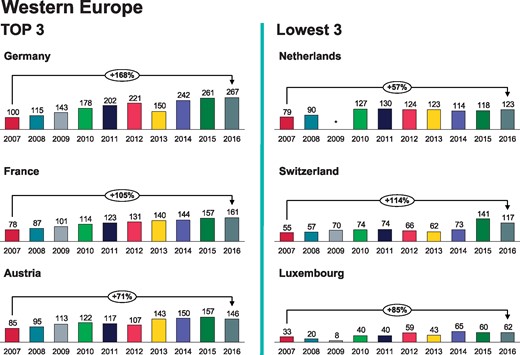
Cardiac resynchronization therapy implantations per million inhabitants 2007-2016 in Western Europe. *No data available.
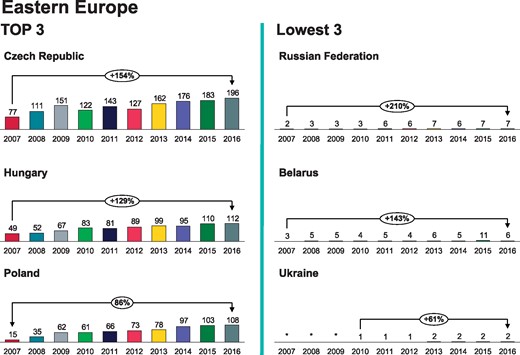
Cardiac resynchronization therapy implantations per million inhabitants 2007-2016 in Eastern Europe. *No data available.
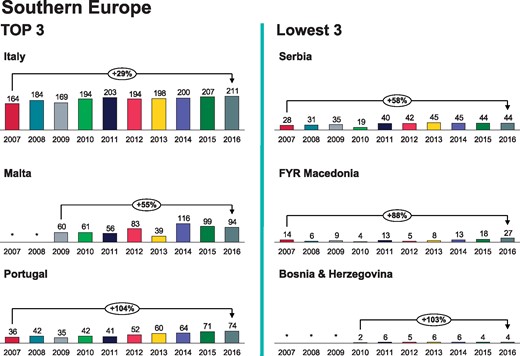
Cardiac resynchronization therapy implantations per million inhabitants 2007-2016 in Southern Europe. *No data available.
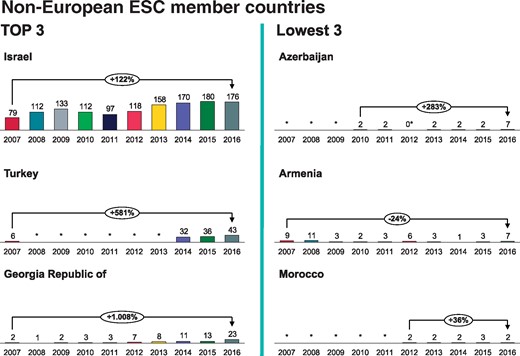
Cardiac resynchronization therapy implantations per million inhabitants 2007-2016 in the non-European ESC member countries. *No data available.
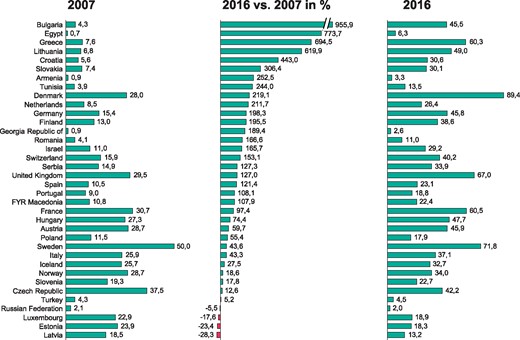
Change in the number of CRT-P implantations per million inhabitants from 2007 to 2016.
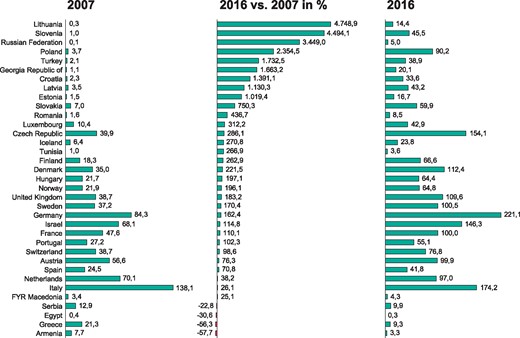
Change in the number of CRT-D implantations per million inhabitants from 2007 to 2016.
Lead extraction
General information
This was the fifth time that information on lead extractions (LE) was included in the EHRA White Book. Over the years the number of countries submitting data on LE procedures has been steadily increasing. This year 38 countries (79% of the ESC member countries) provided data for lead extractions (LE). Six countries submitted incomplete data and 12 countries did not submit any data on LE (Table 14). In most countries, the primary operator in LE procedures was a cardiologist.
Lead extraction facilities and rates in 2016 and comparison with 4 previous years
| Number of Lead extraction | Number of Lead extraction | Development potential - target | ||||||||||
|---|---|---|---|---|---|---|---|---|---|---|---|---|
| centres 2016 | procedures 2016 | number of lead extraction procedures | Lead extraction procedures per million inhabitants | |||||||||
| Country | ISO code | Absolute number | Per million inhabitants | Absolute number | Per million inhabitants | To attain mean ESC area level | To attain mean EU-28 level | 2012 | 2013 | 2014 | 2015 | 2016 |
| Albania | AL | 2 | 0.66 | 4 | 1.32 | 44 | 75 | N/A | N/A | N/A | N/A | 1 |
| Algeria | DZ | 3 | 0.07 | 23 | 0.57 | 577 | 989 | N/A | N/A | 1 | 1 | 1 |
| Armenia | AM | 3 | 0.98 | 0 | 0.00 | 44 | 75 | 0 | 1 | 0 | 0 | 0 |
| Austria | AT | 6 | 0.69 | 300 | 34.44 | – | – | 27 | 30 | 34 | 29 | 34 |
| Azerbaijan | AZ | 1 | 0.10 | 3 | 0.30 | 141 | 243 | N/A | 1 | 1 | 1 | 0 |
| Belarus | BY | 4 | 0.42 | 59 | 6.16 | 137 | 235 | 4 | N/A | 1 | 1 | 6 |
| Belgium* | BE | N/A | N/A | N/A | N/A | N/A | N/A | N/A | N/A | N/A | N/A | N/A |
| Bosnia & Herzegovina* | BA | N/A | N/A | N/A | N/A | N/A | N/A | N/A | 0 | 0 | 0 | N/A |
| Bulgaria | BG | 1 | 0.14 | 14 | 1.96 | 102 | 176 | N/A | 2 | 0 | N/A | 2 |
| Croatia | HR | 3 | 0.70 | 53 | 12.29 | 62 | 106 | 2 | 0 | 7 | 11 | 12 |
| Cyprus | CY | 2 | 1.66 | 3 | 2.49 | 17 | 30 | 0 | 2 | 3 | 3 | 2 |
| Czech Republic | CZ | 5 | 0.47 | 350 | 32.83 | – | – | 29 | 30 | 17 | 28 | 33 |
| Denmark** | DK | 4 | 0.72 | N/A | N/A | N/A | N/A | N/A | N/A | N/A | N/A | N/A |
| Egypt | EG | 2 | 0.02 | 30 | 0.32 | 1 356 | 2 326 | 0 | 0 | 0 | 0 | 0 |
| Estonia** | EE | 2 | 1.59 | N/A | N/A | N/A | N/A | N/A | N/A | N/A | N/A | N/A |
| Finland** | FI | 5 | 0.91 | N/A | N/A | N/A | N/A | N/A | N/A | 3 | N/A | N/A |
| France | FR | 40 | 0.60 | 2 800 | 41.89 | – | – | 30 | N/A | 33 | 45 | 42 |
| Georgia Rebublic of | GE | N/A | N/A | 4 | 0.81 | 71 | 121 | N/A | 0 | 1 | N/A | 1 |
| Germany | DE | 126 | 1.56 | 2 451 | 30.36 | – | – | 10 | N/A | 61 | 29 | 30 |
| Greece | GR | 5 | 0.46 | 70 | 6.50 | 154 | 265 | 2 | 3 | 5 | 5 | 6 |
| Hungary | HU | 8 | 0.81 | 145 | 14.68 | – | 243 | 7 | 13 | 10 | 11 | 15 |
| Iceland | IS | 0 | 0.00 | 0 | 0.00 | 5 | 8 | 0 | 0 | 3 | 0 | 0 |
| Ireland** | IE | 4 | 0.81 | N/A | N/A | N/A | N/A | N/A | N/A | N/A | N/A | N/A |
| Israel | IL | 5 | 0.61 | 90 | 11.01 | 117 | 201 | 0 | N/A | 10 | 10 | 11 |
| Italy* | IT | N/A | N/A | N/A | N/A | N/A | N/A | N/A | N/A | N/A | N/A | N/A |
| Kazakhstan | KZ | 3 | 0.16 | 32 | 1.74 | 263 | 451 | 0 | N/A | 0 | 1 | 2 |
| Kosovo* | XK | N/A | N/A | N/A | N/A | N/A | N/A | N/A | N/A | 0 | N/A | N/A |
| Kyrgyzstan** | KGZ | 3 | 0.52 | N/A | N/A | N/A | N/A | N/A | N/A | N/A | N/A | N/A |
| Latvia | LV | 1 | 0.51 | 22 | 11.19 | 28 | 48 | 3 | 4 | 5 | 10 | 11 |
| Lebanon* | LB | N/A | N/A | N/A | N/A | N/A | N/A | N/A | N/A | N/A | N/A | N/A |
| Libya* | LY | N/A | N/A | N/A | N/A | N/A | N/A | N/A | N/A | N/A | N/A | N/A |
| Lithuania | LT | 2 | 0.70 | 18 | 6.31 | 41 | 70 | 3 | 3 | 3 | 7 | 6 |
| Luxembourg | LU | 1 | 1.72 | 10 | 17.17 | – | 14 | 18 | N/A | 13 | 11 | 17 |
| FYR Macedonia | MK | 3 | 1.43 | 1 | 0.48 | 30 | 52 | 3 | 0 | 0 | 0 | 0 |
| Malta | MT | 1 | 2.41 | 9 | 21.68 | – | 10 | 0 | 0 | 17 | 22 | 22 |
| Moldova* | MD | N/A | N/A | N/A | N/A | N/A | N/A | N/A | 1 | N/A | N/A | N/A |
| Montenegro | ME | 0 | 0.00 | 0 | 0.00 | 9 | 16 | 0 | 0 | 0 | 0 | 0 |
| Morocco | MA | 2 | 0.06 | 5 | 0.15 | 482 | 827 | 0 | 0 | 0 | 0 | 0 |
| Netherlands | NL | 12 | 0.71 | 400 | 23.51 | – | 418 | N/A | 24 | 30 | 7 | 24 |
| Norway | NO | 3 | 0.57 | 200 | 37.99 | – | – | 36 | 42 | 43 | 37 | 38 |
| Poland | PL | 22 | 0.57 | 1 272 | 33.02 | – | – | 14 | 12 | 16 | 27 | 33 |
| Portugal | PT | 6 | 0.55 | 91 | 8.40 | 155 | 266 | N/A | N/A | N/A | N/A | 8 |
| Romania | RO | 5 | 0.23 | 31 | 1.44 | 309 | 531 | 0 | 0 | 0 | 1 | 1 |
| Russian Federation* | RU | N/A | N/A | N/A | N/A | N/A | N/A | N/A | N/A | N/A | N/A | N/A |
| San Marino | SM | 0 | 0.00 | 1 | 30.04 | – | – | 0 | 0 | N/A | 0 | 30 |
| Serbia | RS | 1 | 0.14 | 24 | 3.36 | 102 | 176 | 7 | 5 | 9 | 4 | 3 |
| Slovakia | SK | 3 | 0.55 | 82 | 15.06 | – | 134 | 25 | 20 | 25 | 22 | 15 |
| Slovenia** | SI | 1 | 0.51 | N/A | N/A | N/A | N/A | N/A | N/A | N/A | N/A | N/A |
| Spain | ES | 35 | 0.72 | 400 | 8.24 | 696 | 1 193 | N/A | N/A | N/A | 8 | 8 |
| Sweden | SE | 5 | 0.51 | 275 | 27.83 | – | – | 22 | 51 | 46 | N/A | 28 |
| Switzerland** | CH | 8 | 0.98 | N/A | N/A | N/A | N/A | N/A | 11 | 11 | N/A | N/A |
| Syria* | SY | N/A | N/A | N/A | N/A | N/A | N/A | N/A | N/A | N/A | N/A | N/A |
| Tunisia | TN | 4 | 0.36 | 33 | 2.96 | 160 | 274 | 7 | N/A | 2 | N/A | 3 |
| Turkey* | TR | N/A | N/A | N/A | N/A | N/A | N/A | N/A | N/A | 4 | 5 | N/A |
| Ukraine | UA | 9 | 0.20 | 69 | 1.56 | 633 | 1 086 | 1 | 1 | 1 | 1 | 2 |
| United Kingdom* | GB | N/A | N/A | N/A | N/A | N/A | N/A | N/A | N/A | N/A | N/A | N/A |
| Total ESC member countries | 361 | 0.53 | 9 374 | 14.33 | 5.42 | 5.53 | 5.91 | 7.61 | 8.73 | |||
These 11 countries did not submit data on LE for the EHRA White Book 2017.
These 7 countries only submitted data on LE centres for the EHRA White Book 2017.
Lead extraction facilities and procedure rates
A total of 9374 LE procedures were performed in 361 LE centres in 2016 (Table 14). The mean number of centres performing LE was 0.53 per million inhabitants (Figure 68), and the mean number of LE was 14.3 per million (Figure 69). Assuming that each centre treated an equivalent number of patients it can be approximated that in many centres the number of LE was lower than the recommended annual rate of at least 15 extractions per million inhabitants (12–14). The rate of LE was highest in France (41.9 per million population) followed by Norway (38.0) and Austria (34.4). Due to missing or incomplete data and a very low LE rate in some countries, we chose not to provide full representation of the regional LE data.
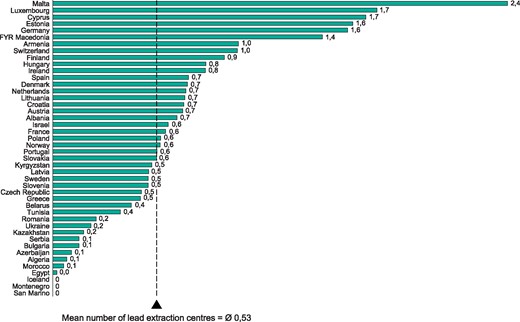
Lead extraction centres per million inhabitants in 2016. The mean number of lead extraction centres is weighted by population.
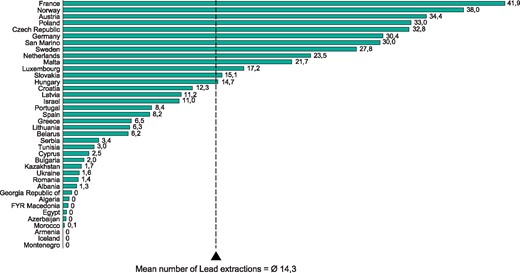
Lead extractions per million inhabitants in 2016. The mean number of lead extractions is weighted by population.
Catheter ablation
General information
This year 48 countries (86% of the ESC member countries) submitted complete data and eight countries did not provide any data on catheter ablation facilities and procedures for the EHRA White Book. A major issue in 2016 was that no ablation data was received from Belgium, which is known to have well developed ablation programs. A national registry for catheter ablations was available in 16 countries (Table 15).
Catheter ablation facilities and rates in 2016 and comparison to the four previous years
| Number of ablation | Development potential - target | ||||||||||||
|---|---|---|---|---|---|---|---|---|---|---|---|---|---|
| centres 2016 | Ablation procedures 2016 | number of ablation procedures | Ablation procedures per million inhabitants | ||||||||||
| Country | ISO code | National Registry for EP | Absolute number | Per million inhabitants | Absolute number | Per million inhabitants | To attain mean ESC area level | To attain mean EU-28 level | 2012 | 2013 | 2014 | 2015 | 2016 |
| Albania* | AL | No | 2 | 0.66 | N/A | N/A | N/A | N/A | N/A | N/A | N/A | N/A | N/A |
| Algeria | DZ | No | 3 | 0.07 | 374 | 9 | 11 614 | 17 792 | N/A | 6 | 6 | 8 | 9 |
| Armenia | AM | No | 3 | 0.98 | 52 | 17 | 880 | 1 348 | 23 | 46 | 43 | 16 | 17 |
| Austria | AT | Yes | 19 | 2.18 | 3 342 | 384 | – | 3 850 | 339 | 294 | 319 | 320 | 384 |
| Azerbaijan | AZ | No | 5 | 0.51 | 742 | 75 | 2 848 | 4 363 | N/A | 24 | 40 | 41 | 75 |
| Belarus | BY | No | 7 | 0.73 | 1 138 | 119 | 2 761 | 4 229 | 54 | 76 | 84 | 105 | 119 |
| Belgium* | BE | No | N/A | N/A | N/A | N/A | N/A | N/A | 564 | 580 | 586 | 626 | N/A |
| Bosnia & Herzegovina* | BA | No | 1 | 0.26 | N/A | N/A | N/A | N/A | 1 | N/A | N/A | ||
| Bulgaria | BG | Yes | 4 | 0.56 | 1 136 | 159 | 2 061 | 3 157 | 60 | 54 | 96 | 134 | 159 |
| Croatia | HR | No | 6 | 1.39 | 1 810 | 420 | – | 1 906 | 132 | 183 | 191 | 302 | 420 |
| Cyprus | CY | No | 4 | 3.32 | 78 | 65 | 348 | 533 | 35 | 39 | 121 | 50 | 65 |
| Czech Republic | CZ | Yes | 23 | 2.16 | 6 577 | 617 | – | – | 474 | 482 | 551 | 578 | 617 |
| Denmark | DK | Yes | 6 | 1.07 | 4 125 | 737 | – | – | 590 | 652 | 694 | 703 | 737 |
| Egypt | EG | No | 16 | 0.17 | 1 592 | 17 | 27 307 | 41 833 | 11 | 12 | 16 | 16 | 17 |
| Estonia | EE | No | 2 | 1.59 | 459 | 365 | – | 556 | 260 | 302 | 327 | 337 | 365 |
| Finland | FI | No | 9 | 1.64 | 2 957 | 538 | – | – | 418 | 418 | 422 | 466 | 538 |
| France | FR | No | 135 | 2.02 | 38 855 | 581 | – | – | 502 | 547 | 595 | 652 | 581 |
| Georgia Rebublic of | GE | No | 8 | 1.62 | 464 | 94 | 1 422 | 2 178 | 75 | 54 | 72 | 82 | 94 |
| Germany | DE | No | 293 | 3.63 | 80 661 | 999 | – | – | 467 | 412 | 741 | 789 | 999 |
| Greece | GR | Yes | 29 | 2.69 | 1 950 | 181 | 3 108 | 4 761 | 131 | 134 | 153 | 159 | 181 |
| Hungary | HU | No | 11 | 1.11 | 3 769 | 382 | – | 4 364 | 314 | 338 | 350 | 376 | 382 |
| Iceland | IS | No | 1 | 2.98 | 173 | 515 | – | – | 239 | 254 | 239 | 235 | 515 |
| Ireland | IE | No | 12 | 2.42 | 2 300 | 464 | – | – | 212 | 209 | N/A | N/A | 464 |
| Israel* | IL | No | 16 | 1.96 | N/A | N/A | N/A | N/A | N/A | N/A | N/A | N/A | N/A |
| Italy | IT | No | N/A | N/A | 26 982 | 435 | – | 27 401 | N/A | N/A | N/A | 421 | 435 |
| Kazakhstan | KZ | No | 12 | 0.65 | 3 089 | 168 | 5 296 | 8 113 | 57 | 83 | 112 | 136 | 168 |
| Kosovo* | XK | No | N/A | N/A | N/A | N/A | N/A | N/A | N/A | N/A | N/A | N/A | |
| Kyrgyzstan | KGZ | No | 1 | 0.17 | 21 | 4 | 1 652 | 2 531 | N/A | N/A | 10 | 10 | 4 |
| Latvia | LV | Yes | 2 | 1.02 | 697 | 355 | – | 869 | 269 | 238 | 295 | 365 | 355 |
| Lebanon* | LB | N/A | N/A | N/A | N/A | N/A | N/A | N/A | N/A | 24 | 36 | N/A | N/A |
| Libya* | LY | N/A | N/A | N/A | N/A | N/A | N/A | N/A | N/A | N/A | N/A | N/A | N/A |
| Lithuania | LT | No | 3 | 1.05 | 1 061 | 372 | – | 1 261 | 243 | 239 | 252 | 374 | 372 |
| Luxembourg | LU | No | 1 | 1.72 | 185 | 318 | – | 257 | 301 | 251 | 303 | 254 | 318 |
| FYR Macedonia | MK | No | 2 | 0.95 | 158 | 75 | 606 | 928 | 30 | 38 | 50 | 79 | 75 |
| Malta | MT | No | 1 | 2.41 | 37 | 89 | 120 | 183 | 24 | 29 | 73 | 77 | 89 |
| Moldova* | MD | Yes | 1 | 0.28 | 45 | 13 | 1 013 | 1 551 | N/A | N/A | N/A | 13 | |
| Montenegro | ME | No | 1 | 1.55 | 80 | 124 | 186 | 285 | 149 | 69 | 102 | 128 | 124 |
| Morocco | MA | N/A | 5 | 0.15 | 200 | 6 | 9 708 | 14 872 | 7 | 5 | 5 | 2 | 6 |
| Netherlands | NL | Yes | 16 | 0.94 | 8 750 | 514 | – | – | 382 | N/A | 495 | 502 | 514 |
| Norway | NO | No | 5 | 0.95 | 3 307 | 628 | – | – | 530 | 507 | 575 | 589 | 628 |
| Poland | PL | No | 91 | 2.36 | 12 439 | 323 | – | 17 023 | 229 | 248 | 285 | 280 | 323 |
| Portugal | PT | No | 21 | 1.94 | 2 974 | 275 | 3 125 | 4 787 | 186 | 191 | 215 | 238 | 275 |
| Romania | RO | No | 14 | 0.65 | 1 180 | 55 | 6 231 | 9 545 | 50 | 60 | 62 | 55 | 55 |
| Russian Federation | RU | Yes | 72 | 0.51 | 22 618 | 159 | 41 063 | 62 906 | 120 | 149 | 168 | 176 | 159 |
| San Marino | SM | Yes | 0 | 0.00 | 0 | 0 | 10 | 15 | |||||
| Serbia | RS | Yes | 4 | 0.56 | 1 030 | 144 | 2 061 | 3 157 | 134 | 144 | 145 | 147 | 144 |
| Slovakia | SK | Yes | 4 | 0.73 | 1 329 | 244 | 1 571 | 2 406 | 168 | 195 | 202 | 222 | 244 |
| Slovenia | SI | Yes | 2 | 1.01 | 639 | 323 | – | 874 | 136 | 140 | 220 | 359 | 323 |
| Spain | ES | Yes | 80 | 1.65 | 13 378 | 275 | 14 008 | 21 460 | 236 | 257 | 270 | 267 | 275 |
| Sweden | SE | No | 11 | 1.11 | 4 887 | 495 | – | – | 472 | 459 | 490 | 486 | 495 |
| Switzerland | CH | Yes | 25 | 3.06 | 6 409 | 784 | – | – | 598 | 573 | 647 | 707 | 784 |
| Syria* | SY | N/A | N/A | N/A | N/A | N/A | N/A | N/A | N/A | N/A | N/A | N/A | N/A |
| Tunisia | TN | No | 15 | 1.35 | 850 | 76 | 3 212 | 4 920 | 47 | 66 | 78 | 76 | 76 |
| Turkey | TR | No | 160 | 1.99 | 10 920 | 136 | 23 156 | 35 473 | N/A | N/A | 144 | 165 | 136 |
| Ukraine | UA | No | 11 | 0.25 | 2 342 | 53 | 12 752 | 19 536 | 55 | 60 | 54 | 52 | 53 |
| United Kingdom | GB | Yes | 66 | 1.02 | 18 637 | 289 | – | 28 471 | 254 | 251 | 276 | 275 | 289 |
| Total ESC member countries | 1 241 | 1.26 | 296 798 | 288 | 213 | 220 | 271 | 286 | 306 | ||||
These 8 countries submitted either incomplete or no data on catheter ablations for the EHRA White Book 2017.
Catheter ablation facilities and procedure rates
In 2016 a total of 296798 catheter ablations including AF and VT ablations were performed in 1241 national centres across the ESC area (Table 15). The mean number of ablation centres in the ESC area was slightly lower in 2016 than in 2015 (1.26 vs. 1.34 per million population). Countries with the highest density of catheter ablation centres were Germany (3.6 per million in habitants), Cyprus (3.3), Switzerland (3.1) and Iceland (3.0), and those with the lowest density were Morocco and Algeria (0.1 in both) and San Marino with no ablation centres (Table 15 and Figure 70). The changes in the number of the ablation centres from 2015 to 2016 are summarised in Table 16 and in Figure 71.
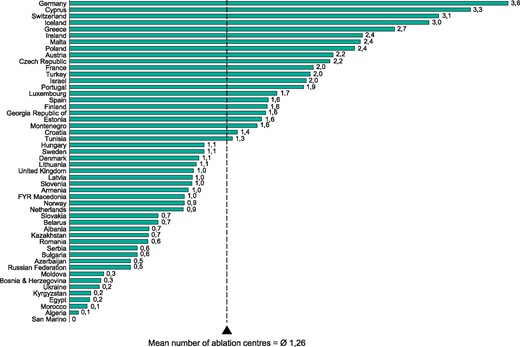
Catheter ablation centres per million inhabitants in 2016. The mean number of catheter ablation centres is weighted by population.
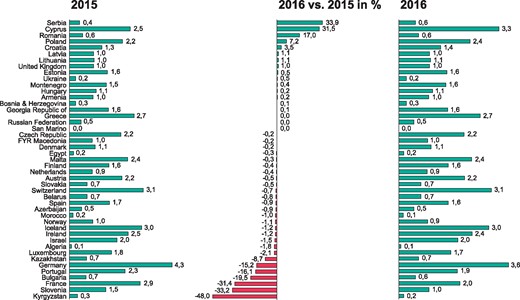
Change in the number of catheter ablation centres per million inhabitants from 2015 to 2016.
Change in the number of ablation centres in from 2015 to 2016
| Number of ablation centres 2015 | Number of ablation centres 2016 | |||||
|---|---|---|---|---|---|---|
| Country | ISO code | Absolute number | Per million inhabitants | Absolute number | Per million inhabitants | Change % |
| Albania | AL | N/A | N/A | 2 | 0.66 | N/A |
| Algeria | DZ | 3 | 0.08 | 3 | 0.07 | −1.8% |
| Armenia | AM | 3 | 0.98 | 3 | 0.98 | 0.2% |
| Austria | AT | 19 | 2.19 | 19 | 2.18 | −0.5% |
| Azerbaijan | AZ | 5 | 0.51 | 5 | 0.51 | −0.9% |
| Belarus | BY | 7 | 0.74 | 7 | 0.73 | −0.8% |
| Belgium* | BE | N/A | N/A | N/A | N/A | N/A |
| Bosnia & Herzegovina | BA | 1 | 0.26 | 1 | 0.26 | 0.1% |
| Bulgaria | BG | 5 | 0.70 | 4 | 0.56 | −19.5% |
| Croatia | HR | 6 | 1.34 | 6 | 1.39 | 3.5% |
| Cyprus | CY | 3 | 2.52 | 4 | 3.32 | 31.5% |
| Czech Republic | CZ | 23 | 2.16 | 23 | 2.16 | −0.2% |
| Denmark | DK | 6 | 1.07 | 6 | 1.07 | −0.2% |
| Egypt | EG | 15 | 0.17 | 16 | 0.17 | −0.3% |
| Estonia | EE | 2 | 1.58 | 2 | 1.59 | 0.5% |
| Finland | FI | 9 | 1.64 | 9 | 1.64 | −0.4% |
| France | FR | 196 | 2.94 | 135 | 2.02 | −31.4% |
| Georgia Republic of | GE | 8 | 1.62 | 8 | 1.62 | 0.1% |
| Germany | DE | 346 | 4.28 | 293 | 3.63 | −15.2% |
| Greece | GR | 29 | 2.69 | 29 | 2.69 | 0.0% |
| Hungary | HU | 11 | 1.11 | 11 | 1.11 | 0.2% |
| Iceland | IS | 1 | 3.01 | 1 | 2.98 | −1.2% |
| Ireland | IE | 12 | 2.45 | 12 | 2.42 | −1.2% |
| Israel | IL | 16 | 1.99 | 16 | 1.96 | −1.5% |
| Italy* | IT | N/A | N/A | N/A | N/A | N/A |
| Kazakhstan | KZ | 13 | 0.72 | 12 | 0.65 | −8.7% |
| Kosovo* | XK | N/A | N/A | N/A | N/A | N/A |
| Kyrgyzstan | KGZ | 2 | 0.34 | 1 | 0.17 | −48.0% |
| Latvia | LV | 2 | 1.01 | 2 | 1.02 | 1.1% |
| Lebanon* | LB | N/A | N/A | N/A | N/A | N/A |
| Libya* | LY | N/A | N/A | N/A | N/A | N/A |
| Lithuania | LT | 3 | 1.04 | 3 | 1.05 | 1.1% |
| Luxembourg | LU | 1 | 1.75 | 1 | 1.72 | −2.1% |
| FYR Macedonia | MK | 2 | 0.95 | 2 | 0.95 | −0.2% |
| Malta | MT | 1 | 2.42 | 1 | 2.41 | −0.3% |
| Moldova | MD | N/A | N/A | 1 | 0.28 | N/A |
| Montenegro | ME | 1 | 1.55 | 1 | 1.55 | 0.4% |
| Morocco | MA | 5 | 0.15 | 5 | 0.15 | −1.0% |
| Netherlands | NL | 16 | 0.94 | 16 | 0.94 | −0.4% |
| Norway | NO | 5 | 0.96 | 5 | 0.95 | −1.1% |
| Poland | PL | 85 | 2.20 | 91 | 2.36 | 7.2% |
| Portugal | PT | 25 | 2.31 | 21 | 1.94 | −16.1% |
| Romania | RO | 12 | 0.55 | 14 | 0.65 | 17.0% |
| Russian Federation | RU | 69 | 0.48 | 72 | 0.51 | 4.4% |
| San Marino | SM | 0 | 0 | 0 | 0.00 | 0.0% |
| Serbia | RS | 3 | 0.42 | 4 | 0.56 | 33.9% |
| Slovakia | SK | 4 | 0.74 | 4 | 0.73 | −0.5% |
| Slovenia | SI | 3 | 1.51 | 2 | 1.01 | −33.2% |
| Spain | ES | 80 | 1.66 | 80 | 1.65 | −0.9% |
| Sweden | SE | N/A | N/A | 11 | 1.11 | N/A |
| Switzerland | CH | 25 | 3.08 | 25 | 3.06 | −0.7% |
| Syria* | SY | N/A | N/A | N/A | N/A | N/A |
| Tunisia | TN | N/A | N/A | 15 | 1.35 | N/A |
| Turkey | TR | N/A | N/A | 160 | 1.99 | N/A |
| Ukraine | UA | 11 | 0.25 | 11 | 0.25 | 0.5% |
| United Kingdom | GB | 65 | 1.01 | 66 | 1.02 | 1.0% |
| Total ESC member countries | 1 159 | 1.34 | 1 241 | 1.26 | -5.6% | |
These 6 countries did not submit any data on ablation centres for the EHRA White Book 2017.
The number of catheter ablations per million population in the participating ESC member countries is shown in Figure 72. The mean number of catheter ablation was slightly higher in 2016 than in the previous year (288 vs. 259 per million population). As seen in Figures 72 and 73 there was marked heterogeneity in the catheter ablation activities in the ESC area. As in previous years, most countries in the top quartile were from Western and Northern Europe, while the non-European ESC member countries had low ablation activity and they were mostly found in the lowest (1st) quartile. In the Eastern European countries, the ablation activity spanned over all four quartiles. The most active countries were Germany, Switzerland and Denmark with 999, 784 and, 737 catheter ablations per million population, respectively. In San Marino, no ablations were performed.
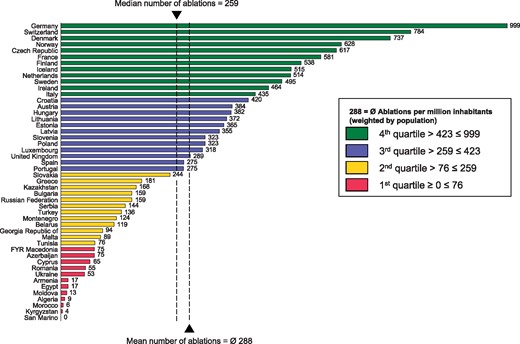
Catheter ablations per million inhabitants in 2016. The mean number of ablations is weighted by population.
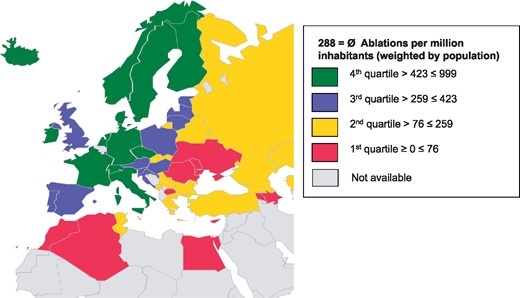
Catheter ablations in the ESC member countries in 2016.
The changes in the number of ablation procedures from 2015 to 2016 are presented in Table 17 and Figure 74, and a comparison to the previous four years in each participating ESC member country is shown in Table 15. Compared to the previous year the rate of ablations per million population was quite stable, and only three countries (i.e., Morocco, Iceland and Azerbaijan) reported more than 50% increase in the procedure rate. In Kyrgyzstan, the ablation rate decreased 63%. The relationship between the mean annual catheter ablation rate per million inhabitants and the number of catheter ablation centres per million inhabitants in the ESC member countries and in the EU28 is shown in Figure 75.
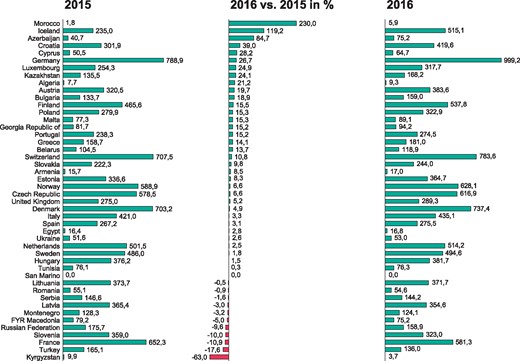
Change in the number of catheter ablations per million inhabitants from 2015 to 2016.
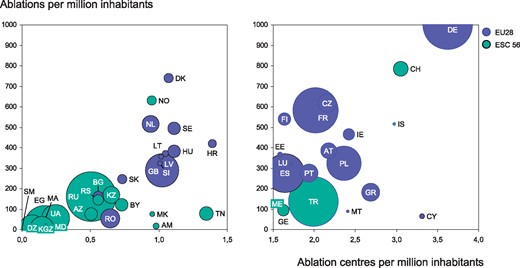
Catheter ablation centres and rates in the ESC and European Union (EU28) member countries in 2016. Bubble size is related to population in the country.
Change in the number of catheter ablations from 2015 to 2016
| Total ablations 2015 | Total ablations 2016 | |||||
|---|---|---|---|---|---|---|
| Country | ISO code | Absolute number | Per million inhabitants | Absolute number | Per million inhabitants | Change % |
| Albania* | AL | N/A | N/A | N/A | N/A | N/A |
| Algeria | DZ | 303 | 8 | 374 | 9 | 21.2% |
| Armenia | AM | 48 | 16 | 52 | 17 | 8.5% |
| Austria | AT | 2 777 | 320 | 3 342 | 384 | 19.7% |
| Azerbaijan | AZ | 398 | 41 | 742 | 75 | 84.7% |
| Belarus | BY | 993 | 105 | 1 138 | 119 | 13.7% |
| Belgium* | BE | 7 091 | 626 | N/A | N/A | N/A |
| Bosnia & Herzegovina* | BA | N/A | N/A | N/A | N/A | N/A |
| Bulgaria | BG | 961 | 134 | 1 136 | 159 | 18.9% |
| Croatia | HR | 1 348 | 302 | 1 810 | 420 | 39.0% |
| Cyprus | CY | 60 | 50 | 78 | 65 | 28.2% |
| Czech Republic | CZ | 6 158 | 578 | 6 577 | 617 | 6.6% |
| Denmark | DK | 3 925 | 703 | 4 125 | 737 | 4.9% |
| Egypt | EG | 1 448 | 16 | 1 592 | 17 | 2.8% |
| Estonia | EE | 426 | 337 | 459 | 365 | 8.3% |
| Finland | FI | 2 550 | 466 | 2 957 | 538 | 15.5% |
| France | FR | 43 414 | 652 | 38 855 | 581 | −10.9% |
| Georgia Republic of | GE | 403 | 82 | 464 | 94 | 15.2% |
| Germany | DE | 63 790 | 789 | 80 661 | 999 | 26.7% |
| Greece | GR | 1 710 | 159 | 1 950 | 181 | 14.1% |
| Hungary | HU | 3 723 | 376 | 3 769 | 382 | 1.5% |
| Iceland | IS | 78 | 235 | 173 | 515 | 119.2% |
| Ireland | IE | N/A | N/A | 2 300 | 464 | N/A |
| Israel* | IL | N/A | N/A | N/A | N/A | N/A |
| Italy | IT | 26 044 | 421 | 26 982 | 435 | 3.3% |
| Kazakhstan | KZ | 2 461 | 136 | 3 089 | 168 | 24.1% |
| Kosovo* | XK | N/A | N/A | N/A | N/A | N/A |
| Kyrgyzstan | KGZ | 59 | 10 | 21 | 4 | −63.0% |
| Latvia | LV | 726 | 365 | 697 | 355 | −3.0% |
| Lebanon* | LB | N/A | N/A | N/A | N/A | N/A |
| Libya* | LY | N/A | N/A | N/A | N/A | N/A |
| Lithuania | LT | 1 078 | 374 | 1 061 | 372 | −0.5% |
| Luxembourg | LU | 145 | 254 | 185 | 318 | 24.9% |
| FYR Macedonia | MK | 166 | 79 | 158 | 75 | −5.0% |
| Malta | MT | 32 | 77 | 37 | 89 | 15.3% |
| Moldova | MD | N/A | N/A | 45 | 13 | N/A |
| Montenegro | ME | 83 | 128 | 80 | 124 | −3.2% |
| Morocco | MA | 60 | 2 | 200 | 6 | 230.0% |
| Netherlands | NL | 8 500 | 502 | 8 750 | 514 | 2.5% |
| Norway | NO | 3 067 | 589 | 3 307 | 628 | 6.6% |
| Poland | PL | 10 795 | 280 | 12 439 | 323 | 15.3% |
| Portugal | PT | 2 580 | 238 | 2 974 | 275 | 15.2% |
| Romania | RO | 1 194 | 55 | 1 180 | 55 | −0.9% |
| Russian Federation | RU | 25 020 | 176 | 22 618 | 159 | −9.6% |
| San Marino | SM | 0 | 0 | 0 | 0 | 0.0% |
| Serbia | RS | 1 052 | 147 | 1 030 | 144 | −1.6% |
| Slovakia | SK | 1 204 | 222 | 1 329 | 244 | 9.8% |
| Slovenia | SI | 712 | 359 | 639 | 323 | −10.0% |
| Spain | ES | 12 863 | 267 | 13 378 | 275 | 3.1% |
| Sweden | SE | 4 764 | 486 | 4 887 | 495 | 1.8% |
| Switzerland | CH | 5 746 | 707 | 6 409 | 784 | 10.8% |
| Syria* | SY | N/A | N/A | N/A | N/A | N/A |
| Tunisia | TN | 840 | 76 | 850 | 76 | 0.3% |
| Turkey | TR | 13 000 | 165 | 10 920 | 136 | −17.6% |
| Ukraine | UA | 2 294 | 52 | 2 342 | 53 | 2.6% |
| United Kingdom | GB | 17 622 | 275 | 18 637 | 289 | 5.2% |
| Total ESC member countries | 283 711 | 278 | 296 798 | 288 | 3.9% | |
These 8 countries did not submit any data on ablations for the EHRA White Book 2017.
Trends in catheter ablation activity over the past 10 years
The changes in the number of ablation centres in the various ESC member countries from 2007 to 2016 are shown in Figure 76. During the 10-year period, the number of ablation centres increased in all participating countries except for Austria, Hungary, Luxembourg and France.
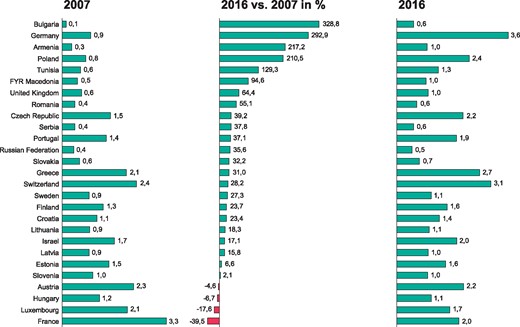
Change in the number of catheter ablation centres per million inhabitants from 2007 to 2016.
The number of catheter ablations in the European and non-European ESC member countries over the past 10 years and comparison with the total ESC area and the 28 member countries of the European Union (EU28) are shown in Figure 77. The corresponding numbers for the four European ESC regions are presented in Figure 78. In 2016 the rate of catheter ablations was 3-13 times higher in the Western Europe (923 per million population) than in the other ESC regions. In the non-European ESC member countries catheter ablation rate was over fivefold lower than in the European ESC member countries (71 vs. 378 per million population). The growth in the rate of catheter ablations exceeded 100% in all geographical ESC regions except for the Southern Europe. The greatest increases were reported in Belarus, Croatia, Republic of Georgia and Ireland – all with more than 500% increase in the ablation rate (Figure 79).
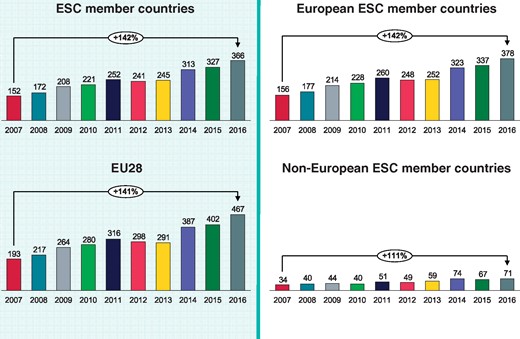
Catheter ablations per million inhabitants 2007-2016 in the European and non-European ESC member countries and comparison to the total ESC area and the 28 member countries of the European Union (EU28).
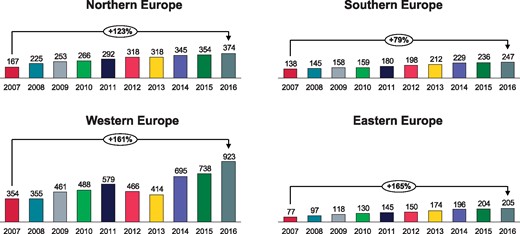
Catheter ablations per million inhabitants 2007-2016 in the four geographical regions of the ESC.
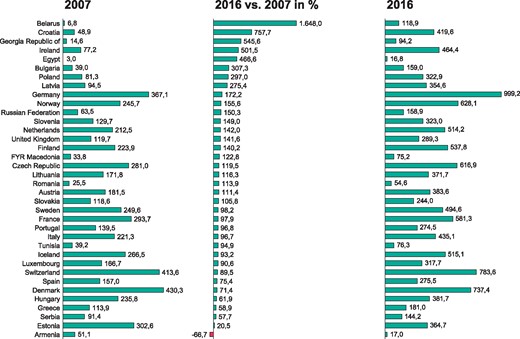
Change in the number of catheter ablations per million inhabitants from 2007 to 2016.
Ten-year data for the three most active and three least active countries in the different ESC regions are presented in Figures 80-84. The most active countries in the Northern, Western, Southern and Eastern Europe were Denmark (737 ablation per million inhabitants), Germany (999), Croatia (420) and Czech Republic (617), respectively. Among the non-European ESC member countries Kazakhstan was the most active with 168 catheter ablations per million population.
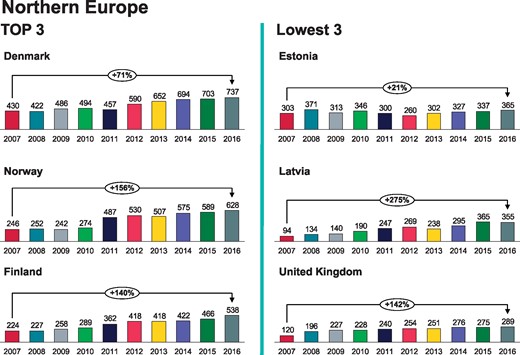
Catheter ablations per million inhabitants 2007-2016 in Northern Europe.
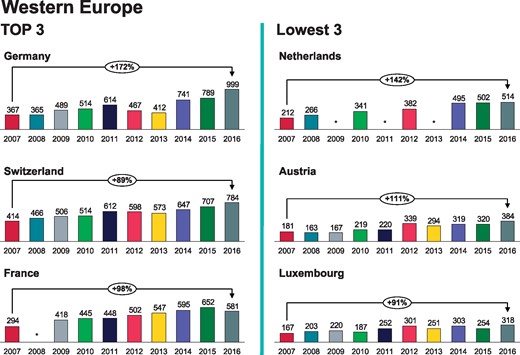
Catheter ablations per million inhabitants 2007-2016 in Western Europe. *No data available.
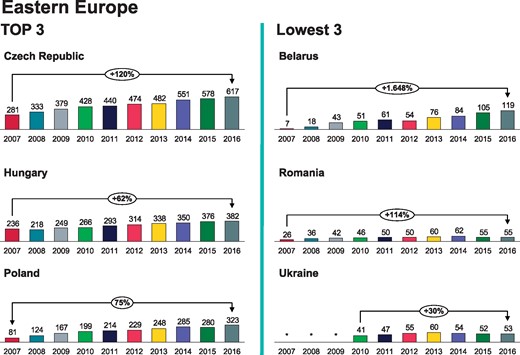
Catheter ablations per million inhabitants 2007-2016 in Eastern Europe. *No data available.
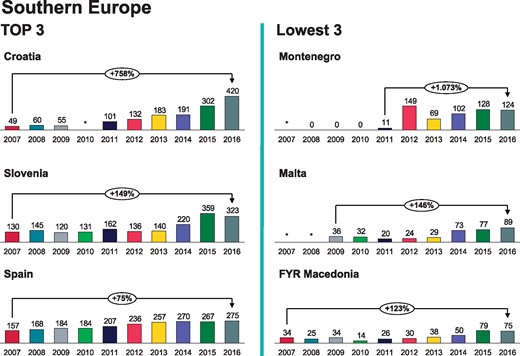
Catheter ablations per million inhabitants 2007-2016 in Southern Europe. *No data available.
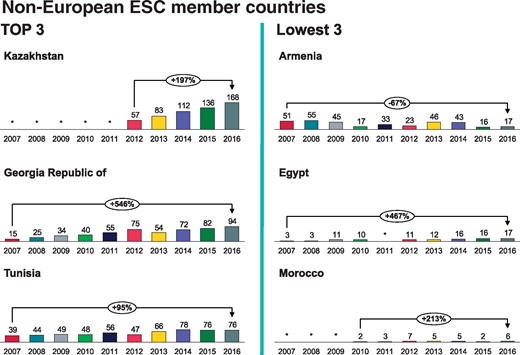
Catheter ablations per million inhabitants 2007-2016 in the non-European ESC member countries. *No data available.
Atrial fibrillation ablation rates
The data from the 47 ESC member countries (84%) that submitted data on atrial fibrillation (AF) ablation for the EHRA White Book are listed in Table 18. In 2016 a total of 113098 atrial fibrillation (AF) ablations were performed in the ESC area. Despite the increase in the total number of the ablations the rate of AF ablation was slightly smaller (110 vs. 123 per million inhabitants) than in the previous year. The most active countries were Germany (506 AF ablations per million population), Denmark (337) and Norway (319). No AF ablations were performed in Morocco, Algeria, Kyrgyzstan and San Marino (Figure 85). Nine countries including Belgium did not report data on AF ablations.
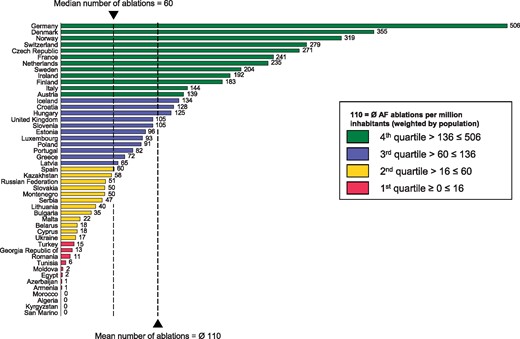
Atrial fibrillation (AF) ablations per million inhabitants in 2016. The mean number of AF ablations is weighted by population.
Atrial fibrillation ablations in 2016 and comparison with the four previous years
| Development potential - target | ||||||||||
|---|---|---|---|---|---|---|---|---|---|---|
| AF Ablation procedures 2016 | number of AF ablation procedures | AF Ablation procedures per million inhabitants | ||||||||
| Country | ISO code | Absolute number | Per million inhabitants | To attain mean ESC area level | To attain mean EU-28 level | 2012 | 2013 | 2014 | 2015 | 2016 |
| Albania* | AL | N/A | N/A | N/A | N/A | N/A | N/A | N/A | N/A | N/A |
| Algeria | DZ | 10 | 0 | 4 435 | 7 835 | N/A | 0 | 0 | 0 | 0 |
| Armenia | AM | 3 | 1 | 336 | 594 | 3 | 3 | 4 | 0 | 1 |
| Austria | AT | 1 209 | 139 | – | 1 695 | 122 | 94 | 107 | 111 | 139 |
| Azerbaijan | AZ | 10 | 1 | 1 087 | 1 921 | N/A | 0 | 0 | 1 | 1 |
| Belarus | BY | 175 | 18 | 1 054 | 1 862 | 6 | 7 | 7 | 11 | 18 |
| Belgium* | BE | N/A | N/A | N/A | N/A | 224 | 225 | 245 | 289 | N/A |
| Bosnia & Herzegovina* | BA | N/A | N/A | N/A | N/A | 0 | 0 | 0 | 0 | N/A |
| Bulgaria | BG | 248 | 35 | 787 | 1 390 | 7 | 7 | 11 | 20 | 35 |
| Croatia | HR | 551 | 128 | – | 839 | 18 | 38 | 50 | 86 | 128 |
| Cyprus | CY | 22 | 18 | 133 | 235 | 5 | 5 | 45 | 8 | 18 |
| Czech Republic | CZ | 2 884 | 271 | – | – | 177 | 196 | 216 | 238 | 271 |
| Denmark | DK | 1 988 | 355 | – | – | 262 | 290 | 305 | 337 | 355 |
| Egypt | EG | 168 | 2 | 10 427 | 18 421 | 0 | 0 | 1 | 1 | 2 |
| Estonia | EE | 121 | 96 | 139 | 245 | 27 | 56 | 78 | 87 | 96 |
| Finland | FI | 1 006 | 183 | – | 1 070 | 110 | 124 | 140 | 169 | 183 |
| France | FR | 16116 | 241 | – | – | 122 | 148 | 178 | 209 | 241 |
| Georgia Republic of | GE | 63 | 13 | 543 | 959 | 11 | 7 | 10 | 13 | 13 |
| Germany | DE | 40884 | 506 | – | – | 172 | 144 | 432 | 416 | 506 |
| Greece | GR | 780 | 72 | 1 187 | 2 096 | 37 | 40 | 52 | 60 | 72 |
| Hungary | HU | 1 236 | 125 | – | 1 921 | 75 | 86 | 109 | 122 | 125 |
| Iceland | IS | 45 | 134 | – | 65 | 77 | 73 | 104 | 108 | 134 |
| Ireland | IE | 950 | 192 | – | 964 | 95 | 94 | N/A | 133 | 192 |
| Israel* | IL | N/A | N/A | N/A | N/A | N/A | N/A | 70 | N/A | N/A |
| Italy | IT | 8 900 | 144 | – | 12 066 | N/A | N/A | N/A | 133 | 144 |
| Kazakhstan | KZ | 1 059 | 58 | 2 022 | 3 573 | 11 | 15 | 29 | 42 | 58 |
| Kosovo* | XK | N/A | N/A | N/A | N/A | N/A | N/A | 0 | N/A | N/A |
| Kyrgyzstan | KGZ | 0 | 0 | 631 | 1 114 | N/A | N/A | N/A | N/A | 0 |
| Latvia | LV | 127 | 65 | 217 | 382 | 26 | 29 | 35 | 44 | 65 |
| Lebanon* | LB | N/A | N/A | N/A | N/A | N/A | N/A | N/A | N/A | N/A |
| Libya* | LY | N/A | N/A | N/A | N/A | N/A | N/A | N/A | N/A | N/A |
| Lithuania | LT | 113 | 40 | 314 | 555 | 8 | 9 | 21 | 28 | 40 |
| Luxembourg | LU | 54 | 93 | 64 | 113 | 61 | 60 | 109 | 84 | 93 |
| FYR Macedonia* | MK | N/A | N/A | N/A | N/A | 0 | 0 | 0 | N/A | N/A |
| Malta | MT | 9 | 22 | 46 | 81 | 0 | 0 | 0 | 0 | 22 |
| Moldova | MD | 7 | 2 | 387 | 683 | N/A | 0 | N/A | N/A | 2 |
| Montenegro | ME | 32 | 50 | 71 | 125 | 0 | 0 | 26 | 28 | 50 |
| Morocco | MA | 15 | 0 | 3 707 | 6 549 | 0 | N/A | N/A | N/A | 0 |
| Netherlands | NL | 4 000 | 235 | – | – | 156 | N/A | 202 | 212 | 235 |
| Norway | NO | 1 677 | 319 | – | – | 249 | 293 | 278 | 280 | 319 |
| Poland | PL | 3 512 | 91 | 4 243 | 7 496 | 44 | 50 | 57 | 84 | 91 |
| Portugal | PT | 885 | 82 | 1 193 | 2 108 | 49 | 51 | 63 | 69 | 82 |
| Romania | RO | 227 | 11 | 2 379 | 4 203 | 4 | 6 | 4 | 6 | 11 |
| Russian Federation | RU | 7 219 | 51 | 15 679 | 27 700 | 27 | 41 | 45 | 58 | 51 |
| San Marino | SM | 0 | 0 | 4 | 6 | 0 | 0 | 0 | 0 | 0 |
| Serbia | RS | 335 | 47 | 787 | 1 390 | 16 | 21 | 33 | 42 | 47 |
| Slovakia | SK | 271 | 50 | 600 | 1 060 | 18 | 27 | 23 | 41 | 50 |
| Slovenia | SI | 207 | 105 | 218 | 385 | 55 | 83 | 75 | 108 | 105 |
| Spain | ES | 2 938 | 60 | 5 349 | 9 450 | 40 | 47 | 52 | 55 | 60 |
| Sweden | SE | 2 019 | 204 | – | – | 177 | 177 | 184 | 191 | 204 |
| Switzerland | CH | 2 278 | 279 | – | – | 193 | 187 | 212 | 247 | 279 |
| Syria* | SY | N/A | N/A | N/A | N/A | N/A | N/A | N/A | N/A | N/A |
| Tunisia | TN | 65 | 6 | 1 226 | 2 167 | 3 | 3 | 4 | 5 | 6 |
| Turkey | TR | 1 215 | 15 | 8 842 | 15 620 | N/A | N/A | 16 | 28 | 15 |
| Ukraine | UA | 731 | 17 | 4 869 | 8 603 | 14 | 15 | 14 | 14 | 17 |
| United Kingdom | GB | 6 744 | 105 | 7 097 | 12 537 | 80 | 85 | 102 | 100 | 105 |
| Total ESC member countries | 113 098 | 110 | 62 | 67 | 105 | 113 | 127 | |||
These 9 countries did not submit any data on AF ablations for the EHRA White Book 2017.
In Figures 85 and 86 the ESC member countries performing AF ablations are grouped in quartiles according to their activity. Most countries in the top quartile were from the Western and Northern European region, and the countries with low activity (1st and 2nd quartiles) were mainly from the non-European ESC region. In the Eastern region, the AF ablation activity was extremely heterogeneous varying from 271 in Czech Republic to 6 ablations per million population in Romania. The growth in AF ablation rate per million population from 2015 to 2016 was highest in Armenia (200%), Egypt (141) and Cyprus (117%). In Turkey, the rate of AF ablation decreased by 46% and in the Russian Federation by 13% (Table 19 and Figure 87).
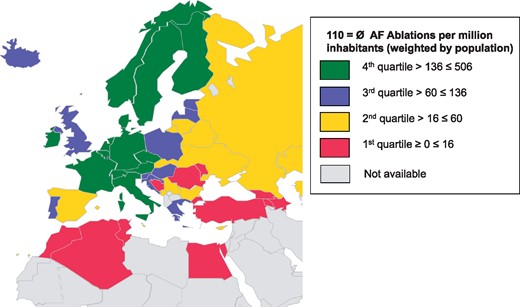
Atrial fibrillation ablations in the ESC member countries in 2016.
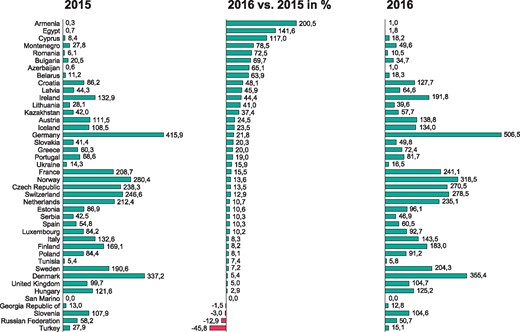
Change in the number of AF ablations per million inhabitants from 2015 to 2016.
Change in the number of atrial fibrillatio (AF) ablations from 2015 to 2016
| AF Ablation procedures 2015 | AF Ablation procedures 2016 | |||||
|---|---|---|---|---|---|---|
| Country | ISO code | Absolute number | Per million inhabitants | Absolute number | Per million inhabitants | Change % |
| Albania* | AL | N/A | N/A | N/A | N/A | N/A |
| Algeria | DZ | 0 | 0 | 10 | 0 | N/A |
| Armenia | AM | 1 | 0 | 3 | 1 | 200.5% |
| Austria | AT | 966 | 111 | 1 209 | 139 | 24.5% |
| Azerbaijan | AZ | 6 | 1 | 10 | 1 | 65.1% |
| Belarus | BY | 106 | 11 | 175 | 18 | 63.9% |
| Belgium* | BE | 3 273 | 289 | N/A | N/A | N/A |
| Bosnia & Herzegovina* | BA | 0 | 0 | N/A | N/A | N/A |
| Bulgaria | BG | 147 | 20 | 248 | 35 | 69.7% |
| Croatia | HR | 385 | 86 | 551 | 128 | 48.1% |
| Cyprus | CY | 10 | 8 | 22 | 18 | 117.0% |
| Czech Republic | CZ | 2 537 | 238 | 2 884 | 271 | 13.5% |
| Denmark | DK | 1 882 | 337 | 1 988 | 355 | 5.4% |
| Egypt | EG | 65 | 1 | 168 | 2 | 141.6% |
| Estonia | EE | 110 | 87 | 121 | 96 | 10.6% |
| Finland | FI | 926 | 169 | 1 006 | 183 | 8.2% |
| France | FR | 13 890 | 209 | 16 116 | 241 | 15.5% |
| Georgia | GE | 64 | 13 | 63 | 13 | −1.5% |
| Germany | DE | 33 628 | 416 | 40 884 | 506 | 21.8% |
| Greece | GR | 650 | 60 | 780 | 72 | 20.0% |
| Hungary | HU | 1 204 | 122 | 1 236 | 125 | 2.9% |
| Iceland | IS | 36 | 108 | 45 | 134 | 23.5% |
| Ireland | IE | 650 | 133 | 950 | 192 | 44.4% |
| Israel* | IL | N/A | N/A | N/A | N/A | N/A |
| Italy | IT | 8 200 | 133 | 8 900 | 144 | 8.3% |
| Kazakhstan | KZ | 762 | 42 | 1 059 | 58 | 37.4% |
| Kosovo* | XK | N/A | N/A | N/A | N/A | N/A |
| Kyrgyzstan | KGZ | N/A | N/A | 0 | 0 | N/A |
| Latvia | LV | 88 | 44 | 127 | 65 | 45.9% |
| Lebanon* | LB | N/A | N/A | N/A | N/A | N/A |
| Libya* | LY | N/A | N/A | N/A | N/A | N/A |
| Lithuania | LT | 81 | 28 | 113 | 40 | 41.0% |
| Luxembourg | LU | 48 | 84 | 54 | 93 | 10.2% |
| FYR Macedonia* | MK | N/A | N/A | N/A | N/A | N/A |
| Malta | MT | 0 | 0 | 9 | 22 | N/A |
| Moldova | MD | N/A | N/A | 7 | 2 | N/A |
| Montenegro | ME | 18 | 28 | 32 | 50 | 78.5% |
| Morocco* | MA | N/A | N/A | 15 | 0 | N/A |
| Netherlands | NL | 3 600 | 212 | 4 000 | 235 | 10.7% |
| Norway | NO | 1 460 | 280 | 1 677 | 319 | 13.6% |
| Poland | PL | 3 253 | 84 | 3 512 | 91 | 8.1% |
| Portugal | PT | 743 | 69 | 885 | 82 | 19.0% |
| Romania | RO | 132 | 6 | 227 | 11 | 72.5% |
| Russian Federation | RU | 8 289 | 58 | 7 219 | 51 | −12.9% |
| San Marino | SM | 0 | 0 | 0 | 0 | 0.0% |
| Serbia | RS | 305 | 42 | 335 | 47 | 10.3% |
| Slovakia | SK | 224 | 41 | 271 | 50 | 20.3% |
| Slovenia | SI | 214 | 108 | 207 | 105 | −3.0% |
| Spain | ES | 2 640 | 55 | 2 938 | 60 | 10.3% |
| Sweden | SE | 1 868 | 191 | 2 019 | 204 | 7.2% |
| Switzerland | CH | 2 003 | 247 | 2 278 | 279 | 12.9% |
| Syria* | SY | N/A | N/A | N/A | N/A | N/A |
| Tunisia | TN | 60 | 5 | 65 | 6 | 7.4% |
| Turkey | TR | 2 200 | 28 | 1 215 | 15 | −45.8% |
| Ukraine | UA | 634 | 14 | 731 | 17 | 15.9% |
| United Kingdom | GB | 6 390 | 100 | 6 744 | 105 | 5.0% |
| Total ESC member countries | 103 748 | 105 | 113 108 | 110 | 5.0% | |
These 9 countries did not submit any data on AF ablations for the EHRA White Book 2017.
Trends in atrial fibrillation ablation activity over the past 10 years
The trend in the number of catheter ablations per million inhabitants from 2007 to 2016 in the European and non-European ESC member countries and comparison to the total ESC area and the 28 member countries of the European Union (EU28) are shown in Figure 88. Over the past ten years the rate of AF ablation increased by more than 200% in all ESC areas with the greatest increases in the non-European ESC member countries and in the Southern and Eastern European countries. In Belarus, Poland, Bulgaria and Serbia the increase in AF ablation rate exceeded 1200% (Figure 87).
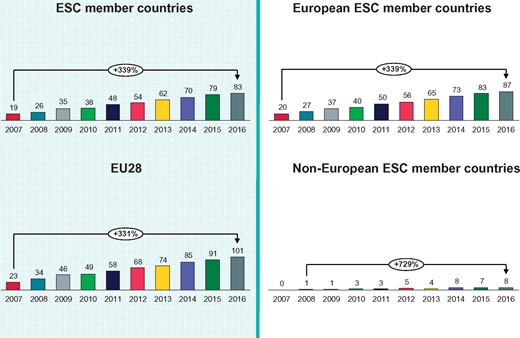
Atrial fibrillation ablations per million inhabitants 2007-2016 in the European and non-European ESC member countries and comparison to the total ESC area and the 28 member countries of the European Union (EU28).
Detailed information on AF ablation activities in the various ESC regions and a comparison to the corresponding numbers in the total ESC area and the EU28 countries are presented in Figures 88 and 89. The most active countries in the Northern, Western, Southern and Eastern European region, and among the non-European ESC member countries were Denmark (355 AF ablation per million population), Germany (506), Croatia (128), Czech Republic (271) and Kazakhstan (58), respectively (Figures 90-94). The changes in the AF ablation rates in the various ESC member countries are shown in Figure 95. The proportion of AF ablation to the total number of ablation varied between 1.5% in Azerbaijan to 50.7% in Germany and Norway. The mean ratio of AF ablations of total ablations was 39.6%, and the proportion of AF ablations compared to all ablations was 40% or more in 10 countries (Figure 96).
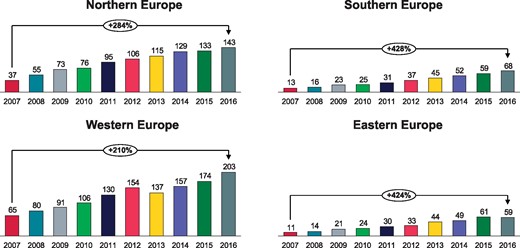
Atrial fibrillation ablations per million inhabitants 2007-2016 in the four European ESC regions.
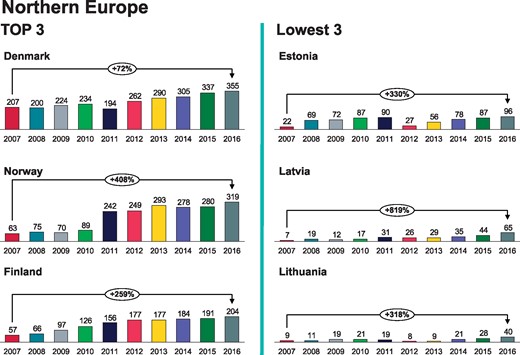
Atrial fibrillation ablations per million inhabitants 2007-2016 in Northern Europe.
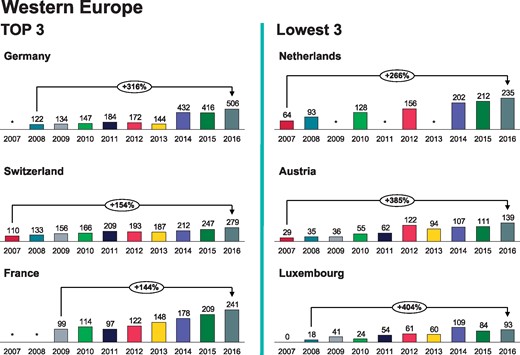
Atrial fibrillation ablations per million inhabitants 2007-2016 in Western Europe. *No data available.
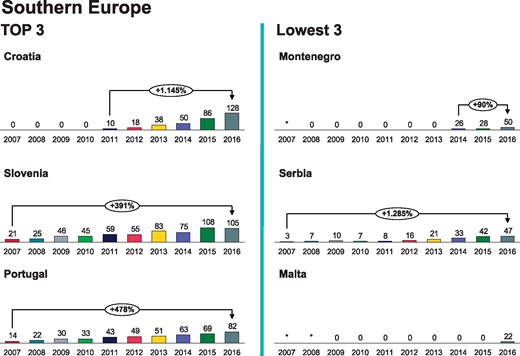
Atrial fibrillation ablations per million inhabitants 2007-2016 in Southern Europe. *No data available.
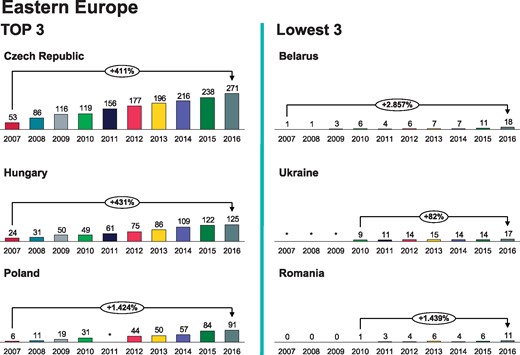
Atrial fibrillation ablations per million inhabitants 2007-2016 in Eastern Europe. *No data available.
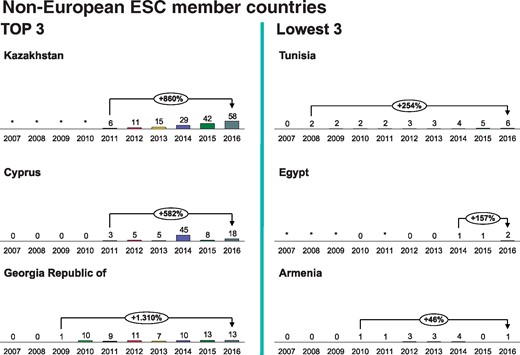
Atrial fibrillation ablations per million inhabitants 2007-2016 in the non-European ESC member countries. *No data available.
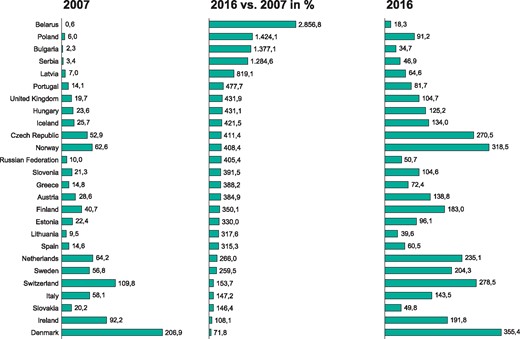
Change in the number of AF ablations per million inhabitants from 2007 to 2016.
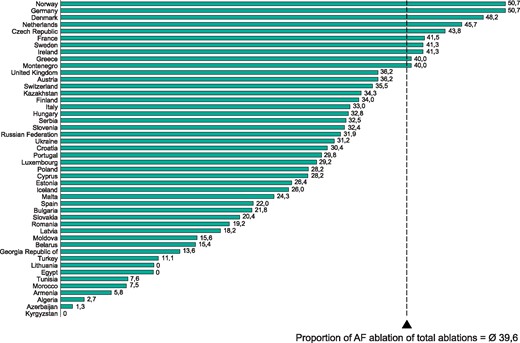
Proportion of AF ablations of total ablations in 2016.
Ventricular tachyarrhythmia ablation rates
Data on ventricular tachyarrhythmia ablations in patients with structural heart disease were collected for the third time in 2016. A total of 41 (73%) ESC member countries reported data on ventricular tachycardia (VT) or ventricular fibrillation (VF) ablations. In 2016 the number of centres performing more than 10 ventricular tachyarrhythmia ablations per million population in patients with structural heart disease was highest in Germany (2.30) and lowest in Algeria (0.02) (Figure 97).
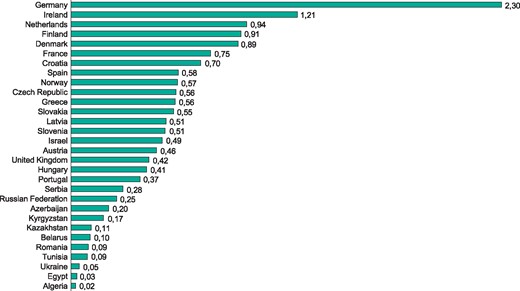
Number of centres which performed more than 10 VT or VF ablations per million inhabitants in patients with structural heart disease in 2016.
Most countries in the top quartile were from the Western Europe region, and the countries with the lowest activity were mainly from the non-European ESC region (Figure 98 and 99). The mean number of VT/VF ablations per million population in the ESC member countries was higher in 2016 (19) than in 2015 (16). It was markedly higher in Germany (118 per million population) than in any other ESC member country. Many countries did not report any data on VT/VF ablation (n = 15) and no VT/VF ablation were performed in five countries.
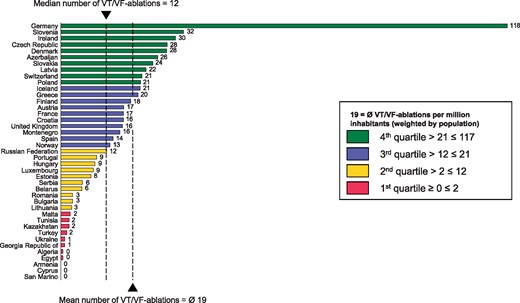
Ablations for VT or VF per million inhabitants in patients with structural heart disease in 2016. The mean number of VT/VF-ablations is weighted by population.
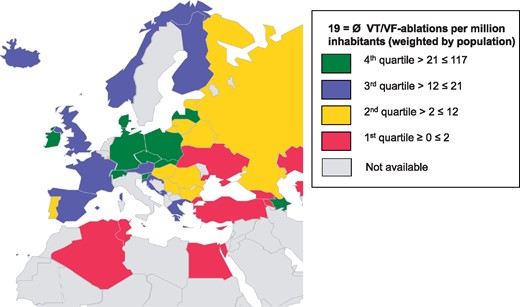
Ablations for VT or VF in patients with structural heart disease in 2016.
Percutaneous left atrial appendage closures
Percutaneous left atrial appendage (LAA) closure is an option of for preventing AF related thromboembolic complications among patients with high risk of bleeding and contraindications to oral anticoagulation therapy (15,16). In 2016 only 35 of the 56 ESC member countries (63%) submitted the requested data on LAA closures for the EHRA White Book. The mean number of centres performing LAA closures in the ESC area was 0.8 per million population (Figure 100). No LAA closures were performed in 12 countries. In the countries performing LAA closures the mean number of procedures was slightly higher in 2016 than in 2015 (12.1 vs. 8.9 per million population). Germany was by far the most active country (63.2 LAA closure per million inhabitant) followed by San Marino (60.1) and Finland (24.2) (Figure 101). Of note is that in Kazakhstan, where the CIED implantation and catheter ablations numbers were quite low 3.8 LAA occlusions were performed per million inhabitants.
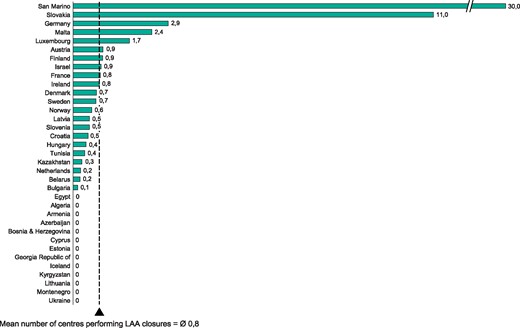
Number of centres performing LAA closures per million inhabitants in 2016. The mean number of the centres is weighted by population.
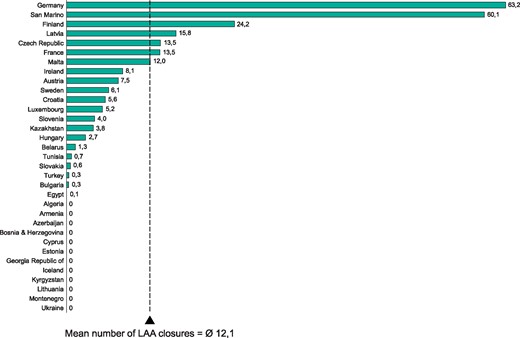
Percutaneous LAA closures per million inhabitants in 2016. The mean number of the centres is weighted by population.
Discussion
This year we celebrate the 10-year anniversary of the EHRA White Book project. For a decade, the White Book has been a key resource for health care professionals and other stakeholders with an interest in the advancement of cardiac arrhythmia therapies in the ESC area. The White Book has formed the backbone for the “ICD for life” and many other strategic initiatives and awareness activities of the EHRA (17,18).
This is the first time that 10-year trends in the rate of CIED implantations and catheter ablation procedures in Europe have been presented in detail. Overall, procedure rates are lower in the non-European and Eastern European ESC member countries than in the other ESC regions. On the other hand, it was encouraging that in many arrhythmia therapies the growth rate over the past ten years was highest in the non-European and Eastern European regions.
Geographical variations in the access to and use of arrhythmia therapies
The current analysis of the EHRA White Book data indicate that considerable variations in access to and use of invasive electrophysiological procedures continue to be the case within the ESC area. Despite several improvements over the past 10 years, there is still a clear need to increase the availability of procedures for complex arrhythmias in many ESC member countries. As in previous years, the mean CIED implantation rates were markedly lower in the Eastern European and non-European ESC member countries than in the other regions. Likewise, the catheter ablation activity was substantially higher in the Western and Northern European than in the non-European ESC member countries. The Eastern European ESC region was characterised by large variations in the procedure rates, with numbers spanning over all four quartiles of the activity distribution.
The rate of growth for PM implantations over the past decade was comparatively high in the Eastern and non-European regions. The growth in the number of ICD implantation was, along these lines, most impressive in the Eastern region. This trend is especially positive and implies that the EHRA initiatives like the “ICD for life” are potentially beneficial. The same applies to the CRT therapy where the implantation rate has also increased significantly in the Eastern region. For catheter ablation, the growth rate was quite similar across the ESC regions except for the Southern European region where the growth rate was lower than in the other areas. On the other hand, the growth in AF ablation rate was more than 400% in the Southern region - second only to the growth in the non-European ESC member countries.
Possible explanations for the disparities in arrhythmia care among the ESC member countries
As is shown in Figure 3 the healthcare expenditure currently amounts to 4.4 to 11.9% of GDP in the ESC member countries. Hence, it is not surprising that there continues to be a large gap between the EU28 countries and selected Eastern European and non-European ESC member countries with regards to CIED implantation and catheter ablation facilities and rates.
Almost through the whole decade of data collection for the White Book project, an important limitation for improvements in arrhythmia management across the ESC area has been a difficult economic situation. Following the financial collapse in the autumn of 2008 many countries had to make substantial cuts in their healthcare budget (19–21). At the same time, the number of elderly people requiring complex medical and different social services has grown rapidly. In this context, socioeconomic disparities pose a major threat to the required growth of healthcare systems, and may even limit the use of innovative technologies such as ICD therapy for primary prevention of sudden cardiac death and catheter ablation of AF and VT.
Data on health expenditures and CIED implantation rate per capita indicate that a low proportion of GDP spent on healthcare is associated with a lower use of device therapy and complex interventional electrophysiology procedures (Figure 102). However, in some Eastern European countries with relatively low GDP, device implantation and catheter ablation rates per million population exceed those of certain Western and Northern European countries. A good example of this is Czech Republic which was in the most active quartile for ICD and CRT therapy and AF ablations. Furthermore, despite the ongoing economic constraints across Europe the use of device and catheter ablation therapies has been growing in a number of countries with relatively low GDP. On the other hand, in many Western and Northern European countries with high GDP the use of device and ablation therapies has remained stable or in some cases even declined slightly. It is unclear whether this is a consequence of healthcare budget limitations or simply that supply is meeting the demand or a combination of both. Nevertheless, these data indicate that high GDP is not the only driver for early adaptation of novel healthcare innovations with relatively high initial cost. Other potential explanations for the observed disparity include lack of manpower, training opportunities, facilities and low referral rates. A personal co-payment for the procedures may additionally limit access to CIED and catheter ablation therapies in countries not providing full coverage for the whole population.
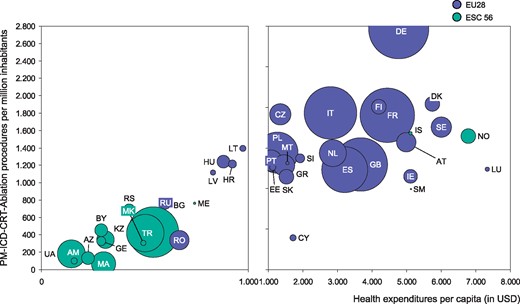
Healthcare spending per capita and interventional electrophysiology procedures (sum of PM-ICD-CRT-Ablation procedures per million inhabitants). The ISO codes of the countries are explained in Table 1.
Evolving areas in cardiac arrhythmia therapy
In the future, the key areas for growth in invasive arrhythmia care include ablation of ventricular arrhythmias in patients with structural heart disease and novel therapeutic modalities such as left atrial appendage closure devices, leadless pacemakers and subcutaneous implantable defibrillators. These innovative medical technologies have a high initial cost. Therefore, their efficacy and safety need to be proven before they can reach wide acceptance and clinical use. However, one of the main issues in analysing the current use of the evolving arrhythmia therapies was that many countries did not report data on these developing therapies.
Leadless pacing has recently been introduced in many ESC member countries. The most active countries in the ESC area with regards to leadless pacemaker implantations were France and the Netherlands, which were active also in the studies evaluating the safety and efficacy of this therapy (9,10). Although the overall implantation rates were rather low also in these early adopters, the use of leadless pacing is expected to gradually grow in the coming years, especially if the dual chamber option proves successful.
The results of numerous randomised, multicentre trials have established the role of traditional ICD therapy in both primary and secondary prevention of sudden cardiac death (22). Still, access to this potentially life-saving therapy differs widely among the ESC member countries, as documented in the White Book. Transvenous ICD leads have significant short- and long-term complications, offsetting some of the benefit of this therapy. This has led to the development of an entirely subcutaneous ICD (11). This was the second year that the White Book questionnaire asked about S-ICD implantation. The S-ICD implantation rate almost doubled from the previous year, suggesting increasing acceptance of this therapy.
Yet another important evolving area in arrhythmia management is the use of percutaneous LAA closure devices to prevent AF related thromboembolic complications (15,16). According a recent meta-analysis LAA occlusion is a viable alternative to anticoagulation with warfarin in patients at high risk of thromboembolic and bleeding events (15). The number of LAA closures was largest in Germany, but interestingly many of the countries in top quartile were from Eastern Europe, demonstrating that the ability to initiate new therapies is by no means limited to a selected few.
The role of catheter ablation in treatment of symptomatic AF is well established in Western and Northern Europe and in some countries in Southern and Eastern Europe, whereas in the non-European ESC member countries the access to AF ablation is limited. Catheter ablation of VT has been one of the key areas of growth in electrophysiology in recent years. The growing need for VT/VF ablations in patients with structural heart disease (23–25) was clearly reflected in the White Book data where the number of VT/VF ablation procedures per million inhabitants increased from 9.2 in 2014 to 19.0 in 2016.
The role of the European Heart Rhythm Association
It is likely that disparity in the implementation of arrhythmia treatment and practice guidelines will be difficult to abolish, unless there is an additional investment in the infrastructure of arrhythmia care. This includes electrophysiology laboratories, specialised equipment, and not least improved training opportunities. Likewise, standardisation of training requirements and implementation of current up to date clinical practice guidelines are important steps. European Heart Rhythm Association has been very active in promoting unified standards for training of cardiac rhythm management specialists and in trying to assure high quality in arrhythmia care in a broad sense. The White Book project has revealed important disparities in this field also and provided a solid base to improve and align arrhythmia management strategies across ESC member countries. The ability to evaluate its own performance in a European context provides each country with robust means to demonstrate shortfalls in resource allocation, reimbursement and training requirements to the national or local authorities. In addition, it provides a sound basis for preparation of recommendations to improve decision and policy making concerning the cardiac arrhythmia care field at a national and cross-national levels.
The EHRA certification program provides an excellent platform to improve and standardise the training and the level of arrhythmia care in the ESC area. The introduction of the EHRA recognition program for teaching centres will provide further support to harmonise training. EHRA fellowship grants have already allowed many junior physicians from countries with relatively low procedure rates to receive training in high volume centres across the ESC area. The number of applications for the EHRA Fellowship grants have been increasing gradually and the certification program is now also available for allied professionals. Last year the EHRA Training Fellowship committee awarded 10 grants for young physicians mainly from emerging economies. In addition, a specific proctor programme was recently launched to provide further education in the field of cardiac arrhythmia management.
In summary, the EHRA White Book data indicate that there are still significant differences in training and certification requirements between the ESC member countries. Accordingly, there is a need to involve more physicians and allied professionals in the EHRA certification system to assure uniform and high level theoretical and practical training for all healthcare professionals, regardless of their country of origin of practice.
Limitations
There are several limitations in the methodology of the EHRA White Book data collection. Data collection is exclusively based on voluntary activity of the National Cardiac Societies or Arrhythmia Working Groups. This year 53 out of the 56 ESC nations responded to the White Book questionnaire. The data covered about 95% of the population in the ESC area. Nevertheless, few countries have never reported data for the White Book and some countries reported incomplete data. In particular, some countries did not provide data on new therapies like leadless pacing, S-ICD and VT/VF ablations. This may in part be due to incomplete collection of data on these procedures, which are relatively new and performed only in a few centres.
With regards to the current analysis and interpretation of the ten-year data it was a major drawback that Belgium did not submit any data on the procedure numbers this year. It also needs to be noted that there were large variations in national data sources. About 50% of the data came from national registries and the other half were based on surveys conducted by the National Working Groups and some even on estimates. This is relevant since the coverage of the registries in some of the ESC member countries is far from complete and many procedures are not included in the registry data. On the other hand, surveys and other estimates conducted by the National Working Groups may overestimate the procedure numbers.
Future directions
There is no doubt that the EHRA White Book and the subsequent comparative analysis of the data published in the EP Europace journal is of substantial value. However, the data collection could be improved for example with an internet-based electronic database and/or by adapting national databases towards uniform standards. Such a database would not only allow easy comparisons between and within the ESC member countries but might also provide a unique platform for multicentre registry based clinical trials in arrhythmia therapy (26). The ESC recently launched the Atlas of Cardiology project (27) with similar goals but far more widespread aims than the White Book. The Atlas will provide descriptive and quantitative information on economy, demographics, health system and health policies alongside data concerning health care resources and a wide range of cardiology interventions in the ESC member countries.
Conclusions
During the past decade, the EHRA White Book has developed into a substantial asset not only for the cardiac electrophysiology community but also for healthcare administrators, politicians and other stakeholders in the ESC area. The availability of up-to-date key information is critical to those facing the constant challenge of balancing healthcare budgets and allocating resources that may be limited. The statistics presented herein show that, despite significant improvements in many areas of arrhythmia care, there still is considerable heterogeneity in the availability of invasive arrhythmia therapies across the ESC area. Reducing these disparities continues to be one of the main goals of the EHRA.
Acknowledgements
The EHRA White Book 2017 and this analysis were possible thanks to the continuing efforts of several key contributors including chairmen and co-chairs of National Cardiac Societies and the Working Groups for Arrhythmias in the 56 ESC member countries. We are grateful for their invaluable contribution. In addition, we would like to thank Lauren Tapp and other members of the EHRA staff at the European Heart House as well as BIOTRONIK SE & Co. KG for continuous support to the project. In particular, we would like to acknowledge Robert Wuestenberg and Anja Thuemen from BIOTRONIK for their dedication and unwavering enthusiasm for the EHRA White Book project. The EHRA White Book 2017 is supported by BIOTRONIK SE & Co. KG in the form of an educational grant. The content has not been influenced in any way by its sponsor.
