


Abstract
Purpose of the Study: This study examined whether participating in productive activities was associated with better health outcomes among older adults in urban China, including analysis of potential gender differences. Design and Methods: Using a sample of 10,016 urban Chinese adults aged 60 years or older from the 2006 Sample Survey of the Aged Population in Urban/Rural China, we regressed measures of self-rated health, functional health, and depression on productive activities (paid employment, helping with family, and volunteering), controlling for sociodemographic variables. Results: Those who provided assistance to family members or volunteered had significantly lower levels of depression and better functional and self-rated health than their counterparts. Older adults with paid job, providing family assistance, or volunteering reported significantly lower levels of depression and better functional and self-rated health than those without those activities. However, only older men with paid employment reported significantly less depression, and the effect of family assistance on functional health also differed by gender. Implications: As research increasingly demonstrates the role of productive activities in maintaining health among older adults, our findings can help practitioners or policy makers strategically select or develop health programs to promote productive activities among older adults in urban China.
China has a rapidly aging population that comprises an increasing proportion of the overall population. By 2020, the number of people 60 years old and older is projected to grow to 243.9 million or 17% of the total population (United Nations, 2005). However, China lacks a mature social infrastructure, such as a social security system and health care program, to meet the demands of its aging residents. Health and health care costs have become a major concern among older adults in China (Sun, 2004). Encouraging participation in productive activities has become a viable way to help older Chinese adults remain healthy and active. In recent years, many national programs such as Silver Aging Action have been established to engage older adults in productive activities in urban cities. Nonetheless, research on productive aging in China is still in the early phase of development and has focused mainly on the prevalence of productive activities and predictors of participation in these activities by older adults (Lum, 2012). Moreover, most previous studies on productive aging used regional samples (e.g., from Hong Kong), making it difficult to generalize the results to a broader population in mainland China. To the best of our knowledge, no study has been conducted to examine the relationship between productive aging activities and health among older adults in China.
A productive aging activity refers to any activity performed by an older individual that produces socially valued goods or services, whether paid for or not, or that develops the capacity to produce such goods or services (Bass, Caro, & Chen, 1993). Paid employment, providing assistance to families, and volunteering are three major categories of such productive activities (Morrow-Howell, Hinterlong, & Sherraden, 2001). Research has generally shown that engagement in these productive activities is associated with favorable health outcomes such as lower levels of morbidity (Jung, Gruenewald, Seeman, & Sarkisian, 2010; Menec, 2003), mortality (Glass, de Leon, Marottoli, & Berkman, 1999; Menec, 2003), and depression in later life (Chiao, Weng, & Botticello, 2011; Choi & Bohman, 2007; Hong & Morrow-Howell, 2010). However, previous research on productive aging has mainly focused on volunteering and its effect on health, resulting in an incomplete understanding of the effects of other productive activities. Moreover, these studies were conducted mostly in Western countries with well-developed income support programs and health care systems, thus providing limited information on cultural variations in the relationship between productive activities and health in less-developed countries. This study intended to address these gaps by investigating the effects of different productive activities (paid employment, assistance with family, and volunteering) on health among older adults in China, a developing country with a vastly different cultural and social context.
Paid Employment and Health
China has a mandatory retirement age of 60 for men and 55 for women (blue-collar jobs have an even younger retirement cutoff). Such a policy has curtailed the careers of many young-old adults who are still in their productive years. It has also unintentionally legitimized the practice of discrimination against women in the labor market (Du & Dong, 2009). However, continuing to work and maintaining financial security after retirement age has become a necessity for many, especially older adults with lower education levels or without wealth or economic assets (Ling & Chi, 2008). Many adults seek reemployment after they retire; however, most often jobs available to them in private market are contract jobs with little or no benefits. Whether continuing to work during old age renders any health benefit is unclear. One study examined cross-sectional baseline data from the Korean Longitudinal Study of Aging and found that employment status was not associated with mental health among older Koreans (Jang et al., 2009), whereas another study using cross-sectional national data from the Sample Survey of Older Adults in Urban and Rural China found that continuing to work in old age was associated with better self-reported health among older Chinese adults (Ling & Chi, 2008). Attention needs to be paid to those in poor health, who tend to exit the labor market early (Bazzoli, 1985; Shultz, Morton, & Weckerle, 1998). Research has shown that those with a poor work environment and health complaints before retirement experienced improved health after retirement, regardless of gender and occupational grades, and such improvement lasted for 8–10 years (Westerlund et al., 2009). Previous studies also noted unemployed older men tend to report worse mental health than unemployed older women (Jang et al., 2009).
Assisting Family and Health
China has been characterized as a family-oriented, collectivist society in which reciprocity among family members and across generations is expected and often practiced (Hwang, 1987). Cultural and conventional expectations of caring for grandchildren and doing housework have tended to fall upon women more than men (Chen & Liu, 2012). Older adults provide a wide range of assistance to their adult children with tasks such as house cleaning, cooking, and raising grandchildren (Li, Chi, Krochalk, & Xu, 2011). Providing assistance to family members can differ widely in terms of level of involvement and intensity. We limited our review of the literature to homemaking and caring for grandchildren, considering their relevance to our study variable. In a cross-sectional study, caring for grandchildren was negatively associated with self-rated health among those widowed longer compared with those married or widowed more recently, suggesting an exacerbated effect of caregiving on a disadvantaged senior group (Li et al., 2011). In the same study, helping with household chores was associated with a lower likelihood of reporting good self-reported health. Chen and Liu (2012) examined six waves of data from the China Health and Nutrition Survey and found that providing high-intensity care to younger grandchildren accelerated health declines among coresiding grandparents, whereas a less intense level of care had a protective effect on health. These results suggested that providing assistance to family members is associated with health condition, but how family assistance is related to depression or functional limitation needs further exploration.
Volunteering and Health
Volunteering by older adults has been heavily promoted via several national policy guidelines since 2000 (e.g., Sun, 2013). National programs such as Silver Aging Action have mobilized large number of seniors to volunteer (Mui, 2010). To the best of our knowledge, no study has been conducted to examine the effect of volunteering on health among Chinese individuals. Studies conducted in Western societies have produced less equivocal evidence that volunteering in later life is related to improved well-being (Moen, Dempster-McClain, & Williams, 1992; Musick, Herzog, & House, 1999; Oman, Thoresen, & McMahon, 1999; Van Willigen, 2000). One study used three waves of data from the Americans’ Changing Lives Study and found that older adults who volunteered and engaged in more hours of volunteering reported better self-rated health, less depression, and improved functional health independent of gender and race (Morrow-Howell, Hinterlong, Rozario, & Tang, 2003). Volunteering was associated with lower cumulative odds of frailty in a study using two waves of data from the MacArthur Study of Successful Aging (Jung et al., 2010); it was also associated with fewer depressive symptoms and functional limitations in another study in which older adults participated in the Experience Corps, a high-commitment U.S. volunteer program, for 2 years (Hong & Morrow-Howell, 2010). In general, volunteering has been shown to have mental and physical benefits for both older men and women.
Given China’s vastly different social context—in which national retirement policies create discrimination against older women in the labor market, caregiving roles are traditionally held by women, and the volunteer sector is mainly run using a top-down approach—it is important to study how relationships between productive activities and health vary among older men and women in urban areas. Using data from a nationally representative sample, we examined whether involvement in productive activities is correlated with health outcomes and whether such relationships differ by gender. We asked the following specific questions: To what extent do older Chinese adults participate in productive activities, such as paid work, caring for family members, or volunteering? Does participation in productive activities vary according to gender? Is participation in productive activities related to better health outcomes? How does this relationship vary by gender? How does the effect of each type of activity vary?
Methods
Data Source and Participants
The data used in the current study came from the Sample Survey on Aged Population in Urban/Rural China conducted in 2006 by the China Research Center on Aging (CRCA, 2007). To ensure all geographical regions (north, northeast, east, south central, southwest, and northwest) were appropriately represented, the CRCA selected 20 divisions from all provincial-level administrative divisions throughout China. Provincial-level administrative divisions included provinces, autonomous regions (e.g., Inner Mongolia and Tibet), metropolises (e.g., Beijing and Shanghai), and special administrative regions (e.g., Hong Kong and Macau). The number of sample divisions allocated to each region was approximately proportional to its population (CRCA, 2007).
The survey was based on a stratified, multistage quota sample design. First, 20 divisions were selected. Second, within each division, four cities (urban areas) and four counties (rural areas) were selected using the same measure of size (population aged 50 years and older). Third, 16 blocks and 16 rural townships were selected within each division. All urban residential communities within the 16 blocks and all the villages in the 16 townships were listed together. Fourth, a quota sample of 50 urban residential committees was selected with equal probability within each province. Fifth, 50 urban residential communities and 50 rural villages were selected at random from the list. In the case of households with more than one person aged 60 years or older, one individual was selected at random. This resulted in a sample of approximately 500 urban and 500 rural older adults in each province. The sampling method and data collection have been described in more detail elsewhere (e.g., He, Sengupta, Zhang, & Guo, 2007). Potential participants were contacted and asked for informed consent. Unavailable subjects (declined to participate, illness, dementia, absence from home, or relocation) were replaced by older adults in the households next to those originally chosen based on the Kish table (CRCA, 2007).
Provincial or county committees on aging recruited interviewers who conducted interviews using a structured questionnaire after receiving intensive standardized training from CRCA officials. A proxy (usually a family member) was used for individuals who had difficulty answering interview questions. To ensure the quality of interviews, CRCA researchers and personnel from the Bureau of Statistics and the Bureau of Civil Affairs supervised the interview process. Upon completion, questionnaires were examined on-site by interviewers and off-site by their supervisors to ensure completion of the questionnaires to minimize missing data. All valid questionnaires were returned to the CRCA for further review and data entry (CRCA, 2007). More details regarding the procedure can be found elsewhere (CRCA, 2007).
The final sample included 19,947 individuals, with a response rate of 97.1% (CRCA, 2007). Given our focus on productive activity, which is a concept less recognized and less common among rural older adults, particularly in terms of paid employment and volunteering, the present study focused on urban participants only. For this analysis, 10,016 individuals aged 60 years or older were included.
Measures
Health Outcomes.
We considered multiple aspects of health to gain a more comprehensive understanding of the effects of productive aging on health. Both physical health and mental health were included. Self-rated health was measured using a 5-point Likert scale ranging from 1 = very bad to 5 = very good. Depression was measured using a short form of the Geriatric Depression Scale (GDS), which consisted of 15 items. The GDS-15 was used to determine the degree to which participants experienced depressive symptoms during the previous week. This scale has been extensively used with Chinese populations in mainland China, Hong Kong, and the United States and has been confirmed as cross-culturally reliable and valid (Boey, 2000). Of the 15 items, 10 indicated the presence of depression when answered positively (e.g., dropped many activities and hobbies, felt life was empty, got bored, expected something bad to happen, or experienced memory decline), whereas the remaining 5 items indicated depression when answered negatively (i.e., was satisfied with life, had good mood, felt happy, felt full of energy, or felt wonderful to live). Respondents answered whether they experienced each symptom during the past week (0 = no and 1 = yes). After reverse coding the 5 items that indicated depression when answered negatively, a sum score was calculated, with higher scores indicating a higher level of depression. The reliability coefficient for the scale was 0.78.
Functional health was measured using activities of daily living (ADLs) and instrumental activities of daily living (IADLs). ADLs refer to the ability to perform basic activities such as eating, dressing, using the restroom, getting in and out of bed, mobility, locomotion at home, and bathing. Similarly, IADLs include meal preparation, laundry, sweeping, carrying 10-kg objects, and walking 1.5–2 km. ADL and IADL scores were the sum of six ADL and five IADL items. All ADL and IADL items were rated on a 3-point Likert scale: 1 = not difficult at all, 2 = a little bit difficult, and 3 = unable to perform the task. The internal consistencies of the ADL and IADL measures were .87 and .88, respectively. Sum scores for functional health (both ADLs and IADLs) were calculated, with a range of 11–33. Higher cumulative scores indicated more limited functional ability.
Productive Activities.
Morrow-Howell and colleagues’ (2001) notion of productive aging was used as our framework for understanding productive activities in old age. This framework is a useful umbrella under which to consider the wide range of involvement of older adults in productive activities and the relationship between such productive activities and health.
Paid work was defined as maintaining a paid job after age 60, including both full-time and part-time work. This dichotomous variable was measured by asking the respondents, “Do you have a paid job?” at the time of the survey. Providing assistance to family was measured by asking the participants, “Have you helped your family with the following activities: looking after the house, helping with chores, and caring for grandchildren?” This item was dichotomized as either helping with any of the three activities or not. Volunteering was measured by asking the respondents, “Have you participated in the following activities: neighborhood watch, voluntary labor, mutual aid group, mentoring youth, and other volunteer activities?” This item was dichotomized as either participating in any type of volunteer work or not.
Control Variables.
Sociodemographic and health variables including age, gender, education, marital status, self-rated financial condition, and chronic conditions were included as control variables in this study based on a review of health outcomes literature among Chinese populations (Liu & Zhang, 2004). Age was measured as an interval-level variable and entered as a continuous variable in the multivariate models. It was also recoded based on 5-year age groups (1 = 60–64, 2 = 65–69, 3 = 70–74, 4 = 75–79, and 5 = 80+) and used in the descriptive analyses. Gender was a dichotomous variable (0 = male and 1 = female). Education was measured with four categories: 1 = no formal education, 2 = primary school, 3 = high school, and 4 = college and above. Marital status was dichotomized as married or not married. Self-rated financial condition was measured using a 5-point Likert scale: 1 = having a surplus, 2 = just enough, 3 = so-so, 4 = difficult, and 5 = very difficult. Chronic illness was measured by asking older adults whether they suffered from any chronic disease at the time of the survey (0 = no and 1 = yes).
Data Analysis
The analysis included examining the rates of participation in productive activities among men and women overall, as well as by age, education, marital status, financial condition, and health status. Next, the relationships between participation and self-rated health, depression, and functional health were modeled using linear regression. General regressions were first conducted with interaction terms between gender and the three productive activities. Then the regression models were run separately for men and women. The regressions were first adjusted for control variables of age, education, marital status, financial condition, and health conditions in Model 1; then each activity was added in Model 2. All analyses were performed using SPSS 15.0.
Results
Table 1 displays the demographic characteristics of urban older adults in this study. The average age of respondents was 71 years (SD = 6.79) and approximately half were women (50.6%). Many participants reported receiving a high school education or higher (45.3%) and approximately two thirds were married (67.9%). They reported an average score of 3.13 (SD = 0.80) regarding financial strain on a 5-point Likert scale. A majority (81.2%) reported having at least one chronic health condition at the time of the survey.
Characteristics of the Sample
| Variables | n | % | M (SD) | Range |
|---|---|---|---|---|
| Age | 10,016 | 71.00 (6.79) | 60–103 | |
| 60–64 | 1,781 | 17.8 | ||
| 65–69 | 2,753 | 27.5 | ||
| 70–74 | 2,636 | 26.3 | ||
| 75–79 | 1,674 | 16.7 | ||
| 80+ | 1,172 | 11.7 | ||
| Gender | 10,016 | |||
| Male | 4,951 | 49.4 | ||
| Female | 5,065 | 50.6 | ||
| Education | 10,009 | |||
| No schooling | 2,152 | 21.5 | ||
| Primary school | 3,330 | 33.2 | ||
| High school | 3,609 | 36.1 | ||
| College and above | 918 | 9.2 | ||
| Married | 6,791 | 67.9 | ||
| Financial status | 10,000 | 3.13 (0.80) | 1–5 | |
| Chronic illness | 8,111 | 81.2 | ||
| Paid employment | 520 | 5.2 | ||
| Assist family | 6,451 | 64.6 | ||
| Volunteer | 4,595 | 45.9 | ||
| Depression | 9,961 | 4.79 (3.22) | 0–15 | |
| Functional health | 9,987 | 13.37 (4.13) | 11–33 | |
| Self-rated health | 10,006 | 3.05 (0.84) | 1–5 |
Average self-rated health was 3.05 (SD = 0.84) on a 5-point Likert scale. The mean level of depression was 4.79 (SD = 3.22) on a scale that ranged from 0 to 15. Because a score of 5–8 indicates mild depression, this study showed a relatively mild level of depression among older urban Chinese adults. These participants also had few functional limitations, with a mean score of 13.37 (SD = 4.13). Regarding participation in productive activities, only 5.2% of older adults in our sample had a paid job at the time of the survey. Most of them (64.6%) helped family members in one way or another. Nearly half of the respondents (45.9%) participated in some type of volunteer activity. The statistics presented in Table 1 are consistent with other national surveys and census data (CRCA, 2007).
Table 2 shows levels of participation in each productive activity for both men and women by age, education, marital status, financial strain, and chronic illness. There were significant differences in participation in paid work between men and women (χ2 = 106.81; p < .001), with 7.7% of men and 2.7% of women reporting paid employment. There were also significant gender differences in providing help to family members (χ2 = 8.08; p = .004), with women (65.9%) more likely to provide assistance to family than men (63.3%). However, there was no significant difference between men and women in terms of volunteering in general. The only significant difference between sexes was found in the category of mentoring youth (χ2 = 13.85; p < .001).
Participation in Productive Social Activities Among Men and Women Aged 60 or Older
| Variables | Men (n = 4,591), % | Women (n = 5,065), % | ||||
|---|---|---|---|---|---|---|
| Paid employment | Assist family | Volunteer | Paid employment | Assist family | Volunteer | |
| Age | ||||||
| 60–64 | 17.1 | 74.6 | 49.5 | 5.6 | 78.2 | 51.8 |
| 65–69 | 9.6 | 71.5 | 50.8 | 3.4 | 71.1 | 50.7 |
| 70–74 | 5.6 | 61.4 | 48.1 | 2.1 | 63.3 | 48.8 |
| 75–79 | 2.8 | 55.4 | 42.6 | 1.3 | 58.8 | 40.4 |
| 80+ | 1.7 | 42.8 | 33.4 | 0.0 | 50.6 | 22.6 |
| Education | ||||||
| No schooling | 4.7 | 60.7 | 34.4 | 2.3 | 62.8 | 35.2 |
| Primary school | 6.4 | 63.3 | 44.9 | 2.6 | 68.4 | 48.6 |
| High school | 7.8 | 65.2 | 49.7 | 3.1 | 68.4 | 53.1 |
| College and above | 12.5 | 58.9 | 47.3 | 4.6 | 56.4 | 50.2 |
| Marital status | ||||||
| Married | 8.4 | 65.3 | 47.4 | 3.2 | 66.8 | 48.8 |
| Not married | 4.3 | 52.3 | 41.8 | 2.3 | 65.0 | 41.5 |
| Financial status | ||||||
| Excellent | 14.0 | 67.4 | 46.5 | 3.4 | 72.2 | 47.4 |
| Good | 9.8 | 59.6 | 53.4 | 2.4 | 62.0 | 51.5 |
| Fair | 7.4 | 63.9 | 46.2 | 2.4 | 66.6 | 46.1 |
| Poor | 6.8 | 65.3 | 43.6 | 3.6 | 67.8 | 43.5 |
| Bad | 3.7 | 59.6 | 35.1 | 2.7 | 60.5 | 35.7 |
| Chronic illness | ||||||
| Yes | 7.1 | 62.3 | 45.4 | 2.4 | 64.8 | 44.4 |
| No | 10.2 | 67.4 | 50.7 | 4.6 | 71.6 | 49.5 |
| Total | 7.7** | 63.3* | 46.5 | 2.7 | 65.9 | 45.3 |
Note. Statistical significance measured between men and women for each productive activity.
*p < .01. **p < .001.
When we examined specific age groups, our results indicated that participation in paid work decreased dramatically with age, particularly for women (χ2 = 49.29; p < .001) compared with men (χ2 = 1.42; p = .004). Helping family members (χ2 = 1.63; p = .003) and engaging in volunteer activities (χ2 = 43.33; p < .001) also significantly decreased with age. Older adults who were married or had higher education levels, regardless of gender, were more likely to participate in all three types of productive activities. Participants with no chronic illnesses were more likely to participate in productive activities. Additionally, assisting family and volunteering increased among those with better financial status regardless of gender. Men with better financial status were more likely to participate in paid work (χ2 = 21.57; p < .001), whereas financial status had no influence on paid employment for women (χ2 = 1.31; p = .860).
Table 3 shows the results of regression analyses regarding the relationship between each productive activity and health outcomes after controlling for sociodemographic factors. The results showed that paid employment was significantly associated with fewer depressive symptoms (β = −0.60, p < .001), better functional health (β = −0.57, p < .05), and better self-rated health (β = 0.30, p < .001). Providing assistance to family and volunteer work were also found to be significantly related to fewer depressive symptoms, better functional health, as well as better self-rated health. To test gender differences, we entered three interaction terms in the model. The interaction term of Female × Paid employment was statistically significant (β = 0.81, p < .05), suggesting the effect of paid employment on depression differed by gender. A similar level of significance was found for Female × Family assistance (β = −0.50, p < .01) on functional health, but not for Female × Volunteer interaction. The results indicated that gender moderated the relationship between paid employment and depression as well as between assisting family and functional health.
Regression of Productive Activities on Well-Being
| Depression | Functional health | Self-rated health | ||||||||||
|---|---|---|---|---|---|---|---|---|---|---|---|---|
| Model 1 | Model 2 | Model 1 | Model 2 | Model 1 | Model 2 | |||||||
| B | β | B | β | B | β | B | β | B | β | B | β | |
| Age | 0.02** | 0.03 | 0.02** | 0.03 | 0.20*** | 0.32 | 0.20*** | 0.32 | −0.01*** | −0.10 | −0.01*** | −0.10 |
| Female | −0.10 | −0.02 | −0.06 | −0.01 | 0.35*** | 0.04 | 0.77*** | 0.09 | −0.09*** | −0.05 | −0.10** | −0.06 |
| Married | −0.44*** | −0.06 | −0.44*** | −0.06 | 0.03 | 0.00 | 0.02 | 0.00 | −0.06** | −0.03 | −0.06** | −0.03 |
| Educationa | ||||||||||||
| Primary school | −0.47*** | −0.07 | −0.47*** | −0.07 | −0.47*** | −0.05 | −0.45*** | −0.05 | 0.02 | 0.01 | 0.02 | 0.01 |
| High school | −0.85*** | −0.13 | −0.85*** | −0.13 | −0.74*** | −0.08 | −0.73*** | −0.08 | 0.01 | 0.01 | 0.01 | 0.01 |
| College and above | −1.40*** | −0.13 | −1.39*** | −0.12 | −0.75*** | −0.05 | −0.73*** | −0.05 | 0.07 | 0.02 | 0.07 | 0.02 |
| Financial status | 1.47*** | 0.36 | 1.47*** | 0.36 | 0.71*** | 0.13 | 0.71*** | 0.13 | −0.24*** | −0.22 | −0.24*** | −0.22 |
| Chronic illness | 0.98*** | 0.12 | 0.99*** | 0.12 | 1.30*** | 0.12 | 1.29*** | 0.12 | −0.64*** | −0.29 | −0.64*** | −0.29 |
| Paid employment | −0.60*** | −0.04 | −0.82*** | −0.06 | −0.57** | −0.03 | −0.51* | −0.03 | 0.30*** | 0.08 | 0.27*** | 0.07 |
| Assist family | −0.40*** | −0.06 | −0.39*** | −0.06 | −0.83*** | −0.09 | −0.58*** | −0.07 | 0.11*** | 0.06 | 0.11*** | 0.06 |
| Volunteer | −0.49*** | −0.08 | −0.41*** | −0.06 | −0.95*** | −0.11 | −0.84*** | −0.10 | 0.13*** | 0.07 | 0.12*** | 0.07 |
| Female × Paid employment | 0.81* | 0.03 | −0.23 | −0.01 | 0.12 | 0.02 | ||||||
| Female × Assist family | −0.01 | 0.00 | −0.50** | −0.06 | 0.01 | 0.01 | ||||||
| Female × Volunteer | −0.15 | −0.02 | −0.22 | −0.02 | 0.01 | 0.00 | ||||||
| Adjusted R2 | .241 | .242 | .230 | .231 | .200 | .201 | ||||||
aNo formal education was the reference category for education.
*p < .05. **p < .01. ***p < .001.
Figure 1 displays the effects of paid employment on depressive symptoms after controlling for sociodemographic variables. As shown, having paid employment was associated with fewer depressive symptoms for older men but not older women. Similarly, Figure 2 indicates that providing family assistance was related to fewer functional health limitations, and this effect was more prominent for older women.
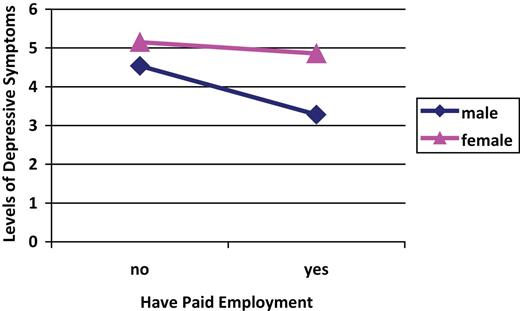
Effects of paid employment on levels of depressive symptoms.
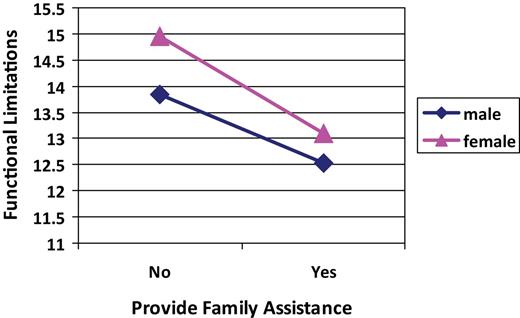
Effects of providing family assistance on functional limitations.
To further examine the magnitude of the relationship between each productive activity and health outcomes by gender and compare the effects of each type of activity on health, separate regression analyses were further conducted (see Table 4). The results indicated that having a paid job was significantly associated with decreased depression for men but not for women. Helping family members and volunteering were associated with lower levels of depression, fewer functional limitations, and better self-rated health for both men and women. Statistical tests were further conducted to examine whether the coefficients of each productive activity on health outcomes are statistically different in size between men and women. The results showed that the coefficient of paid work on depression among men was significantly different from that among women (t = 2.51, p < .05), and the coefficient of family assistance on functional health among men was significantly different from that among women (t = −2.82, p < .01). There were no significant differences in size between men and women on coefficients of volunteering on health outcomes.
Regression of Productive Activities on Well-Being by Gender
| Depression | Functional health | Self-rated health | ||||||||||
|---|---|---|---|---|---|---|---|---|---|---|---|---|
| Model 1 | Model 2 | Model 1 | Model 2 | Model 1 | Model 2 | |||||||
| B | β | B | β | B | β | B | β | B | β | B | β | |
| Men | ||||||||||||
| Age | 0.03*** | 0.06 | 0.02* | 0.03 | 0.20*** | 0.32 | 0.18*** | 0.29 | −0.02*** | −0.15 | 0.01*** | −0.12 |
| Married | −0.79*** | −0.09 | −0.75*** | −0.09 | 0.02 | 0.00 | 0.04 | 0.00 | −0.02 | −0.01 | −0.03 | −0.01 |
| Educationa | ||||||||||||
| Primary school | −0.66*** | −0.10 | −0.64*** | −0.10 | −0.72*** | −0.08 | −0.69** | −0.08 | 0.05 | 0.03 | 0.05 | 0.03 |
| High school | −1.12*** | −0.18 | −1.10*** | −0.18 | −1.08*** | −0.13 | −1.04** | −0.13 | 0.10* | 0.06 | 0.10* | 0.06 |
| College and above | −1.74*** | −0.19 | −1.72*** | −0.19 | −1.21*** | −0.10 | −1.20* | −0.10 | 0.16** | 0.07 | 0.16** | 0.06 |
| Financial status | 1.47*** | 0.36 | 1.44*** | 0.35 | 0.66*** | 0.13 | 0. 61*** | 0.12 | −0.24*** | −0.22 | −0.23*** | −0.21 |
| Chronic illness | 1.06*** | 0.14 | 1.02*** | 0.13 | 1.19*** | 0.12 | 1.13*** | 0.11 | −0.65*** | 0.31 | −0.63*** | −0.31 |
| Paid employment | −0.67*** | −0.06 | −0.66** | −0.04 | 0.25*** | 0.08 | ||||||
| Assist family | −0.35*** | −0.05 | −0.65*** | −0.08 | 0.10*** | 0.06 | ||||||
| Volunteer | −0.45*** | −0.07 | −0.87*** | −0.11 | 0.12*** | 0.07 | ||||||
| Adjusted R2 | .223 | .235 | .164 | .185 | .192 | .207 | ||||||
| Women | ||||||||||||
| Age | 0.02* | 0.03 | 0.01 | 0.01 | 0.23*** | 0.39 | 0.21*** | 0.34 | −0.01*** | −0.12 | −0.01*** | −0.08 |
| Married | −0.25** | −0.04 | −0.28** | −0.04 | 0.14 | 0.02 | 0.05 | 0.00 | −0.07** | −0.04 | −0.06** | −0.04 |
| Educationa | ||||||||||||
| Primary school | −0.53*** | −0.07 | −0.48*** | −0.07 | −0.51*** | −0.06 | −0.43** | −0.05 | 0.05 | 0.03 | 0.04 | 0.02 |
| High school | −0.95*** | −0.13 | −0.89*** | −0.12 | −0.78*** | −0.08 | −0.70*** | −0.07 | 0.03 | 0.02 | 0.02 | 0.01 |
| College and above | −1.07*** | −0.07 | −1.06*** | −0.07 | −0.29 | −0.02 | −0.34 | −0.02 | 0.03 | 0.01 | 0.03 | 0.01 |
| Financial status | 1.50*** | 0.04 | 1.48*** | 0.37 | 0.73*** | 0.14 | 0.70*** | 0.14 | −0.22*** | −0.22 | −0.21*** | −0.21 |
| Chronic illness | 1.15*** | 0.13 | 1.11*** | 0.12 | 1.36*** | 0.12 | 1.26*** | 0.11 | −0.67*** | −0.30 | −0.66*** | 0.29 |
| Paid employment | −0.07 | 0.01 | −0.69* | −0.03 | 0.32*** | 0.06 | ||||||
| Assist family | −0.32*** | −0.05 | −1.02*** | −0.11 | 0.10*** | 0.06 | ||||||
| Volunteer | −0.60*** | −0.09 | −1.08*** | −0.13 | 0.17*** | 0.10 | ||||||
| Adjusted R2 | .226 | .237 | .231 | .263 | .165 | .183 | ||||||
aNo formal education was the reference category for education.
*p < .05. **p < .01. ***p < .001.
When the effects of three productive activities on health outcomes were compared, we found that volunteering had a consistently greater effect on depression (β = −0.09), functional health (β = −0.13), and self-rated health (β = 0.10) among women compared with the two other activities. For men, volunteering had a similar effect on depression (β = −0.07) and functional health (β = −0.11), but paid employment exerted a slightly greater influence on self-rated health (β = 0.08) compared with the other activities.
Discussion and Conclusion
Using representative national data, this study examined participation in productive activities and its association with multiple health outcomes among older adults in urban China. The results showed that older Chinese adults in urban cities had a low participation rate in paid employment but high participation in assisting family and volunteering. Participation in these activities was generally associated with positive health outcomes, but the effects varied. The effects of paid employment on depression and family assistance on functional health differed significantly between genders.
Similarities and differences exist between our findings and those reported for Western populations in terms of participation in productive activities. We found that men and women participated in productive activities to a certain extent, but they differed in their choice of activities. Older men and women tended to follow the traditional division of labor: women cared for family members and helped with housework, whereas men tended to retain their breadwinner role by maintaining paid work even after retirement age. Gender differences did not emerge in terms of volunteering activities. We found that the labor force participation rate of both men and women in China was lower than adults aged 65 and older in the United States (22.1% for men and 13.8 for women; U.S. Census Bureau, 2011). This is mainly due to the wide implementation of mandatory retirement in China. Nonetheless, younger participants with better health, education, and financial status were more likely to be employed beyond retirement age. Congruent with the literature, we found that age (Wilson, 2000), education (Kim, Kang, Lee, & Lee, 2007; Li, Chi, & Xu, 2012), health (Kim et al., 2007), and wealth (Choi, 2003) played important roles in predicting participation in productive activities.
Our results showed generally positive correlations between paid work and physical and mental health. However, the positive relationship between paid work and depression differed by gender: men’s psychological well-being was positively associated with paid work, an association not found among women. A similar gender difference has been reported among older Korean adults (Jang et al., 2009). We suspect that older men may benefit from paid work through role identification—they are able to continue their role of breadwinner and thus feel valued as a contributing member of the family and society (Padavic & Reskin, 2002). Men may also benefit from paid employment through the social network they gain in the workplace, which may buffer against mental distress.
Our study demonstrated that assisting family members was associated with lower levels of depression and better functionality and self-rated health after controlling for other demographic and health variables. Such effects were evident among both men and women. We suspect several mechanisms may explain how providing assistance to family could result in physical and psychological benefits for older adults. First, being active and able to help family members could boost the self-esteem of older adults simply by making them feel useful. Second, providing assistance to family implies more frequent interaction with family members, which can decrease social isolation and contribute to better subjective well-being (Mair & Thivierge-Rikard, 2010). Third, assisting the family in various ways fits the traditional concept of mutual support among family members. Older adults may feel psychologically satisfied by following tradition (Lou, 2011). Finally, helping the family in one way or another can help older adults stay physically active, thus improving their health outcomes (Yu, Leung, & Woo, 2013). However, these findings should be interpreted with caution because our measure of providing assistance to family involved only three activities (i.e., looking after the house, helping with chores, and caring for grandchildren). We recognize that older adults involved in high-intensity caregiving to family members with serious diseases may experience negative health outcomes. In addition, inverse causality may exist: those who are physically healthy are more capable and more likely to offer help to their families. A previous study demonstrated that caring for grandchildren had negative effects on self-rated health among those who were widowed longer (Li et al., 2011), possibly due to the physically and mentally demanding nature of caring for grandchildren.
In our study, volunteering was associated with less depression and improved functionality and self-rated health among both older men and women. This finding adds to the current literature on the topic (Hong & Morrow-Howell, 2010; Morrow-Howell et al., 2003) and indicates that volunteering is positively associated with mental and physical health among older Chinese adults. This consistent finding suggests that regardless of cultural variations in volunteer sectors across nations, engagement in volunteering itself has positive health benefits for older adults. Future research should gather more specific information about the intensity, length, frequency, and types of volunteering activities and their produced effects, and more importantly, examine the mechanisms by which the effects are produced (Morrow-Howell, 2010).
When the effects of three productive activities on health outcomes were compared, we found that volunteering had a consistently greater effect that the other two activities for women, whereas it had a similar effect on depression and functional health for men. We suspect this positive effect on women might be because volunteering provides them with an opportunity to take a break from their traditional role. They can network and socialize with others outside of their family and workplace and engage in new roles that are psychologically rewarding. This experience may have a powerful effect on women compared with other roles that they have assumed in their life.
This study is not without limitations. First, the cross-sectional nature of the data only allowed testing of associations rather than causal relationships among productive activities and health outcomes. Therefore, the direction of the relationships we identified could be reversed. The associations identified in this study should be vigorously studied using longitudinal data in the future. For example, how the focal associations varied between different age cohorts and historical time could be further explored. However, given the paucity of research testing the effects of productive activities on health among older Chinese adults, this study was an important step. Second, this study was limited by the variables available in the secondary data. Many of the variables were measured dichotomously, leaving us few options to better quantify specific activities. For example, we could not determine how long and how often older adults volunteered. In future research, better quantification of type, form, intensity, and duration of productive activities could further refine our understanding of these activities and their effects on health outcomes (Lum, 2012). It is also important to develop more indigenous measures of productive activities specific to older Chinese adults, such as more specific measures of providing assistance to families in various ways given the high rate of participation in this activity. Finally, this study only examined urban samples because of the availability of data, which limited the generalizability of our findings and restricted our understanding of how productive activities may affect rural older adults. Conceptually, productive aging is an emerging concept and practice in China (Lum, 2012). Social discourse regarding older adults’ productive role in society occurs mostly in the urban context in China and much less so in rural areas. This is mostly because there is no clear cutoff time for rural older adults to enter their “third age.” However, with the process of urbanization and increasingly blurred distinction between rural and urban lifestyles, future research would benefit from developing valid definitions and measures of productive activities to document the development of such an emerging concept and practice among rural older adults.
Despite these limitations, our findings demonstrated positive relationships between productive activities and health for both men and women in general, in addition to suggesting some gender differences in the relationships between particular activities and health. These findings have implications for policies and programs that seek to promote productive aging in China. National programs such as Silver Aging Action could benefit from expanding the definition of productive activities beyond formal volunteer opportunities by incorporating family assistance and paid employment after retirement. Structural barriers that prevent older Chinese adults from participating in productive activities (Li et al., 2012; Xie, 2008) should be further explored in the future. In the meantime, given the social and cultural differences in volunteering behaviors in China (Wu et al., 2005), there is a need to identify indigenous forms of volunteering that older Chinese adults are more likely to accept and practice. For instance, volunteering activities that emphasize peer support, family enhancement, intergenerational solidarity, or health maintenance could be welcomed by older Chinese adults. As research increasingly demonstrates the potential of productive activities in maintaining the health of older adults, this evidence can be used by health care practitioners, community advocates, and policy makers who promote productive aging to select or develop their strategies accordingly.
References
Author notes
Decision Editor: Rachel Pruchno, PhD

