


Abstract
The goal of audience segmentation is to identify population subgroups that are homogeneous with respect to certain variables associated with a given outcome or behavior. When such groups are identified and understood, targeted intervention strategies can be developed to address their unique characteristics and needs. This study compares the results of audience segmentation for physical activity that is based on either demographic, health status or psychosocial variables alone, or a combination of all three types of variables. Participants were 1090 African-American and White adults from two public health centers in St Louis, MO. Using a classification-tree algorithm to form homogeneous groups, analyses showed that more segments with greater variability in physical activity were created using psychosocial versus health status or demographic variables and that a combination of the three outperformed any individual set of variables. Simple segmentation strategies such as those relying on demographic variables alone provided little improvement over no segmentation at all. Audience segmentation appears to yield more homogeneous subgroups when psychosocial and health status factors are combined with demographic variables.
Introduction
Audience segmentation is a process whereby a large and heterogeneous population is divided into more homogeneous subgroups on the basis of shared characteristics known or presumed to be associated with a given outcome of interest (Slater, 1996). Because most health communication campaigns and materials are designed to reach a particular population subgroup, audience segmentation is integral to these efforts (Maibach et al., 1996). At the simplest level, a population may be segmented into subgroups on the basis of demographic variables such as age, race, gender, income or some combination of these variables. This approach has been fairly common in public health education, where epidemiological studies identify population subgroups with elevated risk and describe them using whatever demographic variables were collected. However, demographic homogeneity alone may be of limited usefulness in constructing meaningful health messages (Slater, 1995), especially given the potential for wide variability within broad demographic categories (Kreuter et al., 2003). More sophisticated audience segmentation strategies also consider homogeneity of groups in terms of psychosocial, behavioral, geographic, psychographic, and/or combinations of these and other variables (Weinstein, 1994). Such multivariable approaches to audience segmentation are routinely used in advertising and marketing, but less so in public health communication efforts.
To explore the relative value of different audience segmentation strategies for health communication, we compared the results of classification-tree analyses in which sets of demographic, health status and psychosocial variables were used independently and in combination with one another to identify population subgroups that were homogeneous with respect to physical activity. Determining which types of variables best predict subgroups' status on important behavioral outcomes can help optimize audience segmentation in health communication.
Method
Participants
Participants were 1090 adults from two public health centers in St Louis, MO. Participants had to be African-American or Caucasian, aged 18–65 years, have a working telephone and mailing address, be able to complete a self-administered questionnaire written at the sixth-grade reading level, and be willing to participate in two follow-up telephone interviews in the 4-month period following their enrollment [part of a randomized trial, funded by the Centers for Disease Control and Prevention (CDC), comparing four methods of tailoring health communications]. Data used in this analysis was collected at the baseline period, before any intervention had been delivered, so group assignment is immaterial to the analysis. This project was approved by the St Louis University Institutional Review Board (#10573).
Data collection
Participants completed a self-administered pen-and-paper survey while in the waiting area of two public health centers in St Louis County. The survey questionnaire was developed for this research project, drawing on previous research conducted by this research team. At both health centers, individuals were approached, given a description of the project and offered the opportunity to participate. Individuals who were interested were screened for eligibility and asked to provide informed consent. Participants then completed and returned the survey, which assessed their current level of physical activity, as well as a number of characteristics which previous research has determined are related to levels of physical activity. These include demographic characteristics (Macera and Pratt, 2000), health status (Trost et al., 2002) and psychosocial characteristics (Treiber et al., 1991; Marcus et al., 1992; Ryan et al., 1997).
Measures
Physical activity
Moderate and vigorous physical activity were defined using the recommendations issued in 1995 by the CDC and American College of Sports Medicine (Pate et al., 1995). In this report, moderate activity is defined as ‘activity during which a person will experience small increases in breathing and heart rate’ and to meet the moderate activity recommendation an individual needs to engage in 30 min or more of moderate physical activity at least 5 times per weeks. Vigorous activity is described as activity during which ‘a person will experience large increases in breathing and heart rate’ and to meet the vigorous activity guidelines an individual needs to engage in 20 min or more of vigorous activity at least three times per week. Level of moderate physical activity was assessed using three questions. The first assessed whether respondents engaged in moderate physical activity for at least 10 min at a time in a usual week (yes/no). For those responding ‘yes’, a second question assessed how many days per week they engaged in moderate activity for at least 10 min at a time (1–7 days). The third question assessed how many total minutes of moderate activity they engaged in on days when they engaged in moderate activity for at least 10 min at a time (10–19/20–29/30–39/40–49/50–59/60+ min). The same three-question format was used for assessing vigorous physical activity. All questions were based on items from the 2001 Behavioral Risk Factor Surveillance System questionnaire (Centers for Disease Control and Prevention, 2001), and have been shown to have adequate reliability and validity for both African-Americans and Whites (Kass, 1980; Biggs et al., 1991; SPSS, 1998; Barnes and Schoenborn, 2003).
Participants who engaged in moderate activity for at least 30 min per day, on at least 5 days per week, were classified as meeting the CDC standard for moderate physical activity. Participants who engaged in vigorous physical activity for at least 20 min per day, on at least 3 days per week, were classified as meeting the CDC standard for vigorous physical activity. Because CDC has recently decided to combine in its reporting the proportions of people meeting either standard (Barnes and Schoenborn, 2003), we also created a single variable to indicate whether each participant met either or both the vigorous and moderate standard or neither. This dichotomous variable was the primary outcome in all segmentation analyses.
Demographic variables
The survey assessed age in years, race (African-American or Caucasian), sex, years of education, and pre-tax household income during the preceding year (US$<10 000/10 000–30 000/>30 000).
Health status variables
The survey assessed self-rated health, personal history of six chronic diseases for which physical inactivity is a risk factor and/or physical activity is therapeutic, and physician advice to engage in physical activity. Participants rated their current health as excellent, very good, good, fair or poor. They also indicated whether they had ever been told by a doctor that they had heart disease, cancer, diabetes, obesity, high blood pressure or arthritis. We summed the number of chronic diseases reported for each individual and created a single variable with a potential range of 0–6. Finally, the survey assessed whether in the last 12 months a doctor or nurse had told the respondent to ‘get more exercise’.
Psychosocial variables
The survey assessed four psychosocial variables which in previous research have been shown to be closely related to physical activity level: intrinsic motivation (Ryan et al., 1997), self-efficacy (Marcus et al., 1992; Sallis and Owen, 1997), social support (Treiber et al., 1991) and perceived barriers (Ducharme and Brawley, 1995; Booth, 1997; Chinn et al., 1999). Intrinsic motivation was measured with 12 items adapted from the Motivation for Physical Activities Measure (Frederick and Ryan, 1993), which assessed the dimensions of enjoyment (e.g. ‘I enjoy physical activity a lot’) and challenge/mastery (e.g. ‘I always set personal goals for physical activity’). Response options ranged from strongly disagree to strongly agree and were assigned values of 1–5, respectively. Individual item scores were summed to create an intrinsic motivation score that could range from 12 to 60. The intrinsic motivation scale had a coefficient α of 0.90 with corrected item-total correlations ranging from 0.62 to 0.74. Self-efficacy was measured with seven items from a scale by Marcus (Marcus et al., 1992, 1994) which assessed how confident the respondent was that he or she could engage in physical activity under different circumstances (e.g. when tired, busy, injured). The same five-point response scale was used as for intrinsic motivation, and was summed across items to create a single self-efficacy score with values that could range from 7 to 35. The self-efficacy scale had a coefficient α of 0.88 and corrected item-correlations ranging from 0.63 to 0.69. Social support was measured using three items adapted from a scale originally developed by Sallis (Sallis et al., 1987) and modified by Eyler (Eyler et al., 1999) for use with a minority population. This scale assessed whether the respondent had social support for exercise from his or her friends, family or others. The same five-point response scale was used and responses were summed across items to create a single social support score ranging from 3 to 15. The social support scale had a coefficient α of 0.77 and corrected item-total correlations ranging from 0.52 to 0.67. Most items were pilot tested in a test–retest procedure (with a 2-week interval) among 60 participants from the same health centers as the current study population was drawn from. Test–re-test correlations were 0.83 for intrinsic motivation, 0.67 for self-efficacy and 0.25 for social support. In analyses, the automatic interval selection feature in AnswerTree was used to split each of these psychosocial scales into no more than three groups in order to avoid large numbers of segments with very small sample sizes. Barriers were measured by asking whether any of nine factors ‘keep you from meeting this definition of regular physical activity’. These barriers, which have been identified in previous research as important determinants of physical activity (Sallis and Owen, 1997), included ‘a medical condition or illness’, ‘no exercise equipment to use’, ‘no one to do physical activity with’, ‘no safe place to do physical activity’, ‘no convenient place to do physical activity’, ‘concern that I might get hurt’, ‘lack of childcare’, ‘too many responsibilities’ and ‘scheduling problems’. The number of barriers identified by each respondent was then summed to yield a total barrier count with values ranging from 0 to 9.
Statistical analyses
Analyses were conducted with the Exhaustive CHAID option of SPSS AnswerTree 2.0 (SPSS, 1998). Exhaustive CHAID is a classification tree method whose purpose is to create homogenous groups based on the value of some outcome variable (in this case, meeting one of the CDC physical activity standards) by splitting cases into two or more groups on the basis of designated predictor variables (Kass, 1980; Breiman et al., 1984; Biggs et al., 1991). After each split, the resulting groups are evaluated separately to see if a further split on any of the predictor variables would create significantly more homogenous groups. When it is no longer possible to make the resulting groups more homogenous (at a significance level of α = 0.05), the program halts. These final groups are called ‘terminal nodes’, and represent the most homogenous groups that can be created given the predictor variables and specified α level.
CHAID is a particularly useful technique when a study is exploratory rather than confirmatory in nature, involves the relationships between a number of independent variables and a single dependent variable, when the independent variables interact with each other, and when there is no strong theory concerning the relative importance of the independent variables in predicting the dependent variable. CHAID has the further advantage of allowing variables at different levels of measurement (nominal, ordinal and scalar) to be combined in the same analysis without recoding. A third advantage of using CHAID rather than more traditional techniques such as regression analysis is that each group created by a split is evaluated independently for the next best predictor. For instance, in a CHAID analysis, the initial split might be into groups of high and low intrinsic motivation. It is possible that the next best predictor for the low motivation group is barriers, while for the high motivation group it is self-efficacy: this would suggest that different targeting strategies should be developed for those two groups.
CHAID techniques have been applied in a number of fields, including predictors of medical outcomes for patients with intracranial hemorrhage (Dubinsky and Penello, 2002) identifying factors which define problem drinking (Bailey, 1999), factors predicting usage of independent dental services (McGrath et al., 1999) and identification of barriers to HIV services (Huba et al., 2001).
We conducted four separate AnswerTree analyses. The first three each created classification trees using a single set of predictor variables: demographic, health status, then psychosocial. The fourth analysis included all three sets of variables together in the same model. Analyses excluded 255 participants who were missing data on any one of the 12 variables included in the analysis, leaving a final sample of 835 (76.6% of the original sample).
Results
Sample
In the final sample (n = 835), most participants were women (69.1%), Caucasian (58.2%) and high school graduates (82.8%). The mean age was 32.4 years and 39.6% had an annual pre-tax household income of $20 000 or less. About one-third (37.1%) met either the moderate or vigorous physical activity standard. Most reported their health as good (41.8%) or very good (26.8%) and the mean number of chronic diseases was less than 1 (0.6). About one-third (34.0%) had been advised by a doctor or nurse to get more exercise.
Demographic predictors
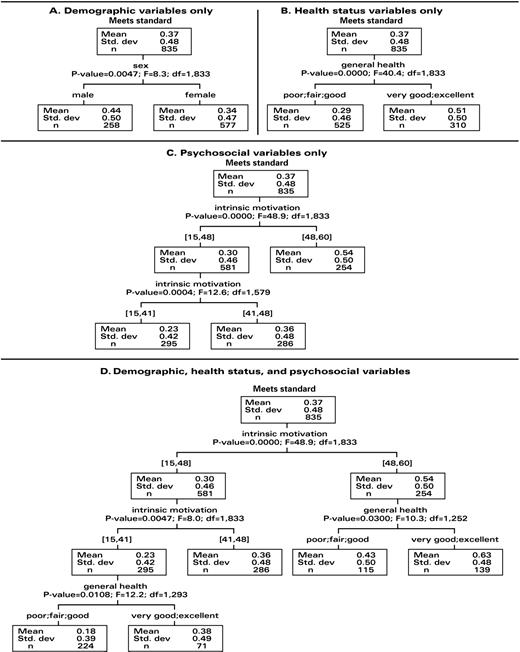
Demographic predictors included age, race, sex, income and years of education. Of these, only sex created groups that were significantly more homogeneous on physical activity than the undifferentiated study population. Among men, 44% met a physical activity standard compared to 34% of women. Thus, demographic predictors created two groups, each of which was significantly more homogeneous in terms of meeting a physical activity standard than was the study population as a whole (F = 8.04, P = 0.005).
Health status predictors
Health status predictors included general health status, number of chronic diseases, and whether the participant had been advised by a doctor or nurse to exercise more. The only variable that created groups significantly more homogeneous on physical activity than the undifferentiated study population was general health. Among participants in poor, fair or good health, 29.1% met one of the standards, compared to 50.6% of those in very good or excellent health (F = 40.38, P = 0.000).
Psychosocial predictors
Psychosocial predictors included barriers to physical activity and the self-efficacy, intrinsic motivation and social support scales. Of these, only intrinsic motivation created subgroups that were significantly more homogeneous than the overall study population. This variable was used twice in branching. First, two groups were formed among participants above or below 48 on this 60-point scale. Participants with scores of 48 or lower were subdivided a second time into those with scores 41–48 and those with score 41 and lower. This model had three terminal nodes. The first group consisted of participants with intrinsic motivation scores of 41 or lower; 23% of participants in this group met one of the physical activity standards. The second group consisted of participants with intrinsic motivation scores between 41 and 48; 36% of participants in this group met one of the physical activity standards. In the third group, participants with intrinsic motivation scores above 48, 54% met one of the standards.
All predictors combined
The most complex classification tree was created by allowing all three sets of variables to enter into a single model. In this analysis, the first split was on intrinsic motivation: above or below 48 on this scale. The group with higher intrinsic motivation scores split again on general health status, separating those with poor, fair or good health from those with very good or excellent health. Among those with high intrinsic motivation and very good or excellent health, 63% met one of the CDC standards. This was the highest proportion of any group formed in any of the four analyses and much higher than overall sample proportion of 37%. About one in six participants in the overall sample (16.7%) were included in this group.
Participants with scores of 48 or lower on the intrinsic motivation scale were split two more times. First, additional groups were formed among those with intrinsic motivation scores below 41, and between 41 and 48. The group with the lowest motivation scores split again on health status, dividing those with poor, fair or good health from those with very good or excellent health. Among those with lower intrinsic motivation scores and lesser health status, only 18% met one of the CDC standards. This was the lowest percentage of any group and over one-quarter of the total sample (26%) was included in this segment. Figure 1 shows the classification trees resulting from each of the four analyses, and Table I compares all segmentation strategies on the number of terminal nodes and level of variability in physical activity across nodes.
Results of AnswerTree analyses for meeting CDC standards for moderate or vigorous physical activity by demographic variables only (A), health status variables only (B), psychosocial variables only (C), and combination of demographic, health status and psychosocial variables (D).
Number of terminal nodes and range across terminal nodes in the percentage of participants meeting a CDC physical activity standard, by audience segmentation strategy
Audience segmentation strategy | Terminal nodes | Range across terminal nodes in percentage meeting a CDC physical activity standard |
|---|---|---|
| No segmentation | NA | 37 |
| Demographic variables only | 2 | 34–44 |
| Health status variables only | 2 | 29–51 |
| Psychosocial variables only | 3 | 23–54 |
| All variables combined | 5 | 18–63 |
Discussion
For over a decade, health communication researchers have called for the development and testing of more sophisticated segmentation techniques to capture and address the diverse nature of audiences (Freimuth and Mettger, 1990; Maibach et al., 1996; Kreuter and Skinner, 2000). With a few notable exceptions (Endresen and Wintz, 1988; Slater and Flora, 1991; Williams and Flora, 1995) such has not been the case. While psychographic and lifestyle analyses have long been standard practice in business marketing (Weinstein, 1994), their use in public health communication efforts is still much less common. Findings from this study offer further evidence to support the use of multivariable approaches to audience segmentation for health communication.
In the overall sample, 37% of adults were currently meeting one of the CDC standards for physical activity. Ideally, audience segmentation strategies should create subgroups in which this percentage is either higher (i.e. greater homogeneity of high levels of activity) or lower (i.e. greater homogeneity of inactivity). Analyses showed that segmentation based on demographic variables alone provided only modest improvement over no segmentation at all, producing just two terminal nodes (i.e. segments) within which the percentage of participants meeting a CDC physical activity standard ranged from only 34 to 44%. Segmentation based only on health status variables (two terminal nodes, 29–51% meeting CDC standards) or psychosocial variables (three terminal nodes, 23–54% meeting CDC standards) provided greater improvement over no segmentation at all and over demographic segmentation alone. The combination of all three sets of variables provided the greatest segmentation, producing five terminal nodes and a range of 18–63% of participants meeting one of the CDC physical activity standards.
Other studies have also reported that demographic variables alone may be of limited value in identifying audience segments that are homogeneous with respect to health-related outcomes. For example, Slater and Flora (Slater and Flora, 1991) reported that the two audience segments in their study that were statistically most dissimilar in terms of cardiovascular disease risk were both comprised of middle-aged, middle-income, Caucasians. Although some organizations operating with limited resources may argue that demographic segmentation is better than nothing, data from the present study suggest that in at least some cases (e.g. segmenting audiences for a behavioral outcome), this may not be true. However, this is not to say that demographic variables cannot contribute to meaningful segmentation. Resnicow et al. (Resnicow et al., 1999) have suggested that by matching health education materials to the ‘surface’ characteristics of a target population (i.e. its demographic characteristics), the group's receptivity to and acceptance of health messages can be enhanced. Audience segmentation appears to yield more homogeneous subgroups when psychosocial and health status factors are combined with demographic variables.
As would be predicted by leading theories of health behavior (Treiber et al., 1991; Marcus et al., 1992; Ryan et al., 1997) audience segmentation based on psychosocial variables derived from such theories was comparatively more successful at creating groups that were homogeneous with respect to physical activity. The psychosocial variables included in the analyses (intrinsic motivation, self-efficacy and social support) are known to be associated with a range of health-related behaviors, including physical activity (Treiber et al., 1991; Marcus et al., 1992; Ryan et al., 1997). Among these variables, intrinsic motivation contributed most to creating homogeneous subgroups from our overall sample. Although the general concept of motivation is integrated in some way into most theories of behavior change, the specific dimensions of motivation (e.g. intrinsic, extrinsic) have received comparatively less attention than other constructs in health behavior research. These findings suggest that intrinsic motivation is an important predictor of physical activity and its role should be explored further.
Although these findings illustrate potentially important differences between approaches to audience segmentation, they should not be interpreted as a definitive roadmap for successful segmentation regarding physical activity. First, our analyses were based only on those variables available in the study, which were not exhaustive of all demographic, health status and psychosocial variables that might be related to physical activity. Second, entire categories of segmentation variables (e.g. geographic, psychographic) were not represented at all in analyses. Third, as is typical of self-reported data, responses to our survey made display social desirability bias. Finally, because the study sample was selected by convenience from just two urban health centers in St Louis, MO, its findings are not generalizable to broader populations. Despite these limitations, the study findings still demonstrate the potential value of using more sophisticated strategies of audience segmentation for health behaviors.
This study was funded by the US Centers for Disease Control and Prevention (grant RO6/CCR717216-02). We gratefully acknowledge Charles Williams, Lydia Steward, Meshia Qualls, and Christina Bender for their assistance in data collection, and Chris Casey and Ellen Fitch for their assistance preparing the manuscript.
References
Bailey, S.L. (
Barnes, P. and Schoenborn, C. (
Biggs, P., de Ville, B. and Suen, K. (
Booth, M.L., Bauman, A., Owen, N. and Gore, C.J. (
Breiman, L., Friedman, J., Olshen, R. and Stone, C. (
Centers for Disease Control and Prevention (
Chinn, D.J., White, M., Harland, J., Drinkwater, C. and Raybould, S. (
Dubinsky, I. and Penello, D. (
Ducharme, K.A. and Brawley, L.R. (
Endresen, K.W. and Wintz, J.C. (
Eyler, A.A., Brownson, R.C., Donatelle, R.J., King, A.C., Brown, D. and Sallis, J.F. (
Frederick, C. and Ryan, R. (
Freimuth, V.S. and Mettger, W. (
Huba, G.J., Melchior, L.A., Smereck, G.A., Brown, V.B., Jean-Louis, E., German, V.F., Gallagher, T., McDonald, S.S., Stanton, A., Hughes, C., Marconi, K. and Panter, A.T. (
Kass, G. (
Kreuter, M.W. and Skinner, C.S. (
Kreuter, M.W., Lukwago, S.N., Bucholtz, R.D., Clark, E.M. and Sanders-Thompson, V. (
Macera, C.A. and Pratt, M. (
Maibach, E., Maxfield, A., Ladin, K. and Slater, M. (
Marcus, B.H., Selby, V.C., Niaura, R.S. and Rossi, J.S. (
Marcus, B.H., Pinto, B.M., Simkin, L.R., Audrain, J.E. and Taylor, E.R. (
McGrath, C., Moles, D. and Bedi, R. (
Pate, R.R., Pratt, M., Blair, S.N., Haskell, W.L., Macera, C.A., Bouchard, C., Buchner, D., Ettinger, W., Heath, G.W. and King, A.C. (
Resnicow, K., Baranowski, T., Ahluwalia, J.S. and Braithwaite, R.L. (
Ryan, R., Frederick, C., Lepes, D., Rubio, N. and Sheldon, K. (
Sallis, J. and Owen, N. (
Sallis, J.F., Grossman, R.M., Pinski, R.B., Patterson, T.L. and Nader, P.R. (
Slater, M.D. (
Slater, M.D. (
Slater, M.D. and Flora, J.A. (
Treiber, F.A., Baranowski, T., Braden, D.S., Strong, W.B., Levy, M. and Knox, W. (
Trost, S.G., Owen, N., Bauman, A.E., Sallis, J.F., Brown, W. (
Weinstein A. (
Author notes
1Department of Pediatrics, Washington University School of Medicine, St Louis, MO 63110, 2Health Communication Research Laboratory, Department of Community Health, School of Public Health, St Louis University, St Louis, MO 63108 and 3Department of Community and Family Medicine, St Louis University, St Louis, MO 63104, USA