


Abstract
Mutations in the MLC1 gene are responsible for one form of the neurological disorder megalencephalic leukoencephalopathy with subcortical cysts (MLC). The disease is a type of vacuolating myelinopathy. The biochemical properties and the function of the MLC1 protein are unknown. To characterize MLC1, we generated polyclonal antibodies. The MLC1 protein was detected in the brain, assembled into higher molecular complexes, as assessed by assembly-dependent trafficking assays. In situ hybridization and immunohistochemistry were used to determine MLC1 localization within the adult mouse brain. MLC1 was expressed in neurons, detected preferentially in particular axonal tracts. This expression pattern correlates with the major phenotype observed in the disease. In addition, it was expressed in some astrocytes, concentrating in Bergmann glia, the astrocyte end-feet membranes adjacent to blood vessels and in astrocyte–astrocyte membrane contact regions. Other neuronal barriers, such as the ependyma and the pia mater, were also positive for MLC1 expression. MLC1 was detected in vivo and in heterologous systems at the plasma membrane. MLC mutations impaired folding, and the defect was corrected in vitro by addition of curcumin, a Ca2+-ATPase inhibitor. In summary, this study provides an explanation as to why mutations in MLC1 provoke the disease and points to a possible therapy for some patients.
INTRODUCTION
Megalencephalic leukoencephalopathy with subcortical cysts [MLC (MIM 604004)] is an autosomal recessive disorder characterized clinically by macrocephaly, deterioration in motor functions, cerebellar ataxia and mental decline (1–3). Magnetic resonance imaging (MRI), together with clinical findings, is used to diagnose the disease. MRI diagnosis of this disorder is through the identification of characteristics that include swollen brain with diffuse white-matter abnormalities and subcortical cysts mainly in the temporal regions (1).
Localized proton magnetic resonance spectroscopy shows a reduction of some metabolites, including N-acetylaspartate, creatine and choline (1,4,5), and an increase in glycine (6) and taurine (7). These findings are in line with the severe neurodegeneration observed in patients with MLC. A brain biopsy revealed vacuoles in the outer part of the myelin sheaths (8) and it was proposed that the disease was another case of vacuolating myelinopathies. At present, there is no therapy for this disease.
The first gene responsible for MLC was mapped to chromosome 22qtel (9,10) and identified as MLC1 (also called KIAA0027 or WKL1) (11). In total, 26 distinct mutations have been identified in this gene, including missense mutations, insertions, deletions and alterations in the splice sites (11–14). Some mutations are quite frequent in certain populations, indicating a founder effect (3,12,13,15). MLC1 encodes for a membrane protein with eight predicted transmembrane domains (11). It presents low homology (<20% amino acid identity) with the Kv1.1 channel [involved in ataxia (16)]. MLC1 contains an internal repeat, reflected in a weak primary sequence homology between the two halves. This internal repeat structure is also found in several ion channel proteins (17–19), and is probably due to gene duplication. The properties of the primary sequence lead to the hypothesis that the MLC1 protein is an ion channel (11,20). In line with this,>60% of patients with MLC had epileptic seizures, a phenotype that is unusual in other leukodystrophies (21). Epilepsy is frequently caused by mutations in genes coding for ion channels (22). Furthermore, the MLC1 amino acid sequence has the signature of ABC-2 type transporters and sodium/galactoside transporters with low significance (11). Altogether, these observations indicate that MLC1 may be a carrier protein of an unknown substrate.
MLC1 mRNA is highly expressed in the brain (23) and in peripheral white blood cells and spleen. Recent in situ hybridization (ISH) studies (24) report MLC1 mRNA in glial cells such as astrocytes, Bergmann glia and ependymal cells, but not in neurons.
Some patients with the characteristic features of MLC do not harbor mutations in MLC1, and linkage with the MLC1 locus is excluded (25,26). This finding implies that there is at least a second gene responsible for the disease. Furthermore, there is an intrafamilial phenotype variability, indicating that unknown environmental or genetic factors influence the severity of the disease.
In addition, it has been reported that an amino acid change (L309M) is associated in a dominant manner with catatonic schizophrenia in a single large pedigree (20,27). However, other reports rule out MLC1 as a locus of schizophreny or bipolar disorder (28–34).
Using new polyclonal antibodies, here we determined its localization in the brain by immunohistochemistry, combined with ISH. MLC1 protein was detected at the plasma membrane. No ion channel activity attributable to MLC1 was detected in heterologous cell systems. To evaluate the effect of MLC mutations, we studied the total protein levels and the expression at the plasma membrane. All the studied missense mutations in MLC patients showed a decrease in total and plasma membrane levels of the MLC1 protein. For one of the MLC missense mutations (S280L), we demonstrate that this reduction is due to a diminished half-life of the mutant protein. Treatment with curcumin, a Ca2+-ATPase blocker, increased surface levels of this mutant.
RESULTS
Biochemical characteristics of the MLC1 protein
Immune sera against two non-overlapping synthetic peptides derived from the N-terminal region of mouse MLC1 were generated (see Materials and Methods) in rabbit and guinea pig. After affinity purification using these peptides, the polyclonal antibodies, were tested by western blot and immunofluorescence on HeLa cells transiently transfected with mouse MLC1. These cells were used because they do not express mRNA of human MLC1 (23). Co-transfection with GFP was used to identify cells expressing mouse MLC1. Both antibodies detected the protein by western blot in reducing conditions (Fig. 1A) from membranes of mouse MLC1-transfected HeLa cells and brain extracts, recognizing several bands corresponding to the sizes (∼32, 70 and 115 kDa), and by immunofluorescence from MLC1-transfected cells (Fig. 1B). No difference in bands motility was found in non-reducing conditions, indicating that the appearance of these bands does not depend on the formation of disulfide bridges (data not shown). These bands were not detected in non-transfected HeLa cells or in transfected cells using the pre-immune serum. The predicted molecular weight of mouse MLC1 is ∼41 kDa, ∼10 kDa more than the apparent molecular weight of the lowest detected band in the western blot. We hypothesize that this is due to the high hydrophobicity of the protein, because, similarly, other membrane proteins run in SDS gels at lower molecular weights than the expected sizes (35). The ∼70 and 115 kDa bands may correspond, respectively, to a dimer and trimer of the MLC1 protein.
Northern blot experiments showed that MLC1 is highly expressed in the brain (23). Western blot of rat brain membranes using both antibodies detected two bands of ∼32 and 70 kDa, with the same sizes as the protein expressed in HeLa cells. This observation suggests that MLC1 assembles into higher molecular weight complexes. Assembly-dependent trafficking assays were used to test this hypothesis (discussed subsequently).
Immunofluorescence experiments were used to determine the subcellular localization of mouse and human MLC1 in several heterologous systems. Mouse MLC1 was expressed at the plasma membrane in transfected HeLa cells (Fig. 1B). Because our antibodies recognized the human MLC1 protein only with lower affinity, we inserted an HA (hemagglutinin) epitope tag in the N-terminal region of human MLC1 to detect its subcellular localization. To perform this localization, we used the Xenopus oocyte system. Xenopus oocytes injected with the cRNA of N-HA-tagged human MLC1 and uninjected oocytes (W) were frozen, sectioned and probed with a specific antibody against the epitope. The protein was localized at the plasma membrane of human MLC1-injected oocytes (Fig. 1C). No signal was detected in uninjected oocytes, confirming the specificity of our results.
Analysis of the human MLC1 protein sequence (http://www.cbs.dtu.dk/services/NetNGlyc/) indicated one N-glycosylation site (KLVLNPSAINI) in the short extracellular loop between the predicted transmembrane domains 3 and 4 (in bold). The proposed glycosylation site is not conserved in the zebrafish MLC1 homolog (Supplementary Material, Fig. S1). To clarify whether MLC1 is glycosylated, we performed two types of experiments: (1) incubation with endoglycosidase F and (2) mutation of this putative glycosylation site (Asn136Ala). No changes in electrophoretic mobility were observed after incubation with Endo F (data not shown). In an analogous way, neither did the N136A mutation affect the electrophoretic mobility of MLC1 (Fig. 6B, underlined) or the levels of the protein at the plasma membrane (Fig. 6A, underlined). These results indicate that MLC1 is not glycosylated.
Oligomeric structure of MLC1
The electrophoretic mobility of the MLC1 protein in the brain indicated that it may be a dimer. Alternatively, oligomerization could be due to unspecific aggregation. To exclude the latter possibility, we tested whether this protein forms oligomers in vivo using assembly-dependent trafficking assays (36). This method allows the study of interactions between membrane proteins. In most membrane protein oligomers, the assembly in the endoplasmic reticulum (ER) and the traffic to the surface are coupled. In these cases, one subunit contains an ER retention/retrieval signal that is hidden after subunit assembly. Following this, the detection of a retained subunit in the plasma membrane is an indirect indication of assembly in the ER.
For this method, we first used recombinant PCR to introduce an HA epitope tag in the predicted extracellular loop between the putative transmembrane domains 7 and 8 (see Materials and Methods and inset in Fig. 2A). We injected a range of amounts (0.1, 0.5, 1, 5 and 10 ng) of this construct (MLC1-HAL) into oocytes and quantified the amount of extracellularly expressed epitope (see Materials and Methods). A specific signal (Fig. 2A, legend) caused by the MLC1 protein increased in a proportional manner with the amount of cRNA injected.
We next tested whether the introduction of an ER retention signal would cause a reduction in the amount of MLC1 at the plasma membrane. We added five consecutive arginines after the starting methionine in MLC1 (R5-HAL). This signal has been described as a very strong retention signal (36). In a control construct, we added five alanines in the same position (A5-HAL) to ensure that the effects were due to specific retention and not to the insertion of any amino acid sequence. No difference in plasma membrane expression was found between this control construct (A5-HAL) and MLC1-HAL. The insertion of the retention signal strongly decreased the amount of MLC1 at the plasma membrane (Fig. 2B). From three independent experiments, the introduction of the retention signal led to a decrease of ∼87% (n=18) in the plasma membrane levels of the protein.
We next co-expressed MLC1 without an epitope-tag (no signal detected at the plasma membrane, Fig. 2B) with the same amount of R5-HAL cRNA. The amount of protein at the plasma membrane after co-expression (corresponding only to the tagged MLC1) was higher than when expressed alone, indicating a relief of the ER-retention. As an additional control, we co-expressed R5-HAL with an unrelated protein that is present at the plasma membrane (4F2hc) (35). In this case, no increase in the HA antibody signal was observed. This result indicates that the MLC1 protein oligomerizes with itself in the ER.
Localization of MLC1 in the adult mouse brain
To study the distribution and subcellular localization of MLC1 in vivo, we performed ISH and immunocytochemistry experiments in adult brain sections. Identical structures were labeled with either probe or antibody, thus providing strong evidence for the specificity of the staining.
In agreement with a previous report based on ISH experiments (24), high expression of MLC1 mRNA was detected in the cerebellar cortex in the Purkinje cell layer and also in the lower aspect of the molecular layer (Fig. 3A). Because the large Purkinje cell bodies were devoid of signal, the labeled cells most likely correspond to Bergmann glial cells. To confirm this, we performed immunohistochemical studies both at the light (Fig. 3B–E) and electron microscopy levels (Fig. 3F and G). MLC1 protein was detected in the apical processes of Bergmann glia in the molecular layer (Fig. 3B). Co-labeling with glial fibrillary acidic protein (GFAP) confirmed that MLC1 is expressed in astrocytes (Fig. 3C). In contrast, double immunolabeling for the protein NeuN (a pan-neuronal nuclear marker) (Fig. 3D) or myelin-basic protein (MBP, an oligodendrocyte marker) (Fig. 3E) showed that MLC1 was not expressed in neurons or oligodendrocytes in the cerebellar cortex, respectively. Electron microscopy in the cerebellar cortex confirmed that MLC1 was expressed in astrocytic processes. Interestingly, the strongest immunoreaction was detected in membrane domains between adjacent astrocyte processes (Fig. 3F and G). In some cases (Fig. 3F), MLC1 was located in astrocytes near neurons.
MLC1 was also detected at certain brain barriers. Expression of MLC1 mRNA (Fig. 4A) and protein (Fig. 4B) was very high in ependymal cells surrounding the lateral and third ventricles, which is also consistent with earlier observations (24). MLC1 protein was also concentrated around perivascular and subpial regions, which form the interface between the neuropil and extracerebral liquid spaces. To study the cellular localization of the MLC1 protein in blood vessels, we performed co-localization experiments with GLUT1, an endothelial cell marker (Fig. 4C), and with choline acetyl transferase (CHAT) (Fig. 4D), a neuronal cholinergic marker. No co-localization between MLC1 and these proteins was detected, indicating that MLC1 is not expressed in endothelial cells or in perivascular axons. In contrast, co-localization was observed with GFAP-positive processes surrounding blood vessels (Fig. 4E). Electron microscopic studies confirmed expression of MLC1 in perivascular astrocytic end-feets (Fig. 4F). Again, astrocyte–astrocyte contact regions were intensely labeled (Fig. 4G). Moreover, we observed mRNA hybridization and antibody signals in other small cells throughout the brain, which may correspond to astrocytes because they were also GFAP-positive. This localization arrangement indicates that MLC1 is not expressed in microglia.
In addition to this pattern of labeling, mRNA expression was also detected in neuronal cell bodies of several brain regions, including pyramidal neurons in the neocortex, granule cells in the hippocampus and in several midbrain and brainstem nuclei. ISH double labeling of MLC1 mRNA and the protein NeuN consistently showed that MLC1 mRNA was expressed in neurons (Fig. 5A).
Furthermore, there was also a prominent immunohistochemical staining of particular axonal tracts. In the forebrain, for instance, we found labeling in the neocortical and hippocampal white matter, the olfactory glomeruli, the reciprocal thalamocortical pathway and the corpus callosum. Many other axonal tracts were also labeled in the midbrain and hindbrain (Supplementary Material, Fig. S2).
In the hippocampus, the protein was detected in the molecular layer of the dentate gyrus, and in several layers of the CA3 region (Fig. 5B). Immunohistochemical labeling was prominent in fiber bundles in the stratum lucidum, the mossy fiber layer (Fig. 5C).
To further assess the neuronal expression and localization of MLC1 in the mossy fiber layer, immunofluorescence and electron microscopy studies were performed. In this region, co-immunostainings with the presynaptic marker VAMP2 showed no co-localization (Fig. 5D). This was confirmed by electron microscopy, which detected the MLC1 protein along the mossy fiber axons, but it was absent from the presynaptic, giant mossy boutons (Fig. 5E). These observations indicate domain-specific localization of MLC1 along the mossy fibers.
We also studied in detail the localization of the protein in the cerebral cortex. Here, neuropil staining was most prominent in layers II–III and V (Fig. 5F). In these regions, MLC1-immunoreactivity was found both along axonal processes (Fig. 5G, middle panel) and in presynaptic axon terminals (Fig. 5G, right panels). In addition, we also observed MLC1-positive dendrites in these cortical regions (Fig. 5G, left panel).
Taken together, the present data shows that, in addition to the already reported expression in astrocytes (22), the MLC1 protein is expressed in subsets of neurons and displays a preferential axonal localization.
Reduced expression of MLC1 caused by MLC mutations
MLC1 could be an ion channel. To test this hypothesis, we performed voltage-clamp measurements in MLC1-injected Xenopus oocytes and whole cell patch-clamp measurements in transfected tsA-201 cells, an HEK293-derived cell line. Two different pulse protocols were applied (see Materials and Methods). No ion channel activity was detected. We also used pharmacological agents that increase cytosolic cAMP, but we did not detect ion channel activity attributable to MLC1. Given the similarity of MLC1 with Kv1.1, we also examined whether the protein could modify the activity of this channel. No changes in the conductance or in the voltage dependence of Kv1.1 activation were detected after co-expression with MLC1 (data not shown).
Next, we studied the effect of several MLC mutations (T118M, G212R, S280L and C326R) (in bold in Fig. 6A and B and Supplementary Material, Fig. S1) and the schizophrenia-associated alteration (L309M) (in cursive in Fig. 6A and B and Supplementary Material, Fig. S1) on the basis of two parameters: total and plasma membrane expression. While S280L was found in homozygosis (11), the other mutations were detected in compound heterozygous mode (11,14). For some of the mutations, we employed two expression systems.
The mutations were introduced in human MLC1 containing two HA epitope tags: one in the predicted extracellular loop in order to measure surface expression and a second one in the N-terminal region. The second HA tag was necessary to detect the protein by western blot, because the extracellular tag only proved unfeasible for western blot. We injected cRNA of each mutant into oocytes and measured the amount of protein at the plasma membrane 2 days later (Fig. 6A). After this measurement, the same oocytes were processed to obtain a total extract, and the total amount of each protein was quantified using western blot assays (Fig. 6B).
All MLC mutations (in bold) showed a dramatic decrease in MLC1 expression at the plasma membrane (Fig. 6A). In comparison with the wild-type MLC1 (100%), T118M reduced to 11.4% (n=41), G212R to 7.5% (n=35), S280L to 11% (n=35) and C326R to 6% (n=36). No changes were observed for the schizophrenia-associated amino acid change L309M [97.5% (n=35)]. Western blot analysis of the same oocytes showed lower protein expression in MLC1 protein containing a MLC mutation (Fig. 6B). Interestingly, a clear parallelism between the amount of protein detected by western blot and the plasma membrane levels of the protein was observed. Similarly, no changes in the total amount of protein in comparison with wild-type MLC1 were observed for the L309M amino acid change.
Next, we transiently transfected HeLa cells with the wild-type MLC1 containing two HA epitope tags, as described earlier, and with the amino acid changes S280L, L309M or C326R. Plasma membrane expression was analyzed using luminescence-based methods (Fig. 6C) and total protein expression using western blot assays (Fig. 6D). Co-transfection with GFP (in 1 : 18 proportion) was performed in order to control the level of transfection of each construct. Again, the MLC mutants reduced total and plasma membrane expression levels, whereas the L309M amino acid change did not show any alteration in protein expression. From three independent experiments, the mutant S280L reduced plasma membrane levels to 8% of the wild-type level (n=12), and from two independent experiments, C326R to 3% (n=8). No change was observed for the L309M amino acid change (115% of wild-type, two experiments, n=8). Similar results were found in three independent flow cytometry experiments (see Materials and Methods). Altogether, these results indicate that all the MLC mutations reduced the steady-state levels of MLC1, with an associated decrease in plasma membrane expression.
Decreased stability of the MLC mutant S280L
The above results suggested that the MLC mutations decreased the stability of the encoded mutant protein. We addressed this question for one of the MLC mutations (S280L). We incubated transfected HeLa cells with MLC1 or MLC1 containing the S280L mutation with the protein synthesis inhibitor cycloheximide and monitored the remaining protein by western blot at a range of time points (Fig. 7A). From two experiments, the levels of the mutant 3 h after addition of the inhibitor were 70 and 62% lower than the expression at time zero, whereas the wild-type levels decreased only 4 and 5%.
In addition, we examined the stability of the mutant protein that reached the plasma membrane. After incubating transfected cells with the drug Brefeldin A, which disassembles the Golgi complex and redistributes into the ER (37), we used a luminescence-based assay to measure the amount of protein that remained at the plasma membrane over a range of time points (Fig. 7B). After normalization, the wild-type MLC1 remained at the plasma membrane during the incubation with Brefeldin A, whereas the levels of the mutant S280L were clearly reduced. From two independent experiments (n=8), the levels of S280L were reduced to ∼20% after 6 h of incubation with the drug.
These experiments suggest that the mutant may be a classic folding mutant, similar to ΔF508, the most frequent cystic fibrosis causing mutation of the CFTR protein (38). Treatment of the ΔF508 mouse model with the non-toxic Ca-adenosine triphosphatase pump inhibitor curcumin corrects some defects of the disease (39). We therefore examined whether this drug could also be used for MLC mutations. Indeed, incubation of S280L and wild-type transfected cells with curcumin induced a major increase in the plasma membrane appearance of the S280L mutant protein, as assessed by flow cytometry (Fig. 7C).
DISCUSSION
MLC is a newly described white-matter disorder, characterized by early-onset macrocephaly, mild gross motor developmental delay, ataxia and a late onset of mild mental deterioration. Recessive mutations in the human MLC1 gene cause one form of the disease. Since the identification of this gene in 2001, no studies have addressed the MLC1 protein.
Here we generated polyclonal antibodies against the hydrophilic N-terminal region of mouse MLC1 to study the expression and localization profile of the protein. Localization determined by the antibodies was specific as it strictly correlated with the localization of the corresponding mRNA.
The MLC1 protein is mainly expressed in the brain, in agreement with northern blot data (23). In vivo and in several heterologous systems, using our specific antibody and an N-terminal tagged human MLC1, we detected the protein predominantly at the plasma membrane. Enhanced trafficking assays demonstrated that MLC1 oligomerizes in vivo. The predicted transmembrane domains 4 and 8 contain a segment of several leucine residues. It can be speculated that oligomerization occurs via leucine–leucine interactions, as described for other membrane proteins (40). We also show that MLC1 is not N-glycosylated because its electrophoretic mobility does not change after treatment with EndoF or by mutating the only predicted glycosylation site (NPS). The NPS sequence is not conserved in the MLC1 zebrafish ortholog (Supplementary Material, Fig. S1), and a proline residue in the middle of the motif is not optimal for efficient glycosylation (41).
MLC1 is expressed in astrocytes and ependymal cells, but not in oligodendrocytes or microglia. The expression in astrocytes spans the entire brain, and is localized in the cellular processes of astrocytes present in many gray matter regions, as better observed in Bergmann glia. This pattern of localization indicates that MLC1 protein may be involved in astrocyte function.
Furthermore, MLC1 is concentrated at certain brain barriers (pia mater, ependyma) and around blood vessels, suggesting that it participates in the regulation and/or transport of ions or other substances. For example, it has been described that the AQP4 water channel and the inward rectifier potassium channel Kir4.1, which are also located in astrocyte end-feet, are involved in potassium siphoning coupled to water movement (42). Similarly, MLC1 could be involved in the establishment of osmotic gradients or in capturing ions or neurotransmitters released during neuronal activity (43). Furthermore, MLC1 is concentrated in astrocyte–astrocyte membrane contact regions. The protein could regulate the coupling between astrocytes in processes like intercellular calcium waves, which may occur through these membrane contact regions (44).
MLC1 is not expressed in oligodendrocytes, which implies that the myelination defects observed in MLC patients are not directly related to oligodendrocyte dysfunction. Similar to what happen in Alexander disease (45), it could be that the neuronal defects as well as the myelin alterations are a consequence of an astrocyte dysfunction. However, in the present study we found that MLC1 protein is also expressed in neurons, where it localizes primarily in fibers and axonal tracts. Although the function of MLC1 in axons remains to be determined, the expression of the protein in many myelinated axonal tracts, such as the cortical and hippocampal white matter, indicates that MLC1 dysfunction in axons may account for the myelin defects observed in humans affected by the MLC disorder. Axonal expression of MLC1 in cortical and hippocampal neurons or in astrocytes close to neuronal processes may also support a role in synaptic transmission. In line with this, epilepsy has been found in most of the patients affected by MLC or Alexander disease (21,45).
The low homology to the potassium channel Kv1.1 prompted us to examine whether MLC1 is an ion channel. However, no ion channel activity attributable to the MLC1 protein was detected. This may have been because we did not find the conditions to open the channel, or because another essential subunit was missing. In line with this, some MLC-affected patients do not show linkage with the MLC1 region (25,26). Alternatively, MLC1 could be a transporter or receptor of a yet unidentified substrate/ligand.
The lack of a functional assay to study MLC1 led us to examine MLC and schizophrenia mutations by measuring the protein expression and the amount of protein at the plasma membrane. Interestingly, for all MLC mutations we found a common phenotype: a low steady-state expression of MLC1 with a consequent reduction in surface expression. This observation indicated a reduced half-life of the mutant proteins. Incubation with a protein synthesis inhibitor later confirmed this decrease.
We also studied by incubation with the drug Brefeldin A and measuring the remaining amount of protein at the plasma membrane, whether the small amount of mutant protein that reaches the plasma membrane was also unstable. The results showed that the half-life of the mutant at the plasma membrane was also reduced. For the most common cystic fibrosis causing mutation of CFTR (ΔF508), misfolded proteins on the cell surface are degraded in lysosomes by coordinated function of ubiquitination and the ubiquitin-dependent endosomal sorting machinery (46).
Another amino acid change (L309M) has been related by a single experimental group with another disease, catatonic schizophrenia (20), although other reports state that this is a polymorphism (30–34). A similar amino acid change is present in the ortholog MLC1 proteins from zebrafish, fugu and chicken (Supplementary Material, Fig. S1). Here we show that this amino acid change does not lead to a change in the total or plasma membrane levels of the protein (Fig. 6). However, we cannot exclude that this change in the amino acid affects the function of the protein, although our data indicate, at least, a possible pathogenic mechanism distinct from the MLC mutations studied.
Together, our results indicate that all the MLC mutations studied affect the kinetics of degradation of the MLC1 protein, leading to a reduced protein dosage. Treatment with curcumin was useful for a mouse model of a mutant CFTR with impaired folding (39), and also partially corrects the defect caused by the S280L mutation. Curcumin can be administrated to humans safely. It remains to be established whether this treatment could also be useful for MLC patients harboring other missense mutations in MLC1.
MATERIALS AND METHODS
Antibodies, cell extraction and western blot analysis
Immune sera against two non-overlapping mouse MLC1 synthetic peptides, corresponding to the N-terminal region of the protein (peptide 1: TREGQFREELGYDRM), corresponding to amino acids 2–16 of mouse MLC1 and to the closer sequence (peptide 2: GSYTPDSKPKDLQLS) corresponding to amino acids 32–46 of mouse MLC1, were raised in rabbits and guinea pig using the services provided by EUROGENTEC. The sequences of these two peptides showed no homology with other proteins, but differ between human and mouse in some amino acids (Supplementary Material, Fig. S1). These peptides were coupled to keyhole limpet hemocyanin via a cysteine residue that had been added to their C-terminal region, mimicking its N-terminal position. After three boosts of immunization, the antisera were affinity purified using the two peptides covalently coupled to Sulpho-link (Pierce). The polyclonal antibodies were tested by immunoblotting, immunofluorescence and immunoprecipitation on transfected HeLa cells expressing mouse MLC1 and on non-transfected cells. The same results were obtained using rabbit and guinea pig antibodies.
To obtain crude extracts from rat, tissues were harvested from adult rats, immediately frozen in liquid nitrogen and stored at −80°C. Tissues were then homogenized in eight volumes of buffer 25 mm HEPES, 250 mm sucrose, 4 mm EDTA, 1 mm PMSF and 1× protease inhibitor cocktail (Roche Diagnostics, Germany). The homogenate was centrifuged at 5000g for 10 min at 4°C, followed by 150 000g for 90 min at 4°C.
Proteins were separated on 10% SDS polyacrylamide gels and electrotransferred (BioRad) to PVDF membranes. The membranes were blocked with 5% milk powder in PBS, and probed with the primary antibody indicated by overnight incubation at 4°C. Three washes in PBS–0.1% Triton X-100 of 10 min at RT were performed before incubation with horseradish peroxidase-conjugated anti-rabbit or anti-guinea pig (Jackson ImmunoResearch) that was used as secondary antibodies. After three washes in PBS–0.1% Triton X-100 of 10 min at RT, antigen–antibody complexes were visualized by enhanced chemiluminescence (ECL, Amersham) and exposed on X-ray films.
Immunohistochemistry on brain sections
Adult mice brains were perfused with 4% paraformaldehyde in 0.1 m PBS. The brains were dissected out, postfixed in the same fixative for 48 h and frozen. Free-floating sections (40 µm thick) were rinsed in PBS and endogenous peroxidases were blocked by incubation in 2% H2O2 and 10% methanol. To suppress non-specific binding, the sections were incubated in 0.1 m PBS containing 0.2% gelatine, 10% normal goat serum and 0.5% Triton X-100 for 1 h at RT. The sections were then incubated overnight at 4°C with anti-MLC1 polyclonal antibodies from rabbit (1 : 1000) and guinea pig (1 : 100). Thereafter, sections were incubated with secondary biotinylated antibodies (Vector Laboratories, Inc., Burlingame, CA, USA) for 1 h at RT, and then, with a streptavidin–horseradish peroxidase complex (Amersham) for 2 h at RT. Sections were developed with 0.03% diaminobenzidine and 0.003% hydrogen peroxide, mounted onto slides, dehydrated and coverslipped with DPX. Incubation with non-immunized IgGs and omission of primary antibodies prevented immunostaining.
Free-floating sections from adult mice were also processed by inmunofluorescence. They were rinsed in 0.1 m PBS and blocked in a 10% normal goat serum or fetal bovine serum and 0.1 m PBS containing 0.2% gelatine and 0.5% Triton X-100 for 1 h at RT. The sections were then incubated overnight at 4°C in blocking solution with anti-MLC1 polyclonal antibodies from rabbit (1 : 250) and guinea pig (1 : 250) in combination with the following primary antibodies: rabbit anti-glial fibrillary acidic protein (GFAP) (1 : 400) (Dako A/S, Denmark), goat anti-choline acetyltransferase (CHAT) (1 : 100) (Chemicon International Inc., Temecula, CA, USA), mouse anti-synaptobrevin (VAMP2) (1 : 300) (Synaptic systems, Göttingen, Germany), mouse anti-myelin basic protein (MBP) (1 : 50) (Chemicon), rabbit anti-GLUT1 (1 : 100) (Abcam limited, Cambridgeshire, UK), mouse anti-neuronal nuclei (NeuN) (1 : 75) (Chemicon). Then, they were rinsed with PBS–0.5% Triton X-100 and incubated with secondary fluorescent antibodies (Alexa fluor 488 and 568; Molecular Probes, Inc., Eugene, OR, USA), except for the CHAT antibody, for which an FITC-conjugated swine anti-rabbit (1 : 75) (Dako A/S) and biotinylated horse anti-goat (1 : 100) (Vector Laboratories)/streptavidin texas-red (Molecular Probes) were used. Slices were rinsed with PBS and mounted with Mowiol.
ISH on brain sections
Adult mice forebrains were perfused with 4% paraformaldehyde in 0.1 m phosphate buffer pH 7.4, cryoprotected in a 5% paraformaldehyde–30% sucrose 0.1 m phosphate buffer solution and frozen. Coronal sections (30 µm) were obtained and hybridized as described elsewhere (47). Briefly, sections were deproteinized with 0.2 N HCl for 10 min, acetylated with 0.25% acetic anhydride in 0.1 m triethanolamine buffer pH 8.0, and postfixed in 4% paraformaldehyde for 10 min. Sections were then hybridized with MLC1 riboprobes (full mouse cDNA) labeled with digoxigenin-d-UTP (Boehringer-Mannheim), in a solution containing 50% formamide, 20 mm PIPES, 5× Denhardt's solution, 10% dextran sulfate, 250 µg/ml yeast tRNA, 250 µg/ml salmon sperm DNA, 50 mm DTT, 0.62 m NaCl and 10 mm EDTA, for two overnights at 60°C. Sections were then digested with RNAse A for 1 h at 37°C, and washed in 0.5× SSC/50% formamide at 55°C, and in 0.1× SSC/0.5% sarcosyl at 60°C. After washing, sections were blocked with 10% goat normal serum for 2 h, incubated with an alkaline phosphatase-labeled antidigoxigenin antibody (Roche) 1 : 1500 for 40 h, and developed with a BCPI/NTB substrate. After several washes, sections were mounted onto slides and coverslipped with Mowiol. Sections hybridized with control sense riboprobes did not give any hybridization signal.
After the ISH, some slices were collected and processed by inmunofluorescence. They were rinsed in 0.1 m PBS, blocked in a solution containing 10% normal goat serum, 0.1 m PBS, 0.2% gelatine and 0.5% Triton X-100 for 1 h at RT. The sections were then incubated in blocking solution with the primary antibody against mouse anti-NeuN (1 : 75) (Chemicon) overnight at 4°C. Then, they were rinsed with PBS–0.5% Triton X-100 and incubated with secondary fluorescent antibodies (1 : 100) (Alexafluor 568, Molecular Probes). Finally, slices were washed with PBS and mounted with Mowiol.
Electron microscopy of brain sections
Adult mice were perfused with 4% paraformaldehyde and 0.1% glutaraldehyde in 0.12 m phosphate buffer. Brains were removed from the skull and postfixed with 4% paraformaldehyde in 0.12 m phosphate buffer overnight. Vibratome sections were obtained, blocked with 10% normal goat serum in 0.12 m phosphate buffer for 2 h, and incubated with rabbit antibody against MLC1 (diluted 1 : 750). Primary antibody was detected using a biotinylated goat anti-rabbit secondary antibody (diluted 1 : 200, Vector Laboratories) and the avidin–biotin–peroxidase complex method (ABC; diluted 1:200; Vector Laboratories). After development with 0.05% 3,3′-diaminobenzidine (DAB; Sigma-Aldrich, Milwaukee, WI, USA) and hydrogen peroxide, sections were postfixed with 2% osmium tetroxide, stained with 2% uranyl acetate and embedded in Araldite. Ultrathin sections were collected on formvar-coated slot grids and stained with lead citrate.
Molecular biology
Constructs were made using recombinant PCR and were then sequenced. In human MLC1, an HA epitope was introduced before the last predicted transmembrane domain, resulting in the sequence ‘MFKDYPYDVPDYAPAIK’ (HA epitope in bold). In the N-terminal region of MLC1, an HA epitope ‘AYDRYPYDVPDYAMPTL’ was added (HA epitope in bold). These epitope tags did not affect the subcellular localization of the tagged protein.
Expression in Xenopus oocytes
MLC1 was cloned into the Xenopus expression vector pTLN (48), containing untranslated regions of the β-globin sequence from Xenopus, which increases mRNA stability. Capped complementary RNA of MLC1 was obtained using SP6 polymerase and the mMESSAGE mMachine transcription kit, and expressed in Xenopus oocytes as described (49). Voltage-clamp measurements were done in ND96 medium (96 mm NaCl, 2 mm KCl, 1.8 mm CaCl2, 1 mm MgCl2 and 5 mm HEPES buffer at pH 7.4). Pulse protocols were performed as described elsewhere (48,49).
Patch-clamp analysis
Whole-cell patch-clamp experiments were performed using an EPC-7 amplifier (List, Darmstadt, Germany) and a custom acquisition program interfaced with the National Instruments PCI-6052 board, The solutions had the following composition: the standard intracellular solution contained 130 mm KCl, 2 mm MgCl2, 10 mm HEPES, 2 mm EGTA at pH 7.3; the standard extracellular solution contained 130 mm NaCl, 20 mm KCl, 1 mm MgCl2, 1.8 mm CaCl2, 10 mm HEPES, pH 7.3. Expression of the CLC-1 channel was used as a positive control. Various types of pulse protocols with applied voltages from −140 to +100 mV and pulse durations from 50 ms to 10 s were applied.
Immunofluorescence on transfected HeLa cells and Xenopus oocytes
HeLa cells grown on coverslips were fixed for 20 min with 3% paraformaldehyde in PBS, then washed three times in PBS, incubated 10 min in PBS containing 50 mm NH4Cl, 10 min in PBS containing 20 mm glycine and blocked 30 min with 10% FBS in PBS. Subsequently, coverslips were incubated with primary antibodies (anti-MLC1 1 : 100, anti-HA 1 : 100) diluted in PBS containing 10% FBS for 1 h at RT. After washing in PBS, the cover slips were incubated with 7.5 mg/ml Texas red-conjugated goat anti-mouse (Molecular Probes, Leiden, The Netherlands) at RT for 45 min. The cells were washed three times in PBS prior to mounting in immunofluore medium (ICN Biomedicals Inc., Aurora, OH, USA). The confocal images were obtained using a Leica TCS 4D laser confocal fluorescence microscope with a 63× objective at the Serveis Científico-Tècnics, University of Barcelona.
Groups of four oocytes were prepared for immunofluorescence 3 days after injection of 20 ng of N-HA-human MLC1. The oocytes were placed on a 1 cm2 piece of Whatman 3M paper, embedded in OCT compound (Agar Scientific Ltd, Essex, UK), frozen on dry ice, and stored at −80°C. Sections (15 µm) were mounted on glass slides coated with 0.5% gelatin and dried at 37°C for 10 min. They were then fixed in 3% paraformaldehyde in PBS for 10 min, washed three times in PBS, permeabilized in 1% TX-100 in PBS for 10 min, washed three times in PBS, blocked in 10% FBS in PBS for 30 min and incubated with primary antibody (anti-HA, Babco 1 : 100 in 10% FBS in PBS) for 1 h at RT. Slides were washed three times in PBS, incubated with 7.5 mg/ml Texas red-conjugated goat anti-mouse (Molecular Probes, Leiden, The Netherlands) at RT for 1 h, washed again three times in PBS and mounted in immunofluore (ICN, Madrid, Spain).
Measurement of surface expression (Xenopus oocytes, cells) by luminescence
HA antibodies and chemiluminescence were used to measure surface expression in Xenopus, as previously described (50). Briefly, oocytes were placed in ND96 with 1% BSA for 30 min at 4°C, then incubated with 1 µg/ml rat monoclonal anti-HA antibody (3F10, Roche) in 1% BSA/ND96 for 60 min at 4°C, washed at 4°C and incubated with horseradish peroxidase-coupled secondary antibody (donkey anti-rat IgG, Jackson ImmunoResearch), in 1% BSA for 30–60 min at 4°C). Oocytes were washed thoroughly (1% BSA, 60 min, 4°C) and transferred to ND96 without BSA. Individual oocytes were placed in 50 µl of Power Signal Elisa solution (Pierce). Chemiluminescence was quantified in a Turner TD-20/20 luminometer (Turner BioSystems, Sunnyvale, CA, USA).
Surface expression in transfected mammalian cells was done using the method described by Margeta-Mitrovic (51), with minor modifications. Cells were transfected with calcium phosphate 12 h after plating and assayed 48 h after. The medium was aspirated, and 1 ml of 3% paraformaldehyde in PBS was added and incubated for 20 min at RT. Dishes were washed two times with PBS. Cells were then blocked with 1% FBS in PBS for 30 min, and incubated with 1 ml of 3F10 anti-HA antibody (3F10, Roche) at 0.2 µg/ml in blocking solution for 1 h at RT. Cells were washed six times with blocking solution, and incubated 20 min at RT with 1 ml of a 1 : 1000 dilution horseradish peroxidase-coupled secondary antibody (donkey anti-rat IgG, Jackson Immunoresearch) in blocking solution. Cells were washed four times with blocking solution and eight times with PBS. Luminescence was measured of one dish at a time with 500 µl of Power Signal ELISA solution (Pierce) in the luminometer described earlier.
Flow cytometry
Cells were co-transfected (1 : 18) with GFP, to internally control transfection efficiency. 48 h after transfection, cells were detached using trypsin (1%)-EDTA buffer, harvested by centrifugation and resuspended in 100 µl of cell culture medium per 106 cells. Five microliters of 1 µg/ml rat monoclonal anti-HA antibody (3F10, Roche) was added and incubated for 30 min at 4°C. Cells were washed once in 1 ml of 0.2% FBS in PBS, harvested by centrifugation and resuspended again in 100 µl of cell culture medium. Five microliters of PE-conjugated secondary antibody (goat anti-rat Fab fragments, SEROTEC) was added and further incubated for 30 min at 4°C. Cells were washed once more, harvested and resuspended in 1 ml of cell culture medium. To assess viability, propidium iodide was added to a final concentration of 1 µg/ml immediately before FACS analysis, performed with a Coulter Epics XL using the following filter sets: 550 bandpass (GFP), 575 (PE) and 620/22 (PI). Untransfected cells and unstained transfected cells were used to set the compensation parameters. Data analysis was performed using WinMDI 2.8.
SUPPLEMENTARY MATERIAL
Supplementary Material is available at HMG Online.
ACKNOWLEDGEMENTS
We thank PCB technicians, Anna Orozco, Laura Elia and Marta Camps for technical support and Tanya Yates for editorial help. This study was supported in part by a grant to study neurodegenerative diseases from the Fundació La Caixa (302005) to M.P. and R.E., by the Instituto de Salud Carlos III (networks G03/054 and C03/08), by the Comissionat per a Universitats I Recerca to M.P., by a grant from the Italian Research Ministry (FIRB RBAU01PJMS) to M.P., by SAF20013290 to E.S. and by MCYT EET2002-05149 and MCYT BFI2003-03594 to J.A.d.R. R.E. is a researcher from the Programa Ramón y Cajal of the Spanish Ministry of Science and Technology.
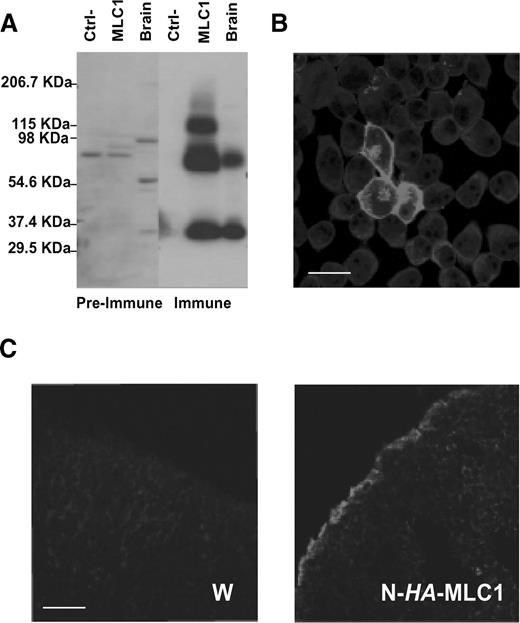
Figure 1. Characterization of MLC1 polyclonal antibodies. (A) Affinity-purified rabbit antibodies against the N-terminal region of MLC1 recognize a ∼32 kDa and a ∼70 kDa band in lysates of HeLa cells transfected with mouse MLC1 cDNA and brain tissue but not in non-transfected cells. An additional band of ∼115 kDa was visible in MLC1-transfected cells, but not in extracts from brain. These bands were not visible using the pre-immune serum. Similar results were obtained using guinea pig affinity-purified antibodies (data not shown). (B) HeLa cells were transfected with pCDNA3-mouse MLC1 together with GFP in a 1 : 18 ratio. After 48 h, MLC1 was immunolocalized with anti-MLC1 polyclonal antibody. GFP fluorescence was used to identify positive transfected cells. The MLC1 immunodetected signal was in the plasma membrane, and inside the cell, most probably in the ER. Bar, 10 µm. (C) Xenopus oocytes were uninjected (W), or injected with 20 ng of human MLC1 containing an HA tag in the N-terminal region. Three days after the injection, oocytes were frozen, sectioned and processed for indirect immunofluorescence using an antibody against the HA epitope as a primary antibody. The micrographs show that MLC1 is visible mainly on the oocyte surface, while no signal was found in uninjected oocytes. These results are representative of two separate experiments. Bar 10 µm.
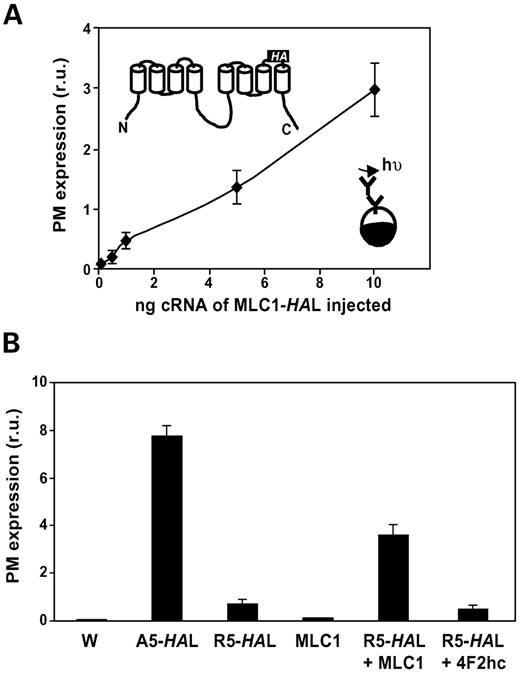
Figure 2. Oligomerization studies of MLC1. (A) Dose-response of MLC1-HAL (containing an HA epitope tag in a predicted extracellular loop, see inset for location of this tag) cRNA injected in Xenopus oocytes and plasma membrane expression. This was quantified using antibody-mediated detection of the extracellular expressed epitope (inset for overview of the method) and subsequent luminometric detection. In the experiment shown here the signal of uninjected oocytes was 42±4 (n=9) and the signal of oocytes injected with 0.1 or 10 ng of MLC1-HAL was 126±16 (n=13) and 3022±433 (n=15), respectively. (B) The trap assay confirms that MLC1 oligomerizes in vivo. Expression of R5-HAL (MLC1 with an HA tag inserted in a extracellular loop and a retention signal, five consecutive arginines, in the N-terminal region) reduced plasma membrane expression, compared with wild-type MLC1 or A5-HAL (MLC1 with an HA tag in a extracellular loop containing five alanines in the N-terminal region). Expression of MLC1 without any tag gave the same signal as uninjected oocytes, but increased the plasma membrane expression of R5-HAL. Oligomerization may mask the retention signal, bringing more R5-HAL to the plasma membrane. Co-expression with an unrelated protein (4F2hc) did not rescue the retention of R5-HAL, indicating that the surface expression detected in the co-expression of R5-HAL with MLC1 without any HA tag, was not due to an overflow of proteins. When not visible, errors are smaller than symbols. Three other independent experiments gave similar results.
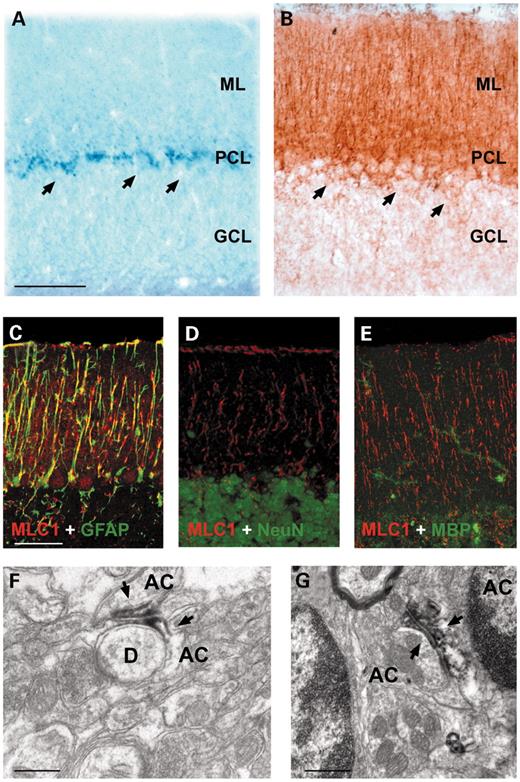
Figure 3. ISH and immunohistochemistry of MLC1 in the cerebellum cortex. Cerebellar sections were processed using ISH (A) or immunocytochemistry (B) using peroxidase-coupled secondary antibodies. The mRNA signal was enriched in the Purkinje cell layer (PCL), but it also protruded into the molecular layer (ML). Arrows indicate Purkinje neurons. (C–E) Confocal images of adult brain mice sections stained with MLC1 (red), GFAP (green, C), a typical astocytic marker, NeuN (green, D), a nuclear neuronal marker, and MBP (green E), an oligodendrocyte marker. No colocalization was detected between NeuN and MBP, indicating that MLC1 is not present in neurons or in oligodendrocytes in the cerebellum cortex. A clear colocalization with GFAP is seen, indicating that MLC1 is present in Bergmann glia. Overlapping expression is shown in yellow. (F, G) Electron micrographs showing the localization of MLC1 in the cerebellum. Arrows indicates peroxidase staining. AC, astrocyte; D, dendrite. These pictures show that MLC1 is located in astrocyte–astrocyte membrane contacts, and sometimes in closer contacts to neuronal processes (F). Bars (A, B) 80 µm; (C, D, E) 50 µm; (F) 0.28 µm; (G) 0.5 µm.
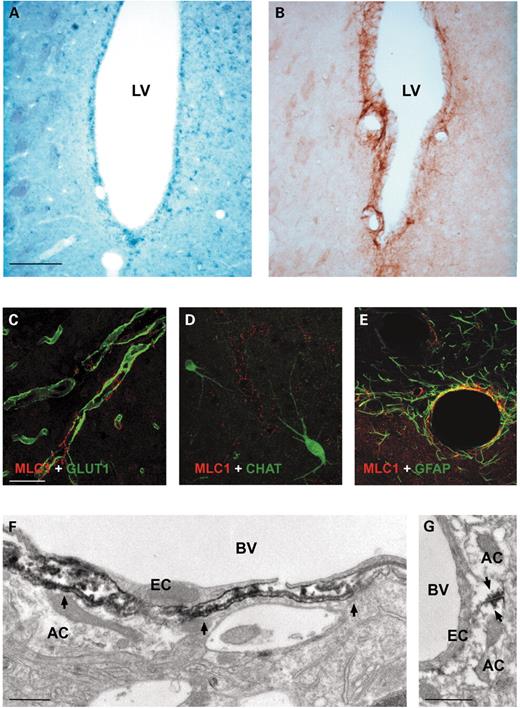
Figure 4. Localization of the MLC1 protein in brain barriers. (A, B) ISH and immunocytochemistry show that MLC1 is expressed in ependymal cells that line the ventricles (LV, large ventricles). These results also illustrate the specificity of the antibody. (C–E) Confocal images of adult brain mice sections stained with MLC1 (red), GLUT1 (green, C), a typical endothelial cell marker, CHAT (green, D), a neuronal cholinergic marker, and GFAP (green, E), an astrocytic marker. No colocalization was detected between GLUT1 and CHAT, indicating that MLC1 is not present in endothelial cells or in perivascular axons. In contrast, immunofluorescence demonstrated that MLC1 (red) is co-expressed with the astrocytic marker GFAP (green) around blood vessels. Overlapping expression is shown in yellow. (F) The ultrastructure around a blood vessel (BV) shows that MLC1 is localized in the astrocytic end-foot (AC) region, indicated by arrows, but not in endothelial cells (EC). (G) Electron micrograph around a blood vessel also indicates that MLC1 is located in astrocyte–astrocyte contact membranes. The peroxidase signal is indicated by arrows. Bars (A, B) 100 µm; (C, D, E) 50 µm; (F) 0.5 µm and (G) 0.5 µm.
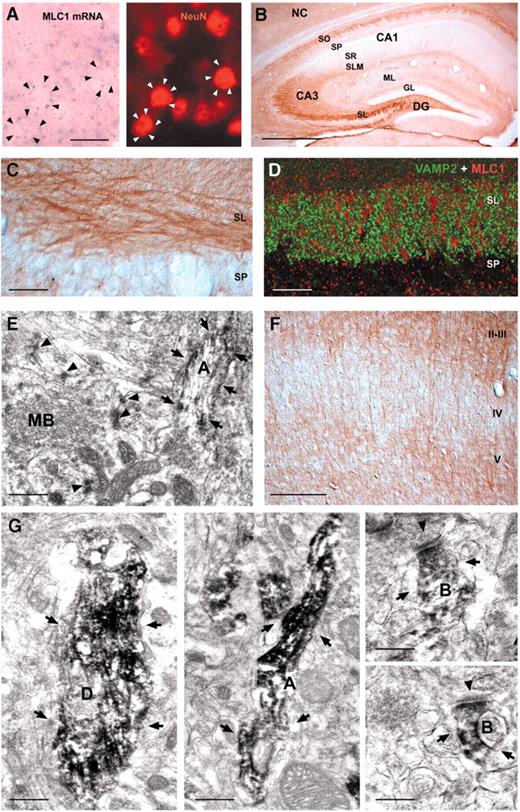
Figure 5. Localization of the MLC1 protein in neurons around the hippocampus and cortex. (A) In the cortex, for instance, the ISH mRNA signal (violet grain) stained neurons (indicated by black arrows). In the same section, and after the ISH experiment, the fluorescent signal of the antibody against NeuN (a pan-neuronal nuclear marker, white arrows) co-localized with the signal of ISH MLC1 mRNA staining. (B) Localization of MLC1 and protein in the hippocampus. DG, dentate gyrus; GL, granular layer; ML, molecular layer; NC, neocortex; SL, stratum lucidum, SLM, stratum lacunosum-moleculare; SO, stratum oriens; SP, stratum pyramidale; SR, stratum radiatum. (C) A detailed view of the localization of MLC1 protein in fiber bundles in the stratum lucidum. The MLC1 antibody signal stained nerve fibers in the SL, whereas a weak signal was detected in the SP. (D) A confocal image in the SL region showed no co-localization of VAMP2 (a typical synaptic bouton marker, in green) with MLC1 (in red). (E) Electron micrograph corresponding to a transversal section in the SL in the hippocampus. The peroxidase stain (arrows) labeled an axon main body (A), whereas no signal was seen in the rising mossy bouton of the same axon (MB). Arrowheads indicate regions of synaptic contacts. (F) Expression of the MLC1 protein in the cortex was highest in the II–III and the V layer. (G) Electron microscopy micrographs corresponding to the cortex region. The peroxidase stain (arrows) was detected in dendrites (D, left panel), axons (A, middle panel) and presynaptic boutons (B, right panels). The arrowheads indicates the electrodense postsynaptic membrane. Bars (A) 16 µm; (B) 366 µm; (C) and (D) 25 µm; (E) 0.5 µm; (F) 188 µm; (G) 0.5 µm (left panel), 0.28 µm (middle panel), 0.25 µm (right panel, top); 0.25 µm (right panel, bottom).
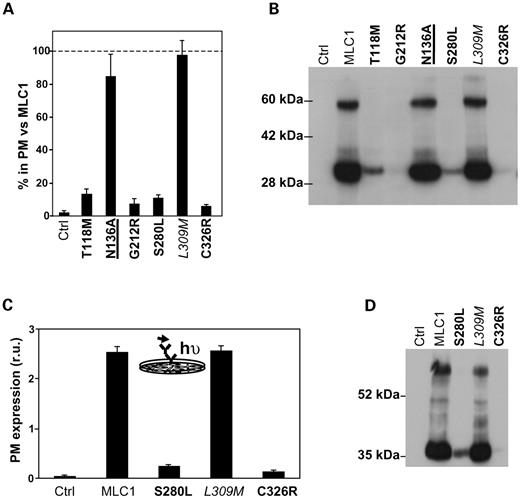
Figure 6. Studies of MLC mutants in Xenopus oocytes and HeLa cells. (A) Plasma membrane levels of some MLC mutations, the amino acid change L309M and the presence of a putative glycosylation site. Oocytes were injected with 10 ng of each cRNA construct, and the plasma membrane levels were measured using a luminescence-based method. The signal of uninjected oocytes was always 5% below the signal of MLC1-HAL-injected oocytes. Surface expression was normalized with the expression levels of MLC1 wild-type. The result corresponds to a summary of four independent experiments (n≫35) with two distinct preparations of cRNA. (B) Western blot analyses of the same oocytes studied in (A) show that the protein steady-state levels is reduced in MLC1-HAL containing MLC mutations (bold), but not in the mutation of the only putative glycosylation site N136A (underlined) or the amino acid change L309M (cursive). Two other independent experiments gave similar results. (C) Plasma membrane analysis using luminescence-based methods in HeLa cells transfected with wild-type MLC1 or with the amino acid changes S280L, L309M and C326R. The result corresponds to a single experiment (n=4). Another independent experiment gave similar results. (D) An extract from these transfected cells was obtained and analyzed by western blot. The results show a reduced protein steady-state levels for MLC containing mutations S280L and C326R, but not for the amino acid change L309M. Another independent experiment gave similar results.
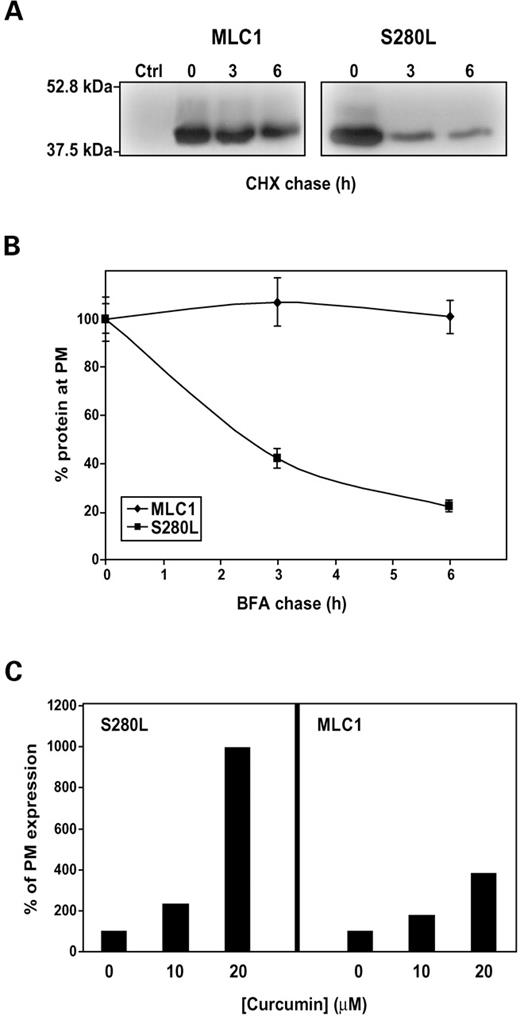
Figure 7. Decreased stability of MLC1 caused by mutation S280L. (A) Transfected HeLa cells with MLC1 or S280L MLC1 containing HA tags were incubated 24 h after transfection with the protein synthesis inhibitor cycloheximide (5 µg/ml) for the times indicated (0, 3 and 6 h). Cells were harvested, solubilized and processed by western blot against the HA epitope. The exposure time for the S280L mutation was higher than the wild-type MLC1, in order to show clearly the decrease after the incubation with cycloheximide in the S280L mutation. Another independent experiment gave similar results (B) 24 h after transfection, cells were incubated with Brefeldin A (5 µg/ml), which disassembles the Golgi complex. At a range of time points, cells were washed and fixed. Plasma membrane levels were then determined using a luminescence-based method. The signal was normalized to the value at time 0 for each of the groups (wild-type or S280L). The result is a representative experiment of two independent experiments. (C) Transfected wild-type or S280L HeLa cells were treated 24 h after transfection with curcumin (10 or 20 µm) for 16 h. Cells were detached and plasma membrane expression was measured by flow cytometry. 12 000 cells were studied in every experiment. Data was analyzed using WinMDI2.8. The result is a typical experiment (n=2) showing the percentage of mean PE fluorescence corrected by the signal without curcumin addition. The augment in surface expression of S280L-MLC1 after treatment with curcumin is much higher that the one seen in wild-type MLC1.
References
Van Der Knaap, M.S., Valk, J., Barth, P.G., Smit, L.M., van Engelen, B.G. and Tortori, D.P. (
Van Der Knaap, M.S., Barth, P.G., Stroink, H., van Nieuwenhuizen, O., Arts, W.F., Hoogenraad, F. and Valk, J. (
Singhal, B.S., Gursahani, R.D., Udani, V.P. and Biniwale, A.A. (
Brockmann, K., Finsterbusch, J., Terwey, B., Frahm, J. and Hanefeld, F. (
De Stefano, N., Balestri, P., Dotti, M.T., Grosso, S., Mortilla, M., Morgese, G. and Federico, A. (
Sener, R.N. (
Van Der Knaap, M.S., Barth, P.G., Vrensen, G.F. and Valk, J. (
Topcu, M., Gartioux, C., Ribierre, F., Yalcinkaya, C., Tokus, E., Oztekin, N., Beckmann, J.S., Ozguc, M. and Seboun, E. (
Topcu, M., Saatci, I., Topcuoglu, M.A., Kose, G. and Kunak, B. (
Leegwater, P.A., Yuan, B.Q., van der Steen, J., Mulders, J., Konst, A.A., Boor, P.K., Mejaski-Bosnjak, V., van der Maarel, S.M., Frants, R.R., Oudejans, C.B. et al. (
Tsujino, S., Kanazawa, N., Yoneyama, H., Shimono, M., Kawakami, A., Hatanaka, Y., Shimizu, T. and Oba, H. (
Ben Zeev, B., Levy-Nissenbaum, E., Lahat, H., Anikster, Y., Shinar, Y., Brand, N., Gross-Tzur, V., MacGregor, D., Sidi, R., Kleta, R., Frydman, M. and Pras, E. (
Leegwater, P.A., Boor, P.K., Yuan, B.Q., van der Steen, J., Visser, A., Konst, A.A., Oudejans, C.B., Schutgens, R.B., Pronk, J.C. and Van Der Knaap, M.S. (
Gorospe, J.R., Singhal, B.S., Kainu, T., Wu, F., Stephan, D., Trent, J., Hoffman, E.P. and Naidu, S. (
Browne, D.L., Gancher, S.T., Nutt, J.G., Brunt, E.R., Smith, E.A., Kramer, P. and Litt, M. (
Dutzler, R., Campbell, E.B., Cadene, M., Chait, B.T. and MacKinnon, R. (
Fu, D., Libson, A., Miercke, L.J., Weitzman, C., Nollert, P., Krucinski, J. and Stroud, R.M. (
Meyer, J., Huberth, A., Ortega, G., Syagailo, Y.V., Jatzke, S., Mossner, R., Strom, T.M., Ulzheimer-Teuber, I., Stober, G., Schmitt, A. and Lesch, K.P. (
Yalcinkaya, C., Yuksel, A., Comu, S., Kilic, G., Cokar, O. and Dervent, A. (
Mulley, J.C., Scheffer, I.E., Petrou, S. and Berkovic, S.F. (
Nomura, N., Miyajima, N., Sazuka, T., Tanaka, A., Kawarabayasi, Y., Sato, S., Nagase, T., Seki, N., Ishikawa, K. and Tabata, S. (
Schmitt, A., Gofferje, V., Weber, M., Meyer, J., Mossner, R. and Lesch, K.P. (
Blattner, R., Von Moers, A., Leegwater, P.A., Hanefeld, F.A., Van Der Knaap, M.S. and Kohler, W. (
Patrono, C., Di Giacinto, G., Eymard-Pierre, E., Santorelli, F.M., Rodriguez, D., De Stefano, N., Federico, A., Gatti, R., Benigno, V., Megarbane, A. et al. (
Mirnics, K. and Lewis, D.A. (
Rubie, C., Lichtner, P., Gartner, J., Siekiera, M., Uziel, G., Kohlmann, B., Kohlschutter, A., Meitinger, T., Stober, G. and Bettecken, T. (
Bettecken, T., Rubie, C., Lichtner, P., Siekiera, M., Meitinger, T. and Stober, G. (
Leegwater, P.A., Boor, P.K., Pronk, J.C. and Van Der Knaap, M.S. (
McQuillin, A., Kalsi, G., Moorey, H., Lamb, G., Mayet, S., Quested, D., Baker, P., Curtis, D. and Gurling, H.M. (
Devaney, J.M., Donarum, E.A., Brown, K.M., Meyer, J., Stober, G., Lesch, K.P., Nestadt, G., Stephan, D.A. and Pulver, A.E. (
Ewald, H. and Lundorf, M.D. (
Jorgensen, T.H., Borglum, A.D., Mors, O., Wang, A.G., Pinaud, M., Flint, T.J., Dahl, H.A., Vang, M., Kruse, T.A. and Ewald, H. (
Torrents, D., Estévez, R., Pineda, M., Fernandez, E., Lloberas, J., Shi, Y.B., Zorzano, A. and Palacin, M. (
Schwappach, B., Zerangue, N., Jan, Y.N. and Jan, L.Y. (
Chardin, P. and McCormick, F. (
Egan, M.E., Pearson, M., Weiner, S.A., Rajendran, V., Rubin, D., Glockner-Pagel, J., Canny, S., Du, K., Lukacs, G.L. and Caplan, M.J. (
Gurezka, R., Laage, R., Brosig, B. and Langosch, D. (
Apweiler, R., Hermjakob, H. and Sharon, N. (
Nagelhus, E.A., Horio, Y., Inanobe, A., Fujita, A., Haug, F.M., Nielsen, S., Kurachi, Y. and Ottersen, O.P. (
Auld, D.S. and Robitaille, R. (
Newman, E.A. (
Mignot, C., Boespflug-Tanguy, O., Gelot, A., Dautigny, A., Pham-Dinh, D. and Rodriguez, D. (
Sharma, M., Pampinella, F., Nemes, C., Benharouga, M., So, J., Du, K., Bache, K.G., Papsin, B., Zerangue, N., Stenmark, H. and Lukacs, G.L. (
Alcantara, S., de Lecea, L., Del Rio, J.A., Ferrer, I. and Soriano, E. (
Estévez, R., Schroeder, B.C., Accardi, A., Jentsch, T.J. and Pusch, M. (
Estévez, R., Boettger, T., Stein, V., Birkenhager, R., Otto, E., Hildebrandt, F. and Jentsch, T.J. (
Zerangue, N., Schwappach, B., Jan, Y.N. and Jan, L.Y. (
