


Abstract
Asthma is a familial inflammatory disease of the airways of the lung. Microbial exposures in childhood protect against asthma through unknown mechanisms. The innate immune system is able to identify microbial components through a variety of pattern-recognition receptors (PRRs). NOD1 is an intracellular PRR that initiates inflammation in response to bacterial diaminopimelic acid (iE-DAP). The NOD1 gene is on chromosome 7p14, in a region that has been genetically linked to asthma. We carried out a systematic search for polymorphism in the gene. We found an insertion–deletion polymorphism (ND1+32656) near the beginning of intron IX that accounted for ∼7% of the variation in IgE in two panels of families (P<0.0005 in each). Allele*2 (the insertion) was associated with high IgE levels. The same allele was strongly associated with asthma in an independent study of 600 asthmatic children and 1194 super-normal controls [odds ratio (OR) 6.3; 95% confidence interval (CI) 1.4–28.3, dominant model]. Differential binding of the two ND1+32656 alleles was observed to a protein from nuclei of the Calu 3 epithelial cell line. In an accompanying study, the deletion allele (ND1+32656*1) was found to be associated with inflammatory bowel disease. The results indicate that intracellular recognition of specific bacterial products affects the presence of childhood asthma.
INTRODUCTION
Asthma has shown a dramatic increase in prevalence in the last century in urban and westernized societies, and it has been suggested that microbial exposure in childhood may protect against the development of disease (1,2). This hypothesis is supported by the observation that children who grow up on a farm have a strongly reduced risk of developing asthma (3). Endotoxin (bacterial lipopolysaccharide) and peptidoglycan (PGN) are components of bacterial surfaces that have been used as markers for this bacterial exposure, but the exact factors protecting against disease are unknown.
As part of a study of candidate genes in regions of genetic linkage, we have recognized that the pattern-recognition receptor (PRR) NOD1/CARD4 is on chromosome 7p14, within 5 Mb of the previously reported peak of genetic linkage (4–6). Mutations in the related gene NOD2 have been shown to predispose to Crohn's disease (7,8) and asthma (9).
The NOD1 protein contains an N-terminal caspase-recruitment domain (CARD), a centrally located nucleotide-binding oligomerization domain (NOD) and a domain consisting of multiple leucine-rich repeats. The leucine-rich region (LRR) acts as a pattern recognition receptor (PRR) for bacterial PGN which contains diaminopimelic acid (iE-DAP) (10). iE-DAP is present in a subset of bacteria that include Gram-negative bacilli and particular Gram-positive bacteria such as Bacillus subtilis and Listeria monocytogenes (10). Activation of NOD1 induces NF-6B activation with subsequent inflammatory cytokine transcription (11).
RESULTS
We carried out a systematic search for the presence of polymorphic variants by the direct sequencing of the 14 exons and the exon–intron boundaries of NOD1 and the interrogation of public databases. We then genotyped the polymorphisms in two panels of families (AUS1 and UK1).
NOD1 polymorphisms (Fig. 1A) were first tested for association with loge IgE in the AUS1 families (described in Materials and Methods). No associations were found with coding SNPs, but several non-coding polymorphisms showed strong associations (Bonferroni corrected P-value for all tests=0.006) (Table 1). The strongest association in both panels was to the insertion allele of the indel (ND1+32656*2), 34 bp from the intron IX–exon IX boundary. This polymorphism accounted for 6.7% of the variance of the total serum IgE in the AUS1 panel. Testing of the same polymorphism in the UK1 panel showed a similar level of significance and a contribution of 6.6% to the variance of the total serum IgE.
Inclusion of ND1+32656 as a covariate in the analysis in the AUS1 panel still left a significant association to ND1+27606 (P=0.04, variance=1.6%), indicating the presence of other functional polymorphisms in the gene. In order to test whether the polymorphisms were determining the response to major allergens, we tested for association to the serum IgE titres specific to Der p I, Der p II, Fel d I and Phl p V, which had been measured in the AUS1 panel. Although weak associations (P=0.05–0.01) were seen between each of the antigens and the ND1+32656 indel, these associations were abolished by the inclusion of total serum IgE as a covariate, indicating that the locus was not modulating the total serum IgE through an allergen-specific mechanism.
The power to detect association to asthma in the family panels was limited by the informativeness of the markers and the number of asthmatic children. However, ND1+32656*2 showed association to asthma in the AUS1 panel [P=0.02 by the Monk's transmission disequilibrium test (TDT)] and the ND1+18915*1 and ND1+27606*2 SNPs were associated to asthma in the UK1 panel (P=0.02 and P=0.01, respectively).
Linkage disequilibrium (LD) between markers was irregular, but ND1+18915 and ND1+21658 were in strong LD, limiting the ability to determine whether associations to them indicate independent effects (Fig. 1B). The ND1+32656 indel was in moderate LD with the neighbouring ND1+27606 SNP, but in weaker LD with the other SNPs (Fig. 1B). Construction of two, three and four marker haplotypes in a sliding window across the gene showed significant evidence for association that did not increase beyond that seen for ND1+32656.
In order to test for association to asthma with greater power, we investigated an independent panel of 600 asthmatic children and 1194 super-normal controls. Logistic regression analyses indicated that ND1+21658 was significantly associated with asthma (Table 2): weaker independent associations were observed with ND1−664, ND1+233 and ND1+18915.
IgE levels dichotomized above and below the 50th percentile in the case–control panel showed significant association to the ND1+18915 and ND1+27606 SNPs and weak association to ND1−664. These same three SNPs had shown association to IgE levels in the family panels.
Additional testing under a dominant model indicated that the ND1+32656*2 indel was strongly associated with asthma [odds ratio (OR)=6.30; 95% confidence interval (CI) 1.40–28.3, 0.01<P<0.05] and IgE levels above the 50th percentile [OR 5.40; 95% CI 1.15–25.3, 0.01<P<0.05). The indel effects were even stronger for IgE above the 90th percentile (OR 18.4; 95% CI=2.29–147.6, P<0.01). The other polymorphisms did not show dominance (Table 2).
We inspected the polymorphic sequences for potential binding factor sites, but observed no significant associations. However, as our results indicated that the ND1+32656 indel was of particular importance, we examined it for differential binding of potential regulatory factors by electrophoretic mobility shift assay (EMSA). Strong binding to the insertion allele (ND1+32656*2) by an unidentified nuclear protein was observed in the Calu 3 lung adenocarcinoma cell line (Fig. 1C): much weaker binding was observed to the deletion polymorphism (ND1+32656*1). These results were replicated in repeat experiments. Binding to either allele was not observed in the Daudi B-cell line.
As several of the SNPs showing positive associations to IgE and asthma were close to intron–exon boundaries (Fig. 1A), we examined NOD1 for splice variants by RT–PCR covering the CARD, NOD and LRR domains in RNA from different tissues.
The CARD domain was constant. A splice variant in the NOD domain in which exon VI was split in two was ubiquitously expressed (data not shown).
The pattern-recognition LRR domain contained multiple splice variants, the relative concentration of which differed between tissues (Fig. 2A). Sequencing identified an open reading frame containing all exons between VI and XIV (NOD1–LRRα), a variant excluding exon X (NOD1–LRRβ), a variant excluding exons X and XI (NOD1–LRRδ) and a variant excluding exons X–XII (NOD1–LRRγ) (Fig. 2A and B). Translation of these would result in proteins containing 10, 9, 8 and 7 leucine loops, respectively (Fig. 2B). The NOD1-LRRβ variant was present in most tissues, whereas the NOD1–LRRγ variant was generally weakly expressed or absent. NOD1-LRRδ was expressed at high levels in several tissues including the lung, spleen, thymus and intestine (Fig. 2A).
DISCUSSION
The results show strong associations between NOD1 polymorphism and the presence of asthma and elevated IgE levels in three independent panels of subjects.
The indel ND1+32656 polymorphism accounted for ∼6.5% of the variance of the total serum IgE in the family panels. The magnitude of this effect is in contrast to the 2% variation attributable to recognized loci such as the major histocompatability complex (MHC) (12). The results also indicated that the locus was not modulating the total serum IgE through an allergen-specific mechanism. This is consistent with observations that the average proportion of the total serum IgE directed against known allergens is <1% (13), and that elevation of the total serum IgE predicts asthma independently of the presence or absence of allergen-specific IgE (14).
The NOD1–LRR is located within the cytosol and is activated by iE-DAP from the walls of certain bacteria (10,15). Our results therefore suggest that the cytosolic recognition of bacterial or other unknown antigens has significant effects on the total serum IgE concentration and on the presence of asthma. This is consistent with findings that CD14 variants are associated with total serum IgE levels (16) and supports the hypothesis that the primary mucosal reaction to allergens or bacterial proteins may be mediated through the PRRs of the innate immune system. It is not clear whether such effects might be inhibitory through ‘immune deviation’ of the developing immune system (17) or whether different NOD1 variants directly modify asthmatic epithelial inflammation through recognition of as yet unrecognized microbial agents or products.
Variation in number of LRR repeats is a recognized mechanism for altering the specificity of activation by particular pathogen-associated molecular patterns (PAMPs) in plants (18,19). Further studies are now required to demonstrate whether ND1+32656 or other polymorphisms in NOD1 modify the expression of particular splice variants or whether the effects on asthma and IgE are due to other mechanisms.
Asthmatic inflammation is frequently considered to be driven by a Th2 immune bias, and Th1 excess has been implicated in Crohn's disease (20). The different associations between ND1+32656*2 and asthma and ND1+32656*1 and inflammatory bowel disease (21) may indicate that this bias arises, in part, at the level of PAMP recognition by the innate immune system.
MATERIALS AND METHODS
Subjects and phenotypes: families
Two panels of families were studied. The AUS1 panel consisted of 80 nuclear families sub-selected to be informative for atopy from a randomly ascertained Australian population sample of 230 families (4,22). The panel contained a total of 203 offspring. Twelve percent of the children were asthmatic. The UK1 panel consisted of 77 nuclear and extended families recruited from asthma and allergy clinics in the UK (4). These families contained 215 offspring, of which 56% were asthmatic. Ethical approval for the study was given by local ethics committees, and written informed consent was obtained from all subjects or their parents. The 50th, 66th and 90th percentiles for the total serum IgE concentrations were 39, 81 and 399 IU/l in the AUS1 panel and 84, 190 and >1000 in the UK1 panel, respectively.
The subjects were administered a standard respiratory questionnaire (22) based on the ATS questionnaire. ‘Asthma’ was defined as a positive answer to the questions ‘Have you ever had an attack of asthma’? and ‘If yes, has this happened on more than one occasion’? This corresponded closely (>95%) to the answer to the question ‘Has your doctor ever told you that you have asthma’?
Blood was taken by venipuncture for IgE assays and DNA studies. The total serum IgE was determined (Pharmacia CAP system FEIA, Sweden). Sera were tested for elevation of IgE titres to the major allergens Der p I and Der p II (from the house dust mite Dermatophagoides pteronyssinus) and Fel d I (from the domestic cat, Felix domesticus) by chemiluminescence assay using monoclonal anti-IgE (ALK Laboratories, Hørsholm, Denmark). Results were converted to RAST classes.
Subjects and phenotypes: cases and controls
Subjects were taken from cross-sectional studies to assess the prevalence of asthma and allergies in schoolchildren aged 9–11 between 1995 and 1996, which were conducted in Munich, southern Germany, and in Dresden and Leipzig, eastern Germany (23). Informed written consent was obtained from all parents, and all study methods were approved by the Ethics Committee of the University of Münster (Coordination and Data Centre), Leipzig, Dresden and Munich. No significant differences among study populations from the various cities were found with respect to population characteristics (24).
Serum IgE concentration was measured using the Insulite system (DPC Biermann, Bad Nauheim, Germany). On the basis of the existing IgE measurements in our data set of all available German study subjects in the age of 9–11 years (n=3063), IgE percentiles were calculated and the 50th percentile (60.4 IU/ml), 66th percentile (115 IU/ml) and 90th percentile (457 IU/ml) for total serum IgE were used as outcome variables.
Parental questionnaires for self-completion were sent through the schools to the families. Children whose parents reported a doctor's diagnosis of asthma, recurrent spastic bronchitis or recurrent asthmatic bronchitis were classified as having asthma.
All children who had a doctor's diagnosis of asthma or bronchial hyper-responsiveness or both (n=671; Munich n=264, Dresden n=276, Leipzig n=131) were selected from the total study population. These children were matched at a 1 : 2 ratio with a random selection of healthy, non-asthmatic, non-atopic children (n=1342: Munich n=528, Dresden n=552, Leipzig n=262) (24). For the purpose of the current study, only children of German origin who had both DNA and IgE data available were included (n=1872: Munich n=690, Dresden n=789, Leipzig n=393), with a resulting total of 600 asthmatics and 1194 super-normal controls.
SNP identification
A systematic search for presence of polymorphic variants was carried out by the direct sequencing of the 14 exons and the exon–intron boundaries of NOD1 in five asthmatic and seven normal people (i.e. 24 haploid genomes), giving a 95% probability of identifying polymorphisms with an minimum frequency of 0.05 (25). Sequences were compared with POLYPHRED and PHRAP. Public databases were also interrogated, in particular the innate immunity website www.innateimmunity.net. The primers are available in Supplementary Material. Polymorphisms with a minimum minor allele frequency of 5% were included into the study.
Genotyping
Twelve SNPs were typed using MassExtend™, a MALDI-TOF high-throughput genotyping system supplied by Sequenom, San Diego, CA, USA. Primer details are given in Supplementary Material. The insertion–deletion polymorphism was genotyped in the UK subjects using an amplification refractory mutation system assay (primer details in Supplementary Material) in the family panels and by the Sequenom system in the German subjects.
Statistics
Association to quantitative traits was carried out by variance components analyses of all family members using the QTDT statistical package (26). The total serum IgE concentration was adjusted for age and sex and log transformed for analyses as previously described (27). Association to categorical traits was examined by the Monk's TDT (28) implemented in QTDT. Haplotypes were generated by MERLIN (29) and after recoding as individual alleles examined for association with QTDT. The patterns of LD between markers were visualized using GOLD (30).
Association to binary outcomes in the case–control population was examined by logistic regression (SAS version 8.2), with OR calculated for the trend [outcome versus genotype (homozygotes *1*1=1, heterozygotes *1*2=2, homozygotes *2*2=3)]. Potential dominance effects were investigated as described (31). Markers not in Hardy–Weinberg equilibrium were dropped from the analyses.
Potential binding sites for transcription factors were identified on forward and backward strands of genomic DNA using the MatInspector programme (32) (www.genomatix.de).
Electrophoretic mobility shift assays
Four oligonucleotides corresponding to sense and anti-sense strands of each ND1+32656 allele (Supplementary Material) were heated in pairs in a 1 : 1 mixture at 95°C. The resulting dsDNAs were 3′ DIG labelled according to manufacturer's instructions (Roche DIG Gel Shift Kit, 2nd Generation) and after standardization, probes were diluted to a concentration of 15–30 fmol/l. Probes were mixed with nuclear protein extracts from the Calu 3 and Daudi cell lines from the ATCC (33). Controls to demonstrate specificity of binding were included with unlabelled dsDNA at 75×, 150× and 200× added to the mix. Products were separated by electrophoresis on 6% polyacrylamide gels. Complexes were transferred to nylon membranes by electroblotting, hybridized with anti-DIG antibodies and visualized with the CSPD chemiluminescent substrate and autoradiography, according to the manufacturer's instructions.
Splice variants
Three primer pairs were designed to amplify mRNA approximating to the CARD, NOD and LRR domains (primers given in Supplementary Material). NOD1 mRNA expression in different tissues was studied using multiple tissue cDNA human panels supplied by BD Biosciences. Different splicing variants were separated by gel electrophoresis, and the corresponding bands were cut from the gels and sequenced.
The structure of the splice variants was investigated using a threading model (34).
SUPPLEMENTARY MATERIAL
Supplementary Material is available at HMG Online.
ACKNOWLEDGEMENTS
We are grateful to the people of Busselton and to the Busselton Foundation for their participation in the study. P.H. is the grateful recipient of a Victor Blank scholarship. The study was funded by the Wellcome Trust.
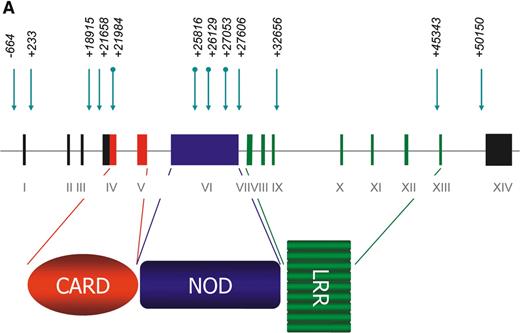
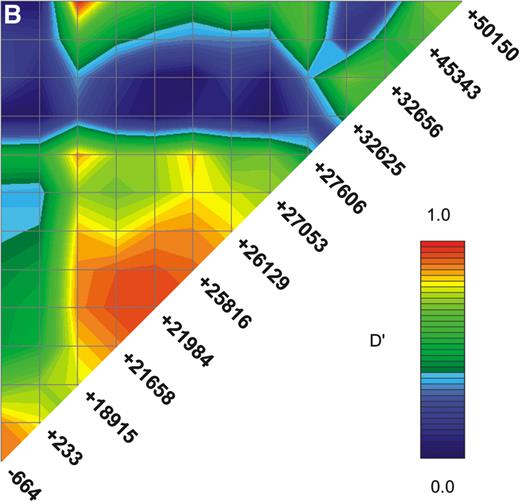
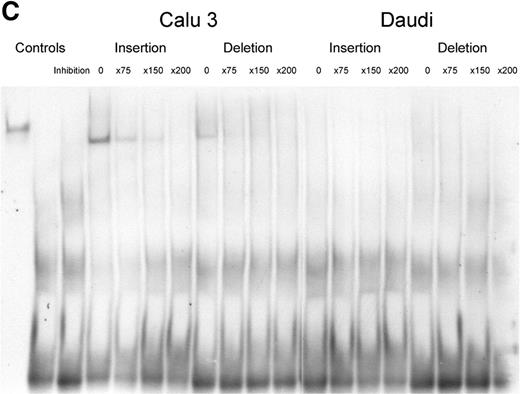
Figure 1. (A) The NOD1 gene and protein. The NOD1 gene extends over 55 Kb of genomic DNA and contains 14 exons. A 5′ untranslated region (UTR) is found within exons I–III and the start of exon IV and a 3′ UTR is held within exon XIV. The NOD1 protein is made of 965 amino acids and contains an N-terminal CARD (in red), a centrally located NOD (in blue) and multiple C-terminal LRRs (in green). The presence of genomic polymorphisms is indicated by arrows above the line. Round-tailed arrows indicate exonic SNPs. All of these except the ND1+32656 indel have now been described in public databases (www.innateimmunity.net). (B) LD between NOD1 polymorphisms. The marker positions are shown along the diagonal of the figure. Pairwise estimations of D′ are shown from unrelated subjects (the parents), on a scale from 1 (complete LD: red) to 0 (blue). Marker positions are shown as a schematic rather than as actual distances apart. (C) EMSAs for alleles of the ND1+32656 indel polymorphism. Oligonucleotides corresponding to the insertion and deletion variants of ND1+32656 were incubated with nuclear extracts from the Calu 3 epithelial cell and Daudi B-cell lines and size-separated on polyacrylamide gel. A protein is shown to bind with greater activity to the insertion variant in the Calu 3 cells: specificity of binding is demonstrated by inhibition with the addition of progressive concentrations of unbound oligonucleotide. No binding is seen in the control Daudi B-cell line.
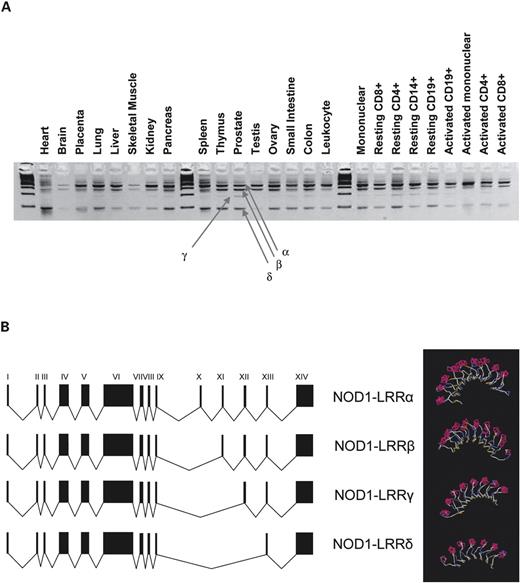
Figure 2. Splice variants of the NOD1 LRR pattern receptor domain. (A) Amplification of the LRR domain (exons IX–XIV) in cDNA from a panel of multiple tissues. Multiple splice variants are observed (NOD1–LLRα, β, γ and δ), with varied expression in different tissues. Unlabelled lanes contain standard size markers. (B) Exonic structure of common splice variants: progressive deletion of exons X, XI and XII is observed. Structural models of LRR variants are shown to the right and demonstrate progressive loss of leucine loops of the receptor region of the protein.
Association of NOD1 polymorphisms to age and sex adjusted total serum IgE concentrations in two panels of families
| Polymorphism | P-value | |||
|---|---|---|---|---|
| Position IDa | Database ID | Frequencyb | AUS 1 Panel | UK1 Panel |
| ND1−664 | rs2736726 | 0.72 | — | — |
| ND1+233 | rs2075817 | 0.74 | — | — |
| ND1+18915 | rs2975632 | 0.79 | 0.02 | 0.08 |
| ND1+21658 | rs3020207 | 0.72 | — | — |
| ND1+21984 | rs2075818 | 0.76 | — | — |
| ND1+25816 | rs2235099 | 0.76 | — | — |
| ND1+26129 | rs3020208 | 0.77 | — | — |
| ND1+27053 | rs2075821 | 0.81 | — | — |
| ND1+27606 | rs2075822 | 0.80 | 0.006 | 0.07 |
| ND1+32656c | — | 0.76 | 0.0002 | 0.0005 |
| ND1+45343 | rs2907748 | 0.78 | — | 0.04 |
| ND1+50150 | rs5743368 | 0.87 | — | — |
aThe position is numbered from the first nucleotide of exon I. The sequence was obtained from Golden Path (http://genome.ucsc.edu), version September 2002.
bAllele *1 is defined as the more common form (from AUS1 panel).
cComplex insertion–deletion polymorphism (indel), partially identified as rs6958571.
Association of NOD1 polymorphisms to asthma and total serum IgE concentrations in cases with childhood asthma and controls
| Polymorphism | Frequencies | OR (95% CI) | |||||
|---|---|---|---|---|---|---|---|
| Position ID | Database ID | Casesa | Controls | Asthma | Serum IgE >50% | ||
| Standard | Dominanceb | Standard | Dominanceb | ||||
| ND1−664 | rs2736726 | 0.745 | 0.744 | 0.41 (0.17–1.03)* | 1.27 (0.42–3.80) | 0.40 (0.16–1.03)* | 0.87 (0.24–3.18) |
| ND1+233 | rs2075817 | 0.733 | 0.738 | 2.18 (0.86–5.47)* | 0.63 (0.21–1.9) | 2.12 (0.82–5.47) | 1.09 (0.30–4.0) |
| ND1+18915 | rs2975632 | 0.791 | 0.799 | 2.27 (0.92–5.61)* | 1.58 (0.52–4.82) | 6.09 (2.01–18.5)*** | 1.51 (0.44–5.18) |
| ND1+21658 | rs3020207 | 0.706 | 0.723 | 1.80 (1.02–3.12)** | 1.39 (0.68–2.84) | 1.42 (0.79–2.56) | 1.57 (0.70–3.51) |
| ND1+21984 | rs2075818 | 0.742 | 0.744 | 0.91 (0.14–5.72) | 135 (0–4) | 0.59 (0.09–3.90) | 96.8 (0–4) |
| ND1+25816 | rs2235099 | 0.745 | 0.746 | 0.84 (0.13–5.55) | 0.01 (0–4) | 1.41 (0.21–9.64) | 0.01 (0–4) |
| ND1+27053 | rs2075821 | 0.733 | 0.728 | 0.76 (0.42–1.38) | 0.79 (0.41–1.55) | 0.97 (0.56–1.66) | 1.15 (0.61–2.15) |
| ND1+27606 | rs2075822 | 0.793 | 0.792 | 0.60 (0.23–1.59) | 0.38 (0.11–1.31) | 0.19 (0.06–0.60)*** | 0.42 (0.12–1.56) |
| ND1+32656 | — | 0.750 | 0.758 | 1.16 (0.33–4.11) | 6.30 (1.40–28.3)** | 1.32 (0.38–4.57) | 5.40 (1.15–25.3)** |
| ND1+45343 | rs2907748 | 0.758 | 0.762 | 0.69 (0.20–2.34) | 0.34 (0.08–1.38) | 0.67 (0.20–2.27) | 0.30 (0.07–1.30) |
aFrequency of allele*1 in asthmatic subjects.
bDominance of allele *2 over allele *1.
*0.05< P<0.10 (two-tailed).
**0.01< P<0.05 (two-tailed).
***P<0.01 (two-tailed).
References
von Mutius, E., Fritzsch, C., Weiland, S.K., Roll, G. and Magnussen, H. (
Riedler, J., Braun-Fahrlander, C., Eder, W., Schreuer, M., Waser, M., Maisch, S., Carr, D., Schierl, R., Nowak, D. and von Mutius, E. (
Daniels, S.E., Bhattacharrya, S., James, A., Leaves, N.I., Young, A., Hill, M.R., Faux, J.A., Ryan, G.F., le Souef, P.N., Lathrop, G.M. et al. (
Ober, C., Tsalenko, A., Parry, R. and Cox, N.J. (
Laitinen, T., Daly, M.J., Rioux, J.D., Kauppi, P., Laprise, C., Petays, T., Green, T., Cargill, M., Haahtela, T., Lander, E.S. et al. (
Hugot, J.P., Chamaillard, M., Zouali, H., Lesage, S., Cezard, J.P., Belaiche, J., Almer, S., Tysk, C., O'Morain, C.A., Gassull, M. et al. (
Ogura, Y., Bonen, D.K., Inohara, N., Nicolae, D.L., Chen, F.F., Ramos, R., Britton, H., Moran, T., Karaliuskas, R., Duerr, R.H. et al. (
Kabesch, M., Peters, W., Carr, D., Leupold, W., Weiland, S.K. and von Mutius, E. (
Chamaillard, M., Hashimoto, M., Horie, Y., Masumoto, J., Qiu, S., Saab, L., Ogura, Y., Kawasaki, A., Fukase, K., Kusumoto, S. et al. (
Inohara, N., Koseki, T., del Peso, L., Hu, Y., Yee, C., Chen, S., Carrio, R., Merino, J., Liu, D., Ni, J. et al. (
Moffatt, M.F., Schou, C., Faux, J.A., Abecasis, G.R., James, A., Musk, A.W. and Cookson, W.O. (
Palmer, L.J., Burton, P.R., Faux, J.A., James, A.L., Musk, A.W. and Cookson, W.O. (
Sherrill, D.L., Lebowitz, M.D., Halonen, M., Barbee, R.A. and Burrows, B. (
Inohara, N., Ogura, Y., Chen, F.F., Muto, A. and Nunez, G. (
Baldini, M., Lohman, I., Halonen, M., Erickson, R., Holt, P. and Martinez, F. (
Holt, P.G., Macaubas, C., Stumbles, P.A. and Sly, P.D. (
Dixon, M.S., Hatzixanthis, K., Jones, D.A., Harrison, K. and Jones, J.D. (
Noel, L., Moores, T.L., van Der Biezen, E.A., Parniske, M., Daniels, M.J., Parker, J.E. and Jones, J.D. (
Bouma, G. and Strober, W. (
McGovern, D.P.B., Hysi, P., Ahmad, T., van Heel, D.A., Moffatt, M.F., Carey, A., Cookson, W.O.C.M. and Jewell, D.P. (
Hill, M.R., James, A.L., Faux, J.A., Ryan, G., Hopkin, J.M., le Souef, P., Musk, A.W. and Cookson, W.O. (
Weiland, S.K., von Mutius, E., Hirsch, T., Duhme, H., Fritzsch, C., Werner, B., Husing, A., Stender, M., Renz, H., Leupold, W. et al. (
Kabesch, M., Tzotcheva, I., Carr, D., Hofler, C., Weiland, S.K., Fritzsch, C., von Mutius, E. and Martinez, F.D. (
Abecasis, G.R., Cardon, L.R. and Cookson, W.O. (
Dizier, M.H., Hill, M., James, A., Faux, J., Ryan, G., le Souef, P., Lathrop, M., Musk, A.W., Demenais, F. and Cookson, W. (
Monks, S.A., Kaplan, N.L. and Weir, B.S. (
Abecasis, G.R., Cherny, S.S., Cookson, W.O. and Cardon, L.R. (
Abecasis, G.R. and Cookson, W.O. (
Cordell, H.J. and Clayton, D.G. (
Frech, K., Herrmann, G. and Werner, T. (
Dignam, J.D., Martin, P.L., Shastry, B.S. and Roeder, R.G. (
