


Abstract
Fatty acid composition in membranes plays an important role in cellular processes and has shown to be associated with the aetiology of several complex diseases in humans. We report strong associations between variants in the human delta-5 and delta-6 desaturase genes FADS1 FADS2 and fatty acid composition in serum phospholipids. Eighteen polymorphisms located in this gene cluster were genotyped in 727 adults from Erfurt, a German centre of the European Community Respiratory Health Survey. The cluster is located at chromosome 11q12–11q13.1, a region repeatedly found to be linked with atopy and other complex diseases. Polymorphisms and statistically reconstructed haplotypes of FADS1 and the upstream region of FADS2 showed strongest associations with the level of the direct precursor of inflammatory eicosanoids, the n-6 fatty acid arachidonic acid (C20:4n-6), also strong associations with levels of the n-6 fatty acids C18:2n-6, C18:3n-6, C20:2n-6, C20:3n-6, C22:4n-6 and of the n-3 fatty acids C18:3n-3, C20:5n-3 and C22:5n-3 (P-values <1.0×10⁻¹³). Carriers of the rare alleles of several SNPs and their respective haplotypes had a lower prevalence of allergic rhinitis and atopic eczema. No association was found for total and specific IgE levels.
INTRODUCTION
Polyunsaturated fatty acid (PUFA) composition in phospholipids has been shown to be associated with the outcome of several complex human diseases such as the metabolic syndrome (1–3), cardiovascular diseases (4), psychiatric disorders (5,6) and immune-related diseases such as chronic obstructive pulmonary disease and osteoarthritis (7). Recently, fatty acids have been suggested to play a major role in the development of allergies (8), as PUFAs are processed to powerful promoters of inflammation called eicosanoids such as prostaglandins and leukotrienes (9,10). PUFA levels in phospholipids are known to be determined by both nutrition (11,12) and the metabolism. Desaturases and elongases catalyse the conversion of PUFAs in humans. Figure 1 shows the metabolic pathway of omega-3 and omega-6 fatty acids in humans. The enzymes delta-5 and delta-6 desaturases (D5D and D6D, respectively) are known to be the key enzymes of this pathway (13). Both desaturases are expressed in a majority of human tissues, with the highest levels in liver but also with major amounts in brain, heart and lung (14,15). The hypothesis that they play a key role in inflammatory diseases is strengthened by functional studies in mice, where selective D5D and D6D inhibitors showed an anti-inflammatory response (16). In human tissue, the regulatory mechanisms of D5D and D6D have scarcely been examined.
The human desaturase cDNAs were first cloned in 1999 (14,15) and identified in 2000 as fatty acid desaturase 1 (encoding D5D) and fatty acid desaturase 2 (encoding D6D) in the human genome (17). The two genes are located in a cluster on chromosome 11 (11q12–13.1) with a head-to-head orientation (Fig. 2). The sequence of the FADS1 FADS2 gene cluster can be identified as a region of conserved synteny to the mouse genes Fads1 and Fads2 coding for the homologous enzymes on chromosome 19 and with the same head-to-head orientation and the same homologous adjacent genes (http://www.ensembl.org/Homo_sapiens/syntenyview).
Linkage was previously reported between or nearby the human chromosomal region 11q12–13.1 and complex diseases like type 1 diabetes (18), osteoarthritis (19) and bipolar disorders (20), as well as asthma (21), atopy (22,23) and allergy-related quantitative traits such as total (24) and specific IgE levels (25,26).
Eighteen SNPs of the FADS1 FADS2 gene cluster were analysed in 727 Caucasians from a population-based sample. Genetic association analyses were performed, as this region seemed to be a functional and a positional candidate for having a crucial influence on fatty acid composition in phospholipids and on the development of atopic diseases.
RESULTS
Genotyping confirmed 18 SNPs reported in public databases in the FADS1 FADS2 cluster being polymorphic. The mean genotyping success rate was 97.4%. The characteristics of these SNPs, including their positions on chromosome 11, their possible functions and their genotype and allele frequencies are summarized in Table 1. The distributions of genotypes for all analysed SNPs were consistent with Hardy–Weinberg equilibrium. One of the SNPs (rs482548) had less than 10 subjects (six) homozygous for the minor allele, which were pooled with the heterozygotes for the association analysis in order to avoid conclusions from low numbers. Eight additionally genotyped previously reported SNPs derived from commonly used public databases were found to be monomorphic in the present study population (rs11548150, rs6591659, rs7929805, rs7930214, rs174563, rs174565, rs1141971 and rs2526677).
Figure 2 shows the degree of linkage disequilibrium (LD) between the analysed genetic polymorphisms. The gene cluster features a highly preserved LD block with D′>0.9 between the consecutive SNPs covering a 48 kb long genomic region from position 61324329 (rs174544) to position 61372379 (rs174589) on chromosome 11. Rs174544 up to rs3834458 were correlated with r2>0.7. Rs174545 and rs174546 showed a particularly high correlation with rs174553, and rs3834458 with rs174568 (r2>0.99). Thus, the redundant markers rs174545, rs174546 and rs174568 were left out from the analyses. The number of effective loci of the remaining 15 SNPs in the analysis was computed as 10.5 (27) (see Materials and Methods). We accounted for multiple testing by multiplying the P-values for the SNP analyses: 10.5 times for the genotypic effective loci and 17 times for altogether 17 phenotypes: 11 fatty acids, total IgE level, three different specific IgE classifications, allergic rhinitis and atopic eczema resulting in a factor of altogether 178.5.
The results of the SNP association analysis with fatty acids are summarized in Figure 3 assuming an additive inheritance model. After correction for multiple testing, modelling under the assumption of a trend per copy of the minor allele showed highly significant results for the majority of the SNPs in the FADS1 FADS2 cluster and the n-6 and n-3 fatty acids (P-values <1.0×10⁻¹³) except for n-6 docosapentaenoic acid (C22:5n-6) and docosahexaenoic acid (C22:6n-3). Subjects carrying the minor alleles of the SNPs rs174544, rs174553, rs174556, rs174561, rs174568, rs968567, rs99780, rs174570, rs2072114, rs174583 and rs174589 exhibited enhanced levels of the fatty acids linoleic acid (C18:2n-6), eicosadienoic acid (C20:2n-6), dihomo-γ-linolenic acid (C20:3n-6) and α-linolenic acid (C18:3n-3) and decreased levels of γ-linolenic acid (C18:3n-6), arachidonic acid (C20:4n-6), adrenic acid (C22:4n-6), eicosapentaenoic acid (C20:5n-3) and n-3 docosapentaenoic acid (C22:5n-3) (Fig. 3, Supplementary Material, Table S1). Fatty acids belonging to other pathways like oleic acid (C18:1n-9, data not shown), and docosahexaenoic acid (C22:6n-3), which source is mainly nutritional, did not show statistically significant associations with the genetic variants.
Beyond the D′ LD block, the relationship between fatty acid levels and SNPs weakened or vanished completely: rs174602, rs526126, rs174620 and rs482548 showed associations with fatty acid levels, but not as striking as the SNPs in the block.
Haplotypes were statistically reconstructed for two different windows (Table 2); the reconstruction is based only on persons from whom all genotypes were available to avoid large reconstruction errors resulting from missing data. The first window contained the 11 SNPs ranging from rs174544 up to rs174589 out of the 15 SNPs in the analysis in 548 subjects. As suggested by Kamatani et al. (28), the haplotype block was restricted to SNPs that were located within one LD block with D′>0.9. The strongest associations were found in the first part of the gene cluster. The second window was restricted to the first five strongly correlated SNPs, with r2>0.7, for which complete genotype data of 637 subjects were available.
For the 5-locus haplotypes, only two haplotypes had a frequency >5%, with the most common haplotype carrying the major alleles at all loci (frequency 68%) and the next frequent haplotype carrying only minor alleles (frequency 26%).
Haplotype association analysis indicated highly significant associations also after correction for multiple testing (P-values multiplied with 17 for the 17 tested outcomes) between the haplotypes and the fatty acid levels (Table 3). Virtually, all haplotypes carrying minor alleles were associated (P-values <1.0×10⁻¹³) with increased levels of linoleic acid (C18:2n-6), eicosadienoic acid (C20:2n-6), dihomo-γ-linolenic acid (C20:3n-6) and α-linolenic acid (C18:3n-3) and with decreased levels of γ-linolenic acid (C18:3n-6), arachidonic acid (C20:4n-6), adrenic acid (C22:4n-6), eicosapentaenoic acid (C20:5n-3) and n-3 docosapentaenoic acid (C22:5n-3), which was in line with the findings of the SNP analysis. For n-6 docosapentaenoic acid (C22:5n-6, after correction for multiple testing) and docosahexaenoic acid (C22:6n-3, uncorrected and corrected), haplotype analysis, as the previous SNP association analysis, showed no significant result.
The only minor allele 5-locus haplotype shows similar beta coefficient estimates and markedly smaller P-values than the 11-locus haplotypes Haplo.1 and Haplo.2. The less frequent 5-locus haplotype Haplo.1 is also significantly associated with some of the tested fatty acid levels. The variability in fatty acid levels explained by the genetic variants for the 11 SNPs and the 5 SNPs of the reconstructed haplotypes (Table 4) varies from high for arachidonic acid (C20:4n-6) (28.5 and 27.7%) to low for n-6 docosapentaenoic acid (C22:5n-6) and docosahexaenoic acid (C22:6n-3) (1–3%).
Regarding the analysis of atopic diseases and related parameters, no association was seen for genotypes or haplotypes with total or specific IgE levels (data not shown, P-values before multiple testing >0.05, after multiple testing close to 1.0). For the binary outcomes of allergic rhinitis and atopic eczema, protective odds ratios (OR) were obtained for carriers of the minor alleles of several SNPs [SNP, OR (95% confidence interval); allergic rhinitis: rs174544, 0.59 (0.36, 0.99); rs2072114, 0.45 (0.23, 0.88); atopic eczema: rs174556, 0.49 (0.25, 0.94)]. For haplotype analyses of allergic rhinitis and atopic eczema, the number of subjects homozygous for the minor alleles was very small among affected subjects (regarding the 5-locus MiA haplotype, for allergic rhinitis, two subjects were homozygous and 15 heterozygous, and for atopic eczema, two were homozygous and nine heterozygous). These subjects were thus pooled together with the heterozygotes for the binary outcome analysis. To further enhance the power of the analyses, the threshold for the Haplo.rare group was enhanced to a frequency <5%. The 5-locus haplotype consisting only of minor alleles showed protective ORs with allergic rhinitis [OR (95% CI)=0.46 (0.26, 0.83)] as well as with atopic eczema [OR (95% CI)=0.46 (0.22, 0.94)]. The 11-locus haplotypes also showed a tendency towards protective ORs. After correction for multiple testing, all significances for the associations between the gene variants and atopic diseases were not statistically significant anymore.
DISCUSSION
Arachidonic acid (C20:4n-6), as the direct precursor fatty acid for the formation of inflammatory eicosanoids, is thought to be an important factor for the development of a variety of complex diseases (3,7,8). In this population-based sample, we found that minor alleles of SNPs in the FADS1 gene and the promoter region of the FADS2 gene and the two genes encoding the two relevant desaturases on the metabolic pathway leading to arachidonic acid (C20:4n-6) production, as well as their corresponding haplotypes, were highly associated with an increase in levels of linoleic acid (C18:2n-6), eicosadienoic acid (C20:2n-6), dihomo-γ-linolenic acid (C20:3n-6) and α-linolenic acid (C18:3n-3) and with a decrease in the levels of γ-linolenic acid (C18:3n-6), arachidonic acid (C20:4n-6), adrenic acid (C22:4n-6), eicosapentaenoic acid (C20:5n-3) and n-3 docosapentaenoic acid (C22:5n-3) and less pronounced in n-6 docosapentaenoic acid (C22:5n-6) in human serum phospholipids. Apart from n-6 docosapentaenoic acid (C22:5n-6), the associations remained highly significant even after the correction for multiple testing. The most significant associations and the highest proportion of genetically explained variability (28%) were found for arachidonic acid (C20:4n-6).
Our findings highlight the importance of the desaturation pathways on n-6 and n-3 PUFA levels in serum phospholipids and that this is under genetic control. It was interesting to observe that the minor alleles of the SNPs rs174544, rs174553, rs174556, rs174561, rs3834458, rs99780 and rs174583 were mostly associated with a decrease in the level of desaturase products while accumulating the substrates. This could be an indication for a decline in the transcriptional levels or in the conversion rates of the desaturases in those subjects. The observed trend per copy of the minor allele in the associations supports that hypothesis: when compared with the homozygotes for the major alleles, the changes in the desaturases substrates and products of the homozygotes for the minor alleles were twice as high as the changes in the heterozygotes.
The observed associations could be directly caused by the analysed SNPs. As these SNPs are highly correlated, one of the SNPs would be sufficient to cause the associations in the others. The most interesting SNPs are rs174561 and rs3834458, as both SNPs are located in CpG islands in between the two genes. Furthermore, rs174561 is located in a hypothetical promoter region for the FADS2 gene, as well as in a hypothetical transcription factor-binding site (Table 1). Those two SNPs are therefore candidates for a direct influence on the transcriptional level. It is also possible that the functionally relevant SNPs are not among the ones that were directly analysed, but that we picked up an association of latent variants that are in strong LD with the causative variant(s). If the haplotypes had shown stronger associations than the SNPs separately, this would have suggested latent functional SNPs, which have not been analysed, or an effect of more than one causal DNA variant being present on one haplotype. However, that was not the case: the haplotypes showed an equally strong or even a less strong association when compared with the SNP associations. These SNPs were all highly correlated with each other and that one causal SNP among these might explain the association of all other.
Not only arachidonic acid (C20:4n-6), but also its percursors linoleic acid (C18:2n-6), γ-linolenic acid (C18:3n-6) and dihomo-γ-linolenic acid (C20:3n-6) showed strong associations with the genetic variants. On the basis of this finding, we suggest an effect of these SNPs or other variants in LD on both the D6D- and the D5D-transcriptional levels or enzyme activities.
The highly significant associations between the fatty acid composition in serum phospholipids and the FADS1 FADS2 variants in our study group are unlikely to result from any population stratification. The associations are so high that a major population stratification would be necessary to yield such effects. Furthermore, the analysis of quantitative phenotypes diminishes the problem when compared with a case‐control study analysis (29).
Only the fatty acids in serum phospholipids belonging to the D5D and D6D pathways showed statistically significant associations, whereas other fatty acids in serum phospholipids belonging to other fatty acid pathways like oleic acid (C18:1n-9, data not shown) and docosahexaenoic acid (C22:6n-3), which is mainly derived from dietary intake, did not show any significant associations with the genetic variants.
Interestingly, the level of dihomo-γ-linolenic acid (C20:3n-6) was shown to be enhanced in subjects carrying the minor alleles, whereas serum phospholipids of the same subjects exhibited lowered levels of γ-linolenic acid (C18:3n-6). We speculate that this raised percentage of the higher-chained fatty acid could be a result of the metabolic pathway via eicosadienoic acid (C20:2n-6). It could be further hypothesized that this is due to a modulated specificity of the enzyme.
It is important to look at the possible consequences of the observed effects regarding the production of inflammatory substances in the body and membrane characteristics. A significant decrease in the levels of arachidonic acid (C20:4n-6) and eicosapentaenoic acid (C20:5n-3) and a significant increase in the level of dihomo-γ-linolenic acid (C20:3n-6) were found for carriers of the minor alleles in the respective variants. All three PUFAs serve as substrates for cyclooxygenases (COX-1 and COX-2), and their products are involved in inflammatory processes: (i) arachidonic acid (C20:4n-6) is the direct precursor of strong inflammation mediators, the two-series prostaglandins (PG) and four-series leukotrienes (LT); (ii) eicosapentaenoic acid (C20:5n-3) is the direct precursor of light inflammatory eicosanoids, the three-series PGs and five-series LTs; (iii) dihomo-γ-linolenic acid (C20:3n-6) is the precursor of PGs of the one-series, which are thought to have anti-inflammatory effects (30–32). Thus, the proposed diminished conversion rates or lowered transcriptional levels of the enzymes would result in enhanced levels of substrates for hypothetic anti-inflammatory eicosanoids and in decreased levels of substrates for strong and light inflammatory eicosanoids. More generally, PUFAs and their derivatives, the eicosanoids, are involved in numerous signalling processes throughout the human body. They act, for example, as important ligands of peroxisome proliferator-activated receptors (PPARs), which are powerful transcription factors for several genes that are involved in lipid and glucose metabolism, inflammation and wound healing (33,34). Differences in the membrane's microenvironment might furthermore affect binding characteristics of embedded proteins or other interacting molecules.
The level of arachidonic acid (C20:4n-6), the direct precursor of inflammatory mediators, was previously found to be enhanced in allergic rhinitis patients in our study population (35). In the present study, we found associations of the FADS1 FADS2 gene cluster with allergic rhinitis and atopic eczema. On the one hand, these associations did not remain significant after correction for the multiple tests performed. On the other hand, this tendency for an association of the gene cluster with atopic diseases would correspond well to the findings of Obukowicz et al. (16), where they could demonstrate that selective D5D and D6D inhibitors show an anti-inflammatory response in mice. Furthermore, various genome-wide scans suggest linkage of the chromosomal region 11q12–13.1, where the FADS1 FADS2 gene cluster is located, with atopy (25). However, statistical significance concerning atopic diseases could not be proved in our study, and a larger study would be required to provide possible evidence for the associations between the FADS1 FADS2 gene cluster and atopic diseases.
Besides atopic diseases, fatty acids also seem to play an important role in the aetiology of other complex diseases. Enhanced levels of linoleic acid (C18:2n-6) and a reduction of arachidonic acid (C20:4n-6) and adrenic acid (C22:4n-6), for example, were found in the brains of patients with Alzheimer's disease (6). In schizophrenic patients, abnormalities in membrane phospholipids were found. Moreover, a clear association of schizophrenia with in vivo and post-mortem PUFA brain contents, especially with lower levels of arachidonic acid (C20:4n-6), was detected (36,37). Those abnormalities have been shown not to derive from nutrition but may be due to the human's intrinsic membrane phospholipid metabolism (38).
Summary and conclusion
This is the first study demonstrating that the fatty acid composition of serum phospholipids is genetically controlled by the FADS1 FADS2 gene cluster. The investigated SNPs in this cluster explained 28% of the variance of arachidonic acid and up to 12% of its precursor acids. We hypothesize that the variants indicate a difference in the conversion of n-3 and n-6 PUFAs catalysed by the delta5- and the delta6-desaturase, respectively. There might also be a potential of this gene cluster to have an impact on atopic disease risk.
MATERIALS AND METHODS
Study population
The European Community Respiratory Health Survey I (ECRHS I) 1991–1992 studied a population-based sample of randomly selected, mainly Caucasian, subjects in the Thuringian city of Erfurt aged between 20 and 64 years who answered a standardized screening questionnaire. The study design of ECRHS I and population sampling are described in detail elsewhere (39–41). In brief, 1282 participants answered the main questionnaire, 1258 of whom underwent a medical examination including blood sampling for analysis of specific and total IgE. A subgroup of 802 participants took part in dietary protocols, and it was possible to validate 764 of them (41); from this subgroup, phospholipids of 740 deep frozen (−80°C) serum samples were isolated, and fatty acid concentrations were analysed. The DNA of 727 participants was available for genetic testing. The population of this study consists of these 727 subjects, with data on both genotypes and fatty acid composition in serum phospholipids. The characteristics of the study population are described in Table 5. All study methods were approved by the ethics committee of the ‘Bayerische Landesärztekammer’ Munich.
Blood tests and questionnaire-derived data
The following parameters were available as atopic characteristics and quantitative traits for atopy: total IgE levels, specific IgE levels towards common allergens (house dust mite Dermatophagoides pteronyssinus, grass pollen, cat, Cladosporium and birch pollen), self-reported allergic rhinitis and atopic eczema consisting of people who reported ‘eczema or skin allergies’ together with a detectable specific IgE level >0.35 kU/l towards at least one of the common allergens. Total and specific IgE antibodies were measured with the Pharmacia CAP system (42).
Measurement of fatty acid levels
After addition of 0.1 mg/ml pentadecanoic acid (C15:0) as an internal standard, serum phospholipids were extracted from plasma with hexane:isopropanol (3:2 vol/vol) (43). The phospholipid fraction was isolated by thin-layer chromatography (44), and individual lipid fractions were further processed by adding methanolic hydrochloric acid. Fatty acid methyl esters were analysed on capillary 60 m×0.32 mm BPX70 columns (SGE, Weiterstadt, Germany) by gas chromatography using a Hewlett-Packard 5890 series II gas chromatograph (Hewlett Packard, Waldbronn, Germany) (45). Fatty acids were expressed as a percentage of the weight of the total fatty acids measured. Some of the fatty acids in serum phospholipids involved in the n-3 (C18:4n-3, C20:4n-3, C24:5n-3, C24:6n-3) and n-6 (C24:4n-6, C24:5n-6) pathways could not be analysed because of a detection limit and/or limits of baseline separation in gas chromatography. However, all the fatty acids considered to be clinically important were analysed.
Genotyping
The rationale for SNP selection was carried out as suggested by Pritchard and Przeworski (46) for short distances. For the selection, the National Center for Biotechnology (NCBI) SNP database dbSNP Build 124, based on NCBI Human Genome Build 35.1 (January 6, 2005) (http://www.ncbi.nlm.nih.gov/SNP/) and the formerly commercially available database of Celera (CeleraDiscoverySystem) were used. SNPs were chosen on the basis of positional and functional aspects to enhance the chance of detecting associations. They were chosen on the basis of density (if possible, distance <5 kb), frequency, level of validation, occurrence in or near functional regions like exons, hypothetical promoter regions (http://thr.cit.nih.gov/molbio/proscan/, http://www.genomatix.de/products/PromoterInspector/) and CpG islands (http://www.uscnorris.com/cpgislands2/cpg.aspx), 5′ and 3′-UTRs (http://www.ba.itb.cnr.it/BIG/UTRScan/), exon–intron boundaries, hypothetical transcription factor-binding sites (http://www.genomatix.de/products/MatInspector/) and human–mouse conserved sequences (http://genome.ucsc.edu/cgi-bin/hgGateway). The extraction of genomic DNA from whole blood was performed by a standard salt-precipitation method (47). Genotyping of SNPs in the FADS1 FADS2 cluster was performed using matrix-assisted laser desorption/ionization time-of-flight mass spectrometry (MALDI-TOF MS) to detect allele-specific primer extension products (Mass Array, Sequenom, San Diego, CA). Genotyping was conducted according to Sequenom's instructions (http://www.sequenom.com/Assets/pdfs/appnotes/hME.pdf, http://www.sequenom.com/Assets/pdfs/appnotes/Multiplexing_hME_App_Note.pdf) and slightly modified (48). PCR primers were designed by Sequenom's MassArrayAssayDesign program, and then aligned to the gene cluster in order to check for accuracy and to eliminate false results from genotyping repeat regions (http://genome.ucsc.edu/cgi-bin/hgBlat).
Online Mendelian inheritance in man
Fatty acid desaturase 1 [FADS1; MIM 606148]; fatty acid desaturase 2 [FADS2; MIM 606149] (http://www.ncbi.nlm.nih.gov/Omim).
Statistical analysis
The primary dependent variables for the association analyses were the fatty acid levels in phospholipids, total and specific IgE levels, atopic eczema and self-reported allergic rhinitis. The principal independent variables were the 18 genotyped SNPs in the FADS1 FADS2 cluster. Hardy–Weinberg equilibrium was tested for each SNP locus with Fisher's exact test on a contingency table of observed-versus-predicted genotype frequencies using a modified Markov-chain random walk algorithm (49,50) using the JLIN v1.0 software (http://www.genepi.com.au/jlin). As measures for pairwise linkage disequilibrium between each pair of SNP loci, Lewontin's disequilibrium coefficient D′ and the squared correlation coefficient were estimated and plotted with JLIN. Normal distribution of the fatty acids was tested by the Kolmogorov–Smirnov test and distribution plots. For the skewed outcomes γ-linolenic acid (C18:3n-6), n-6 docosapentaenoic acid (C22:5n-6), eicosapentaenoic acid (C20:5n-3) and total IgE levels, normal distribution was obtained by natural logarithm transformation of the data. Generalized linear regression models (51) were used for the SNP association analysis with quantitative and binary outcome variables assuming an additive inheritance model. Age, gender, BMI, smoking status and education were included as covariates. Analyses of the quantitative dependent variables, fatty acid levels and total IgE levels, were performed with linear models. For the analyses of the binary-dependent variables, atopic diseases and the classified specific IgE levels, logistic models were applied.
SNP association analysis was performed using Minitab software version 14 (Minitab Inc.) and S-PLUS version 6.2 (Insightful Corp.). Haplotypes were reconstructed and analysed using the haplo.glm function of the R library HaploStats (52) (http://mayoresearch.mayo.edu/mayo/research/biostat/splusfunctions.cfm). All haplotypes were included in the model, except the most common haplotype, which served as a reference. All other haplotypes with an expected frequency higher than 1% were modelled. Each possible haplotype combination per individual entered the model as a weighted observation according to the approach ‘EM by the method of weights’ (53). The weights were calculated as the posterior probabilities of the respective pair of haplotypes. Rare haplotypes (frequency <1%) were pooled and included in the model as a group called ‘haplo.rare’. The number of effective loci was computed using the spectral decomposition method (27) (http://genepi.qimr.edu.au/general/daleN/SNPSpD). The nominal significance level for the primary analysis was conservatively corrected for the number of effective loci times the number of analysed fatty acids. The variability in fatty acid levels explained by the genetic variants was calculated by linear regression modelling with the R program.
SUPPLEMENTARY MATERIAL
Supplementary Material is available at HMG Online.
ACKNOWLEDGEMENTS
The authors thank all study participants and members of the clinical centre in Erfurt for their work: Dr Ekkehard Beck and PD Dr Hartmut Holtz. We thank Dr John Favor for kindly proofreading the manuscript. We further thank Guido Fischer for excellent data handling and Arsin Sabunchi for great laboratory work. We are grateful to PD Dr M. Wjst for discussion and to the director of the Institute of Epidemiology, Professor Dr H.-Erich Wichmann for institutional support.
This work was partly funded by the German Research Foundation (Deutsche Forschungsgemeinschaft), research grants HEI 3294/1-1 and KO 912/8-1, BMBF (NGFN) and the SFB-386 (DFG) and by a travel grant of the Boehringer Ingelheim Fonds.
Conflict of Interest statement. None declared.
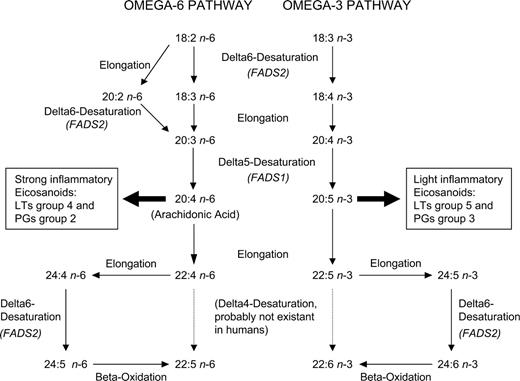
Figure 1. Metabolic pathway of long-chain omega-6 and omega-3 PUFAs in humans. Dashed arrows indicate the absence of the respective derivatization steps in humans.
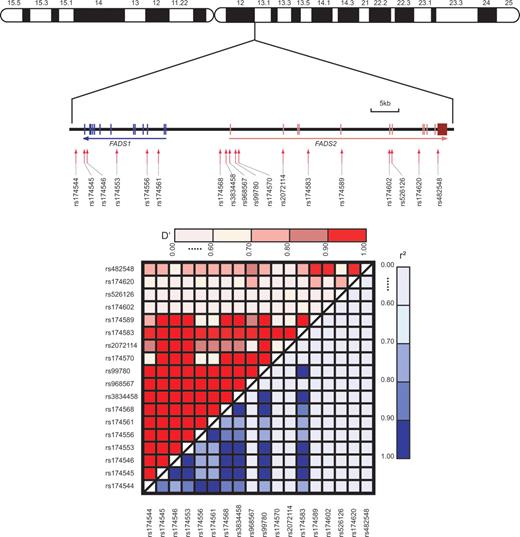
Figure 2. Structure of the FADS1 FADS2 gene cluster, its location on chromosome 11 and pairwise LD D′ and r2 plots of 18 SNPs (Table 2) across the FADS1 FADS2 gene cluster. The software JLIN was used to calculate the LD values of alleles at adjacent loci and to generate the plot graph.
![Figure 3. Association analysis of 15 SNPs with changes in the fraction of the respective analysed fatty acid in total fatty acid composition of serum phospholipids in humans. As reference serves the mean percentage of the respective fatty acid in total fatty acids for the subjects carrying the respective major SNP on both alleles, major A major A. Light blue bars indicate the change of the fatty acid composition for heterozygous carriers of the minor SNP [level (major A, minor a) minus level (major A, major A)], dark blue ones for homozygotes of the minor allele [level (minor a, minor a) minus level (major A, major A)]. For exact figures, see Supplementary Material, Table S1: f.ex. looking at arachidonic acid (C20:4n-6), heterozygotes for the minor allele of the SNP rs174544 have a lower level (9.2% arachidonic acid in total fatty acids) in comparison with homozygotes for the major allele (10.2%). People homozygous for that minor allele exhibit 8% arachidonic acid in total fatty acids. The lines in the figure indicate standard errors. Stars indicate significances after correction for multiple testing from general linear regression analyses assuming an additive inheritance model adjusted for age, gender, BMI, smoking status and education. *P<0.05, **P<0.01 and ***P <0.001. The fatty acids γ-linolenic acid (C18:3n-6), n-6 docosapentaenoic acid (C22:5n-6) and eicosapentaenoic acid (C20:5n-3) were naturally logarithmized to obtain normal distributions. This is indicated by ‘ln’.](https://oup.silverchair-cdn.com/oup/backfile/Content_public/Journal/hmg/15/11/10.1093_hmg_ddl117/1/m_ddl11703.jpeg?Expires=1716376760&Signature=p8XNm8I9Pyoc5ifdRaXqi2Y2FPjC0llUIsCkQ567kYybWd6B5De5QpQWjZjITIfFkGpOY-AQWfnnMNujotthLWBn253wDeA2uBNXANkaTjJlrsq5SCwln-1zcTaw8~8LTM4GoSAwojAPZQFp6WwY64~rAEPm0gmalo4ta722LEeLwtF3nTVz80MdICPJd~py8nDdQsuRCFbLmMguUb5AqmOVDLCUQXIj4caNDT59jJHJbLmrWlUO5UxhRI4TGVT~D6yZlt09xKqH1838q9ShtJpwyv6djwwxv~NkuxOToPGhz0mGdwxPx46Y6RnrCbPf8fXR3T8Ypw1H~243YWSo5A__&Key-Pair-Id=APKAIE5G5CRDK6RD3PGA)
Figure 3. Association analysis of 15 SNPs with changes in the fraction of the respective analysed fatty acid in total fatty acid composition of serum phospholipids in humans. As reference serves the mean percentage of the respective fatty acid in total fatty acids for the subjects carrying the respective major SNP on both alleles, major A major A. Light blue bars indicate the change of the fatty acid composition for heterozygous carriers of the minor SNP [level (major A, minor a) minus level (major A, major A)], dark blue ones for homozygotes of the minor allele [level (minor a, minor a) minus level (major A, major A)]. For exact figures, see Supplementary Material, Table S1: f.ex. looking at arachidonic acid (C20:4n-6), heterozygotes for the minor allele of the SNP rs174544 have a lower level (9.2% arachidonic acid in total fatty acids) in comparison with homozygotes for the major allele (10.2%). People homozygous for that minor allele exhibit 8% arachidonic acid in total fatty acids. The lines in the figure indicate standard errors. Stars indicate significances after correction for multiple testing from general linear regression analyses assuming an additive inheritance model adjusted for age, gender, BMI, smoking status and education. *P<0.05, **P<0.01 and ***P <0.001. The fatty acids γ-linolenic acid (C18:3n-6), n-6 docosapentaenoic acid (C22:5n-6) and eicosapentaenoic acid (C20:5n-3) were naturally logarithmized to obtain normal distributions. This is indicated by ‘ln’.
Characteristics of 18 polymorphisms in the FADS1 FADS2 gene region for the ECRHS1 Erfurt study population
| dbSNP | Position (bp)a | Possible functional region | Alleles (major/minor) | Number (%) of subjects with | Genotyping success rate (%) | ||||
|---|---|---|---|---|---|---|---|---|---|
| 1/2b | Genotype | Allele | |||||||
| 1 1 | 1 2 | 2 2 | 1 | 2 | |||||
| rs174544 | 61324329 | FADS1 3′-UTR | C/A | 362 (51) | 287 (41) | 59 (8) | 1011 (71) | 405 (29) | 97.4 |
| rs174545 | 61325882 | FADS1 3′-UTR | C/G | 320 (45) | 303 (43) | 83 (12) | 943 (67) | 469 (33) | 97.1 |
| rs174546 | 61326406 | FADS1 3′-UTR | C/T | 319 (44) | 317 (44) | 84 (12) | 955 (66) | 485 (34) | 99.0 |
| rs174553 | 61331734 | FADS1 intronic | A/G | 323 (45) | 312 (43) | 85 (12) | 958 (67) | 482 (33) | 99.0 |
| rs174556 | 61337211 | FADS1 intronic | C/T | 370 (54) | 258 (38) | 58 (8) | 998 (73) | 374 (27) | 94.4 |
| rs174561 | 61339284 | FADS1 intronic, CpG-island, promoter region, TFBSc | T/C | 364 (52) | 275 (39) | 62 (9) | 1003 (72) | 399 (28) | 96.4 |
| rs174568 | 61350392 | intergenic | C/T | 328 (48) | 282 (41) | 79 (11) | 938 (68) | 440 (32) | 94.8 |
| rs3834458 | 61351497 | intergenic, CpG-island | T/deld | 333 (46) | 309 (43) | 79 (11) | 975 (68) | 467 (32) | 99.2 |
| rs968567 | 61352140 | intergenic, CpG-island, promoter region, HMCSe | G/A | 503 (71) | 193 (27) | 17 (2) | 1199 (84) | 227 (16) | 98.1 |
| rs99780 | 61353209 | FADS2 intronic, HMCSe | C/T | 322 (44) | 316 (44) | 87 (12) | 960 (66) | 490 (34) | 99.7 |
| rs174570 | 61353788 | FADS2 intronic, TFBSc | C/T | 525 (76) | 155 (22) | 13 (2) | 1205 (87) | 181 (13) | 95.3 |
| rs2072114 | 61361791 | FADS2 intronic, exon/intron boundary | A/G | 510 (73) | 174 (25) | 15 (2) | 1194 (85) | 204 (15) | 96.1 |
| rs174583 | 61366326 | FADS2 intronic | C/T | 314 (45) | 295 (42) | 89 (13) | 923 (66) | 473 (34) | 96.0 |
| rs174589 | 61372379 | FADS2 intronic, exon/intron boundary | G/C | 462 (69) | 190 (28) | 22 (3) | 1114 (83) | 234 (17) | 92.7 |
| rs174602 | 61380990 | FADS2 intronic, exon/intron boundary | A/G | 496 (69) | 199 (28) | 28 (4) | 1191 (82) | 255 (18) | 99.4 |
| rs526126 | 61381461 | FADS2 intronic, exon/intron boundary | G/C | 490 (67) | 210 (29) | 26 (4) | 1190 (82) | 262 (18) | 99.9 |
| rs174620 | 61386323 | FADS2 intronic | T/C | 224 (31) | 380 (53) | 116 (16) | 828 (57) | 612 (43) | 99.0 |
| rs482548 | 61389758 | FADS2 3′-UTR, HMCSe | C/T | 605 (83) | 114 (16) | 6 (1) | 1324 (91) | 126 (9) | 99.7 |
aPosition in basepairs was derived from dbSNP Build 124, based on NCBI Human Genome Build 35.1 (January 6, 2005) of chromosome 11.
b1, major allele; 2, minor allele.
cTFBS, transcription factor-binding site.
ddel, deletion.
eHMCS, human–mouse conserved segments.
Haplotype characteristics for 11-locus and 5-locus haplotypes
| Haplotype | Allelesa | Frequency (%) | |
|---|---|---|---|
| 11-Locus haplotype (rs174544–rs174589) | |||
| MaAb haplotype | CACTTGCCACG | 11111111111 | 68.8 |
| Haplo.1 | AGTCdelATCATC | 22222221122 | 10.6 |
| Haplo.2 | AGTCdelGTTGTG | 22222122221 | 7.8 |
| Haplo.3 | CGCTdelGTTATC | 12112122122 | 2.9 |
| Haplo.4 | AGTCdelGTCGTG | 22222121221 | 2.6 |
| Haplo.5 | AGTCdelATCGTG | 22222221221 | 1.2 |
| Haplo.6 | AGTCdelATCATG | 22222221121 | 1.0 |
| Haplo.rare (frequency <1%) | 5.0 | ||
| 5-Locus haplotype (rs17544–rs3834458) | |||
| MaA haplotype | CACTT | 11111 | 68.6 |
| MiAc haplotype | AGTCdel | 22222 | 25.7 |
| Haplo.1 | CGCTdel | 12112 | 3.5 |
| Haplo.rare (frequency <1%) | 2.3 | ||
a1, major allele; 2, minor allele.
bMaA, major allele, haplotype carrying only common alleles.
cMiA, minor allele, haplotype carrying only rare alleles.
Associations of FADS1 FADS2 haplotypes with fatty acids: P-values and beta coefficients (change of fatty acid or change of log of fatty acid per copy of the haplotype)
| Fatty acids | ||||||||||||
|---|---|---|---|---|---|---|---|---|---|---|---|---|
| Omega-6 fatty acids | Omega-3 fatty acids | |||||||||||
| Haplotype | C18:2n-6 | ln C18:3n-6 | C20:2n-6 | C20:3n-6 | C20:4n-6 | C22:4n-6 | ln C22:5n-6 | C18:3n-3 | ln C20:5n-3 | C22:5n-3 | C22:6n-3 | |
| 11-Locus haplotypes (rs174544–rs174589), 11-locus MaA haplotype as reference | ||||||||||||
| Haplo.1 | P-value | 8.5×10⁻⁶ | 0.26 | 0.0014 | 2.4×10⁻¹¹ | 3.7×10⁻¹⁵ | 0.26 | 1.0 | 0.063 | 0.00034 | 0.0075 | 1.0 |
| Coefficient | 1.18 | −0.08 | 0.022 | 0.37 | −1.03 | −0.015 | −0.024 | 0.017 | −0.18 | −0.061 | −0.13 | |
| Haplo.2 | P-value | 0.0066 | 2.4×10⁻⁶ | 2.7×10⁻⁷ | 1.0 | <1.0×10⁻¹⁴ | 1.1×10⁻⁴ | 1.0 | 0.0024 | 1.0 | 1.0 | 1.0 |
| Coefficient | 0.95 | −0.2 | 0.037 | 0.063 | −1.48 | −0.033 | −0.05 | 0.026 | −0.06 | −0.021 | 0.1 | |
| Haplo.3 | P-value | 0.0060 | 0.044 | 0.0049 | 1.0 | 3.2×10⁻⁷ | 0.35 | 1.0 | 0.071 | 0.21 | 0.020 | 1.0 |
| Coefficient | 1.518 | −0.18 | 0.038 | 0.034 | −1.266 | 0.0268 | −0.046 | 0.031 | −0.192 | −0.103 | −0.289 | |
| Haplo.4 | P-value | 0.086 | 0.29 | 1.0×10⁻⁶ | 1.0 | 9.4×10⁻⁵ | 1.0 | 1.0 | 1.0 | 1.0 | 1.0 | 1.0 |
| Coefficient | 1.311 | −0.157 | 0.062 | 0.085 | −1.124 | 0.0174 | −0.028 | 0.003 | −0.1 | −0.055 | 0.057 | |
| Haplo.5 | P-value | 1.0 | 1.0 | 0.042 | 0.47 | 0.045 | 1.0 | 1.0 | 1.0 | 1.0 | 1.0 | 1.0 |
| Coefficient | −0.29 | −0.081 | 0.05 | 0.326 | −1.066 | 0.007 | 0.044 | 0.016 | 0.027 | −0.017 | 0.075 | |
| Haplo.6 | P-value | 0.16 | 0.11 | 1.0 | 1.0 | 0.22 | 1.0 | 1.0 | 1.0 | 0.10 | 1.0 | 1.0 |
| Coefficient | 1.907 | −0.282 | −0.002 | 0.088 | −0.955 | −0.028 | −0.031 | −0.005 | −0.364 | −0.062 | 0.082 | |
| Haplo.rare | P-value | 0.079 | 1.0 | 0.47 | 1.0 | 0.068 | 1.0 | 1.0 | 1.0 | 0.20 | 1.0 | 1.0 |
| Coefficient | 1.067 | −0.065 | 0.021 | 0.099 | −0.564 | −0.005 | 0.037 | 0.007 | −0.176 | −0.005 | 0238 | |
| 5-Locus haplotypes (rs174544–rs3834458), 5-locus MaA haplotype as reference | ||||||||||||
| MiA- | P-value | 1.2×10⁻¹³ | 6.5×10⁻¹³ | <1.0×10⁻¹⁴ | 8.0×10⁻¹⁰ | <1.0×10⁻¹⁴ | 1.4×10⁻⁷ | 0.43 | 0.00034 | 1.5×10⁻⁶ | 2.7×10⁻⁶ | 1.0 |
| Haplotype | Coefficient | 1.18 | −0.16 | 0.032 | 0.22 | −1.17 | −0.023 | −0.053 | 0.016 | −0.14 | −0.06 | −0.06 |
| Haplo.1 | P-value | 0.024 | 0.021 | 0.0027 | 1.0 | 1.3×10⁻⁷ | 0.37 | 1.0 | 0.060 | 0.095 | 0.010 | 0.50 |
| Coefficient | 1.177 | −0.165 | 0.034 | 0.079 | −1.122 | −0.023 | −0.025 | 0.027 | −0.183 | −0.097 | −0.304 | |
| Haplo.rare | P-value | 0.32 | 0.47 | 0.0066 | 1.0 | 0.70 | 1.0 | 1.0 | 0.026 | 0.067 | 1.0 | 0.48 |
| Coefficient | 1.067 | −0.138 | 0.04 | 0.126 | −0.482 | 0.006 | 0.054 | 0.021 | −0.235 | −0.045 | −0.378 | |
P-values that exceed 1.0 after correction for multiple testing have been marked down to 1.0.
Percentage of variations in the fatty acid levels explained by the SNPs for the models containing the SNPs of the 5-locus and 11-locus haplotypes
| Fatty acid | r2 5SNPs (%) | r2 11SNPs (%) |
|---|---|---|
| Linoleic acid (C18:2n-6) | 8.6 | 9.2 |
| γ-Linolenic acid (ln C18:3n-6) | 7.9 | 7.9 |
| Eicosadienoic acid (C20:2n-6) | 10.1 | 12.3 |
| Dihomo-γ-linolenic acid (C20:3n-6) | 7.4 | 10.8 |
| Arachidonic acid (C20:4n-6) | 27.7 | 28.5 |
| Adrenic acid (C22:4n-6) | 6.3 | 5.9 |
| n-6 Docosapentaenoic acid (ln C22:5n-6) | 1.2 | 1.5 |
| α-linolenic acid (C18:3n-3) | 3.9 | 5.4 |
| Eicosapentaenoic acid (ln C20:5n-3) | 5.2 | 6.9 |
| n-3 Docosapentaenoic acid (C22:5n-3) | 5.5 | 5.1 |
| Docosahexaenoic acid (C22:6n-3) | 1.4 | 2.9 |
Characteristics of the ECRHS1 study population, including fatty acid composition in serum phospholipids (in percent of total fatty acids)
| Characteristics | Total (n=727) |
|---|---|
| Age (years)a | 41.6±12.3 |
| Anthropometrya | |
| Height (m) | 1.70±0.09 |
| Weight (kg) | 73.9±13.8 |
| Sexb | |
| Male | 421 (58) |
| Female | 306 (42) |
| Educational statusb,c | |
| High | 334 (46) |
| Medium | 237 (33) |
| Low | 156 (21) |
| Smoking statusb | |
| Never | 294 (40) |
| Ex | 201 (28) |
| Current | 232 (32) |
| Omega-6 fatty acids | |
| Linoleic acid (C18:2n-6)a | 20.23±2.70 |
| γ-Linolenic acid (C18:3n-6)d | 0.10 (0.09, 0.10) |
| Eicosadienoic acid (C20:2n-6)a | 0.39±0.07 |
| Dihomo-γ-linolenic acid (C20:3n-6)a | 2.87±0.59 |
| Arachidonic acid (C20:4n-6)a | 9.61±1.51 |
| Adrenic acid (C22:4n-6)a | 0.34±0.07 |
| n-6 Docosapentaenoic acid (C22:5n-6)d | 0.22 (0.21, 0.23) |
| Omega-3 fatty acids | |
| α-Linolenic acid (C18:3n-3)a | 0.18±0.06 |
| Eicosapentaenoic acid (C20:5n-3)d | 0.97 (0.94, 1.00) |
| n-3 Docosapentaenoic acid (C22:5n-3)a | 0.96±0.22 |
| Docosahexaenoic acid (C22:6n-3)a | 3.85±0.94 |
| IgE levels (kU/l) | |
| Total IgEc,e | 40 (36, 44) |
| At least one specific IgE >0.35b,e | 204 (28.1) |
| At least one specific IgE >0.7b,e | 166 (22.9) |
| At least 1 specific IgE >3.5b,e | 85 (11.7) |
| Allergic rhinitisb,f | 76 (10.5) |
| Atopic eczemab,g | 49 (6.8) |
aArithmetic mean ± standard deviation.
bn (%).
cClassified according to the former East Germany school system: low, <10 years school; medium, 10 years; high >10 years.
dGeometric mean (95% confidence interval).
eOne proband missing.
fSelf-diagnosed nasal allergies including hay fever.
gSelf-diagnosed eczema or skin allergies and at least one elevated (>0.35 kU/l) specific IgE level.
References
van Doormaal, J.J., Muskiet, F.A., van Ballegooie, E., Sluiter, W.J. and Doorenbos, H. (
Das, U.N. (
Vessby, B. (
Glew, R.H., Okolie, H., Huang, Y.S., Chuang, L.T., Suberu, O., Crossey, M. and VanderJagt, D.J. (
Maes, M., Smith, R., Christophe, A., Cosyns, P., Desnyder, R. and Meltzer, H. (
Nakada, T., Kwee, I.L. and Ellis, W.G. (
Goldring, M.B. and Berenbaum, F. (
Duchen, K. and Bjorksten, B. (
Calder, P.C. (
Emken, E.A., Adlof, R.O. and Gulley, R.M. (
Di Stasi, D., Bernasconi, R., Marchiali, R., Marfisi, R.M., Rossi, G., Rognoni, G. and Sacconi, M.T. (
Cho, H.P., Nakamura, M. and Clarke, S.D. (
Cho, H.P., Nakamura, M.T. and Clarke, S.D. (
Obukowicz, M.G., Welsch, D.J., Salsgiver, W.J., Martin-Berger, C.L., Chinn, K.S., Duffin, K.L., Raz, A. and Needleman, P. (
Marquardt, A., Stohr, H., White, K. and Weber, B.H.F. (
Nakagawa, Y., Kawaguchi, Y., Twells, R.C.J., Muxworthy, C., Hunter, K.M.D., Wilson, A., Merriman, M.E., Cox, R.D., Merriman, T., Cucca, F. et al. (
Chapman, K., Mustafa, Z., Irven, C., Carr, A.J., Clipsham, K., Smith, A., Chitnavis, J., Sinsheimer, J.S., Bloomfield, V.A., McCartney, M. et al. (
Fallin, M.D., Lasseter, V.K., Wolyniec, P.S., McGrath, J.A., Nestadt, G., Valle, D., Liang, K.Y. and Pulver, A.E. (
Huang, J.L., Gao, P.S., Mathias, R.A., Yao, T.C., Chen, L.C., Kuo, M.L., Hsu, S.C., Plunkett, B., Togias, A., Barnes, K.C. et al. (
Stafford, A.N., Rider, S.H., Hopkin, J.M., Cookson, W.O. and Monaco, A.P. (
Wheatley, A.P., Bolland, D.J., Hewitt, J.E., Dewar, J.C. and Hall, I.P. (
Palmer, L.J., Pare, P.D., Faux, J.A., Moffatt, M.F., Daniels, S.E., LeSouef, P.N., Bremner, P.R., Mockford, E., Gracey, M., Spargo, R. et al. (
Daniels, S.E., Bhattacharrya, S., James, A., Leaves, N.I., Young, A., Hill, M.R., Faux, J.A., Ryan, G.F., le Souef, P.N., Lathrop, G.M. et al. (
Palmer, L.J., Daniels, S.E., Rye, P.J., Gibson, N.A., Tay, G.K., Cookson, W.O., Goldblatt, J., Burton, P.R. and LeSouef, P.N. (
Nyholt, D.R. (
Kamatani, N., Semine, A., Kitamoto, T., Iida, A., Saito, S., Kogame, A., Inoue, E., Kawamoto, M., Harigai, M. and Nakamura, Y. (
Cardon, L.R. and Palmer, L.J. (
Belch, J.J.F. and Hill, A. (
Calder, P.C. (
Das, U.N. (
Desvergne, B. and Wahli, W. (
Evans, R.M., Barish, G.D. and Wang, Y.X. (
Kompauer, I., Demmelmair, H., Koletzko, B., Bolte, G., Linseisen, J. and Heinrich, J. (
Yao, J.K., Leonard, S. and Reddy, R.D. (
Yao, J.K., Stanley, J.A., Reddy, R.D., Keshevan, M.S. and Pettegrew, J.W. (
Strassnig, M., Singh Brar, J. and Ganguli, R. (
Burney, P.G., Luczynska, C., Chinn, S. and Jarvis, D. (
Janson, C., Anto, J., Burney, P., Chinn, S., De Marco, R., Heinrich, J., Jarvis, D., Kuenzli, N., Leynaert, B., Luczynska, C. et al. (
Trak-Fellermeier, M.A., Brasche, S., Winkler, G., Koletzko, B. and Heinrich, J. (
Burney, P., Malmberg, E., Chinn, S., Jarvis, D., Luczynska, C. and Lai, E. (
Kolarovic, L. and Fournier, N.C. (
Carnielli, V.P., Pederzini, F., Vittorangeli, R., Luijendijk, I.H., Boomaars, W.E., Pedrotti, D. and Sauer, P.J. (
Demmelmair, H., von Schenck, U., Behrendt, E., Sauerwald, T. and Koletzko, B. (
Pritchard, J.K. and Przeworski, M. (
Miller, S.A., Dykes, D.D. and Polesky, H.F. (
Weidinger, S., Klopp, N., Wagenpfeil, S., Rummler, L., Schedel, M., Kabesch, M., Schafer, T., Darsow, U., Jakob, T., Behrendt, H. et al. (
Guo, S.W. and Thompson, E.A. (
Wigginton, J.E., Cutler, D.J. and Abecasis, G.R. (
McCullagh, P. and Nelder, J.A. (
Lake, S.L., Lyon, H., Tantisira, K., Silverman, E.K., Weiss, S.T., Laird, N.M. and Schaid, D.J. (
