


Abstract
Childhood absence epilepsy (CAE) is considered to exhibit a complex non-Mendelian pattern of inheritance. So far, only few CAE susceptibility genes have been identified. In a previous study of our group, an association between the GABAA receptor beta3 subunit (GABRB3) gene and CAE was shown. To further investigate this association, we screened 45 CAE patients of the first study for mutations in the 10 exons, the exon–intron boundaries and the regulatory sequences of GABRB3. Although we found no functionally relevant mutation, we did identify 13 single nucleotide polymorphisms (SNPs) in the GABRB3 gene region from the exon 1a promoter to the beginning of intron 3. Using these SNPs we defined four haplotypes for the respective GABRB3 gene region. A transmission disequilibrium test in the same 45 CAE patients and their parents indicated a significant association of this region and CAE (P=0.007075). Reporter gene assays in NT2 cells using exon 1a promoter constructs indicated that the disease-associated haplotype 2 promoter causes a significantly lower transcriptional activity than the haplotype 1 promoter that is over-represented in the controls. In silico analysis suggested that an exchange from T (haplotype 1) to C (haplotype 2) within this promoter impairs binding of the neuron-specific transcriptional activator N-Oct-3. Electrophoretic mobility shift assays demonstrated that the respective polymorphism reduces the nuclear protein binding affinity, thus explaining the results of the reporter gene assays. Reduced expression of the GABRB3 gene could therefore be one potential cause for the development of CAE, pathogenetically relevant in our patient group.
INTRODUCTION
Accounting for 8–15% of all childhood epilepsies, childhood absence epilepsy (CAE) is one of the most frequently occurring syndromes among the idiopathic generalized epilepsies (IGEs). Its main clinical features are typical absence seizures associated with generalized 3 Hz spike and wave discharges in the EEG (http://www.epilepsy.org/ctf/syn_frame.html). Evidence suggests that common forms of IGEs including CAE, exhibit complex non-Mendelian patterns of inheritance. Multiple genes seem to be simultaneously involved, and a diversity of susceptibility genes collaborate in determining risk with some contribution from environmental factors (1–4). For CAE, so far, only a few susceptibility genes have been identified, among them GABAA receptor genes (5,6).
GABAA receptors are chloride channels that can be opened by GABA and are the site of action of several anti-epileptic drugs (7–9). Any enhancement of the inhibitory actions of GABAA receptors causes anti-convulsive effects, whereas a reduction in the function of these receptors causes convulsions (7). Congruently, three GABAA receptor subunit genes have been identified to be involved in the pathogenesis of inherited idiopathic epilepsies. Mutations in GABRG2, encoding the γ2-subunit were found in families with generalized epilepsy with febrile seizures plus (GEFS+) and CAE with febrile seizures (10–13). Mutations in GABRA1, encoding the α1-subunit, have been identified in a family with juvenile myoclonic epilepsy (14) and in a ‘sporadic’ CAE-case (15). Coding variants in GABRD, encoding the δ-subunit seem also to be related to GEFS+ (16).
Another major constituent of neuronal GABAA receptors is the β3 subunit. Whereas in adult brain it exhibits a relatively restricted pattern of expression, during development it is the most abundant and most widely expressed β-type subunit in the brain, indicating a potentially critical role of GABRB3 gene dosage in early brain development (17–19).
In a previous study (20), we were able to show an association between the GABAA receptor β3 subunit gene (GABRB3) and CAE in a group of patients with a high percentage of subjects suffering from absence seizures as the sole phenotype. Using the microsatellite DNA marker 155CA2 which is located within intron 3 of GABRB3 we demonstrated a significant association with CAE (P=0.0118) (20). Significant differences were seen for the 107 bp allele of GABRB3, which was over-represented in the patients and for the 95 bp allele of GABRB3, which was over-represented in the control group. This association of the GABRB3 gene with CAE was replicated by another group (21–23) in a totally different population. Moreover, in eight families with remitting CAE, a suggestive linkage of the GABRB3 gene was reported (24), providing evidence for a significant impact of this locus in the development of CAE.
In the present study, we aimed to confirm the association of the GABRB3 gene and CAE (20) and to identify the underlying genetic cause. Therefore, we performed a mutation screen in the GABRB3 gene to discover single nucleotide polymorphisms (SNPs). We then defined haplotypes for the GABRB3 gene region upstream of intron 3 for a subsequent association analysis. Finally, we examined the transcriptional activity of the GABRB3 gene exon 1a promoter haplotypes to investigate whether polymorphisms in this promoter region influence the GABRB3 gene expression.
RESULTS
Mutation screening and haplotype construction
The human GABRB3 gene has 10 exons (25) and contains two promoter regions upstream of the alternative first exons, exon 1a and exon 1 (26) (Fig. 1A). Both alternative first exons are predicted to encode a signal peptide. Using PCR primers flanking each exon, we screened the 5′-untranslated regions (5′-UTRs), the coding region and the 3′-UTR of the GABRB3 gene in 45 CAE patients by single strand conformation polymorphism (SSCP) analysis. To increase the efficiency of mutation detection for the longer exons 4, 7, 8 and 9, SSCP analyses were performed after restriction endonuclease digestion. Each candidate SNP was then confirmed by DNA sequencing. To search for SNPs in the promoter regions of the GABRB3 gene, we amplified and sequenced 1400 bp of the genomic DNA upstream of exon 1a and a 650 bp fragment between exon 1a and exon 1 in 11 patients and 9 unrelated control samples. As a result, a total of 13 SNPs were found, of which 2 SNPs were novel. The remaining 11 SNPs had already been deposited in the dbSNP database (http://www.ncbi.nlm.nih.gov/SNP/index.html). From the 13 SNPs, 8 were located in the promoter region upstream of exon 1a, two SNPs in exon 1a, two SNPs in the promoter region upstream of exon 1 and one SNP in intron 3 just 13 basepairs downstream of the exon (Table 1 and Fig. 1A).
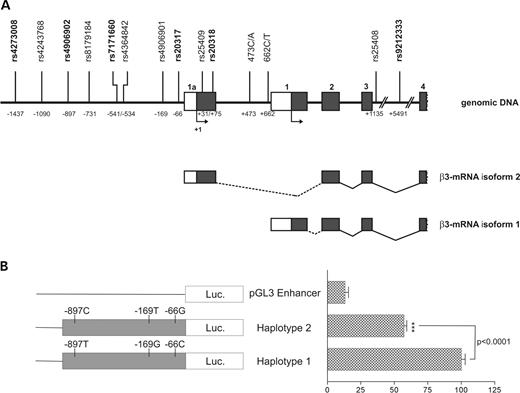
(A) Map of the 5′-region of the GABRB3 gene showing the exons (boxes) and introns (solid lines), the position of the SNPs, numbered from the translational start site of exon 1a and the alternative transcript isoforms 1 and 2. The graph is not to scale. Shaded boxes display the coding region, whereas open boxes indicate untranslated regions. The translational start sites in exons 1a and 1 are shown with an arrow. RefSNP IDs of the haplotype-tagging SNPs are given in bold letters. Alternative processing of first exons is indicated by dotted lines. (B) Reporter gene assay of the GABRB3 exon 1a promoter with NT2 cells. The constructs of the reporter plasmids are shown on the left. Promoter constructs were transiently transfected into the neuronal-like cell-line NT2. Transcriptional activity was determined by assaying the luciferase activity of cellular extracts prepared 40 h after transfection. Transcriptional activities of the reporter constructs are given as the percentage of haplotype 1 activities. Data show the mean±SD relative activity from six experiments done in triplicate. Differences between haplotype 1 and haplotype 2 promoter activities were analyzed non-parametrically and statistical significance was determined by Mann–Whitney test (P<0.0001).
Summary of the polymorphisms analyzed in the GABRB3 gene region from the exon 1a promoter to intron 3
| RefSNP IDa | Positionb | Variation | Location | Restriction enzymec,d |
|---|---|---|---|---|
| rs4273008 | −1437 | T/G | Promoter | BclI |
| rs4243768 | −1090 | G/A | Promoter | |
| rs4906902 | −897 | T/C | Promoter | Tsp509I |
| rs8179184 | −731 | G/A | Promoter | |
| rs7171660 | −541 | T/C | Promoter | XbaI |
| rs4364842 | −534 | T/C | Promoter | |
| rs4906901 | −169 | T/G | Promoter | |
| rs20317 | −66 | G/C | Promoter | Bsh1236I |
| rs25409 | 31 | G/A | Exon 1a | |
| rs20318 | 75 | G/A | Exon 1a | Eco24I |
| Novel | 473 | C/A | Promoter | |
| Novel | 662 | C/T | Promoter | |
| rs25408 | 1335 | G/A | Intron 3 | |
| rs3212333 | 5491 | G/C | Intron 3 | HinfI |
aRefSNP IDs of the haplotype-tagging SNPs in bold letters.
bNumbering with respect to the initiator methionine of exon 1a; GenBank accession no. NT_026446.
cRestriction enzymes used for genotyping the haplotype-tagging SNPs.
dPrimer sequences are listed in Supplementary Material, Table S1.
As the mutation screening of the coding exons 4–10 of GABRB3 did not identify any functionally relevant mutation or SNP, we considered that genetic alterations underlying the observed association are located in the region upstream of marker 155CA2 containing both promoter regions and the exons 1a, 1, 2 and 3. To improve coverage of the 12 kb GABRB3 gene region between the exon 1a promoter and the associated microsatellite marker 155CA2 that is situated at the very beginning of the 150 kb long intron 3, we selected one additional intron 3 marker (rs3212333) from the dbSNP database (http://www.ncbi.nlm.nih.gov/SNP/index.html). In order to construct haplotypes, the genotypes derived by direct sequencing of the promoter regions in the 11 patients and 9 unrelated control samples were combined with the genotypes of the SNPs generated by polymerase chain-reaction restriction fragment length polymorphism (PCR–RFLP) in the same 20 individuals. Based on these genotypes we were able to define four haplotypes for the GABRB3 gene region ranging from the promoter upstream of exon 1a to the beginning of intron 3. By inspection of the data, we recognized that a combination of six haplotype tagging SNPs (htSNPs) is sufficient to capture the full haplotype information in this region of interest (Table 2).
Combination of tag SNP alleles defining each haplotype
| rs4273008 | rs4906902 | rs7171660 | rs20317 | rs20318 | rs3212333 | |
|---|---|---|---|---|---|---|
| −1437a | −897 | −541 | −66 | 75 | 5491 | |
| Haplotype 1 | G | T | T | C | G | G |
| Haplotype 2 | G | C | T | G | A | C |
| Haplotype 3 | G | C | T | C | A | C |
| Haplotype 4 | T | T | C | C | G | G |
aPositions of the SNPs are given with respect to the initiator methionine of exon 1a; GenBank accession no. NT_026446.
Association analysis
In the present study, 45 of the previously investigated 50 CAE trios were investigated (20). For five trios DNA was no longer available. A total of 26 CAE patients were females and 19 were males. Onset of absence seizures had been between 4.9 and 8.2 years (mean 6.8 years) of age. Thirty-five children suffered from absence seizures exclusively (24 remitting CAE, 8 non-remitting CAE), 10 had absence seizures as well as rare generalized tonic clonic seizures during the course of the illness. Eight children demonstrated photosensitivity in the EEG. Six children had a history of febrile seizures. A positive family history of epilepsy was found in 15 cases; paternal in 8, maternal in 7 patients.
In order to learn whether there is an association between the GABRB3 gene haplotypes and CAE, we genotyped our six htSNPs in 45 CAE patients and their parents by PCR–RFLP (Table 2).
Already visual analysis of allele distribution (Table 3), revealed considerable differences for haplotype 2 that was over-represented in the patients (28:10) and for haplotype 1 that was over-represented in the internal control group (57:75) formed by the non-transmitted parental haplotypes. Statistical analysis using the Monte Carlo version of the multi-allele Tm revealed a significant association of the investigated gene region with CAE (value of Tm statistic 12.091972, P=0.007075) (Table 3).
Haplotype frequencies and statistics
| Patients (n=45) | Internal controls (90 chromosomes) | MCT_m TDTa | |
|---|---|---|---|
| Haplotype 1 | 57 | 75 | |
| Haplotype 2 | 28 | 10 | P=0.007075 |
| Haplotype 3 | 0 | 1 | |
| Haplotype 4 | 5 | 4 | |
| Patients (n=45) | Internal controls (90 chromosomes) | MCT_m TDTa | |
|---|---|---|---|
| Haplotype 1 | 57 | 75 | |
| Haplotype 2 | 28 | 10 | P=0.007075 |
| Haplotype 3 | 0 | 1 | |
| Haplotype 4 | 5 | 4 | |
aMonte Carlo Version with one million shuffles.
Functional analysis of the GABRB3 gene promoter haplotypes
Because of the fact that mutation screening of the exons and exon–intron boundaries of the GABRB3 gene upstream of intron 3 did not identify any functionally relevant nucleotide exchanges, we proposed that sequence variations located in the promoter region could be the basis for this significant association between GABRB3 gene haplotypes and CAE. To test this hypothesis, in vitro luciferase reporter gene assays were performed. For that, we subcloned different haplotypes of GABRB3 exon 1a promoter sequences (nucleotides −979 to −4, numbering with respect to the initiator methionine of exon 1a) into the promoterless luciferase reporter plasmid pGL3-Enhancer. These promoter constructs were transiently transfected in parallel into a human neuronal-like cell line (NT2) and into non-neuronal human embryonic kidney 293 (HEK293) cells, in order to compare their ability to drive luciferase gene expression as a measure for their transcriptional activities. The relative levels of luciferase expression with these constructs are shown in Figure 1B. In NT2 cells, as hypothesized, haplotype 2 promoter constructs conferred significantly lower transcriptional activity than haplotype 1 promoter constructs. In HEK293 cells, none of the exon 1a promoter constructs exhibited promoter activity, as their activity did not exceed the activity of the promoterless control plasmid pGL3-enhancer transfected in parallel (data not shown).
Bioinformatic analysis of the GABRB3 exon 1a promoter haplotypes
To assess the functional importance of sequence variations in the GABRB3 exon 1a promoter region, we performed a sequence analysis of the exon 1a promoter SNP regions. We identified two SNPs that are located within transcription factor binding consensus sites. SNP rs20317, located at position −66, generates an exchange from C (haplotype 1) to G (haplotype 2) resulting in a potential loss of binding of the ubiquitous transcriptional factor c-Myb. More interestingly, in this context, SNP rs4906902 at position −897, is located in the centre of the consensus sequence for the neuron-specific transcription factor N-Oct-3. In silico results suggested that the exchange from T (haplotype 1) to C (haplotype 2) at this position impairs the N-Oct-3 binding site.
Because of the fact that the GABRB3 exon 1a promoter did not show transcriptional activity in HEK293 cells (data not shown), we concluded that not the potential loss of binding of the ubiquitous transcription factor c-Myb, but the putative reduced binding of the neuron-specific transcription factor N-Oct-3 in the haplotype 2 promoter could underlie the reduced transcriptional activity of haplotype 2 in neuronal-like NT2 cells.
Determination of altered nuclear protein binding by electrophoretic mobility shift assay (EMSA)
To investigate a possible reduced binding of transcription factors, EMSAs were performed in order to determine whether DNA–protein interaction occurs in the GABRB3 exon 1a promoter region containing the −897 T/C polymorphism and whether such interaction may account for the difference in the transcriptional activity of the two haplotypes.
For that, double-stranded −897 T oligonucleotide probes (haplotype 1) were end-labeled with (γ-33P) ATP and incubated with nuclear extract proteins from the neuronal-like cell-line NT2. The formed DNA–protein complexes were separated by gel electrophoresis. As shown in Figure 2, three major DNA–protein complexes (C1, C2 and C3) could be detected with the (γ-33P)-labelled −897 T probe (lane 2) using nuclear extracts from NT2 cells. Formation of these major DNA–protein complexes was not affected in the presence of an excess of an oligonucleotide encoding the binding site for the unrelated transcription factor AP2 (lane 9) indicating that this binding was specific. The formation of three complexes is in good agreement with previous reports (27,28) describing that during nuclear extract preparation, in vitro proteolysis generates two additional proteins which can also bind to the N-Oct-3 sequence motif. Thus, binding of intact N-Oct-3 should correspond to the DNA–protein complex C1, whereas C2 and C3 should represent the DNA–protein complexes of the two degradation products. Unfortunately, no N-Oct-3 antibody is currently available that could be used for supershift assays to confirm the identity of these three complexes.
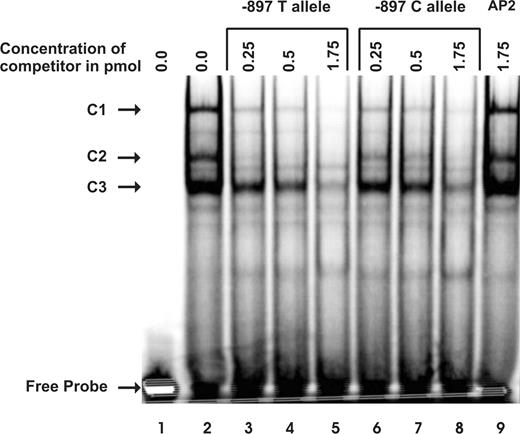
Electrophoretic mobility shift analysis investigating the −897 C/T polymorphism. Nuclear extract protein (5 µg) from the neuronal-like cell-line NT2 was incubated with radioactively labelled −897 T oligonucleotide probe alone (lane 2), or in the presence of an excess of unlabelled AP2 oligonucleotide as a non-specific displacer (lane 9), or with increasing amounts of unlabelled −897 T (lanes 3–5) or −897 C (lanes 6–8) oligonucleotides. Probe incubated in the absence of nuclear protein is shown in lane 1. Samples were loaded on a 6% native acrylamide gel. The positions of the complexes C1, C2 and C3 and that of the free probe are indicated by arrows.
The formation of these complexes was partially inhibited by increasing amounts of the competing unlabelled −897 T probe (lanes 3–5) or −897 C probe (lanes 6–8). Interestingly, comparison of lanes 3–5 with lanes 6–8 indicated differences in the effectiveness of the two alleles as competitors for protein binding. Thus, when complexes C1, C2 and C3 were compared in lanes 3 and 6, labeling was 30, 80 and 35% higher in lane 6, respectively, than in lane 3. Similar results were obtained when lanes 4 and 7, or lanes 5 and 8 were compared. These data indicated that the −897 T to C alteration may indeed reduce nuclear protein binding affinity.
DISCUSSION
Based on the results of a previous association study (20), we performed a mutation screen in the GABRB3 gene of these patients to detect genetic alterations that could contribute to the development of CAE. We did not find amino acid exchanges in the coding regions or polymorphisms in the potential exon–intron splice sites that could play a role in the pathogenesis of CAE in our patient group. Therefore, we assumed that the disease-causing genetic variations may be located in the GABRB3 gene regulatory regions. We defined four haplotypes for the region upstream of the previously associated microsatellite marker 155CA2 for a subsequent association analysis. Results indicated that haplotype 2 of GABRB3 is associated with CAE. As haplotype 2 shares either the 107 bp or the rare 103 bp allele of the microsatellite marker 155CA2 formerly shown to be over-represented in the CAE patient group, the present results support and extend our previous findings (20).
Using an in vitro luciferase reporter gene assay we demonstrated that haplotype 2 of the GABRB3 exon 1a promoter has a significantly lower transcriptional activity than haplotype 1 in the neuronal-like cell line NT2. A possible reason for a lower transcriptional activity was indicated by in silico analysis of the 976 bp promoter region upstream of exon 1a, predicting that the −897 C allele present in the haplotype 2 promoter sequence should impair the potential binding site of the neuron-specific transcriptional activator N-Oct-3. This prediction was confirmed by gel shift assays indicating a reduced nuclear protein binding affinity of the respective haplotype 2 sequence when compared with the analogous haplotype 1 sequence. N-Oct-3, the human equivalent of the mouse Brn-2 protein, is a key player in the regulation of transcription of many genes and any imbalance in its expression has critical consequences (29). N-Oct-3 is also a neuronal transcription factor that is widely expressed in the developing mammalian central nervous system and is necessary to maintain neural cell differentiation (30).
Interestingly, the GABRB3 gene is also highly expressed in neonatal rat brain, where it is the most significant β-type subunit present at this stage (18). In human brain two β3 subunit transcripts with alternative first exons (exon 1a and exon 1, respectively) are expressed (26). The exon 1a transcript is enriched in fetal brain but markedly depleted in adult hippocampus (26). Therefore, it is thought that exon 1a regulation is important for early neuronal development. Consequently, the effects of GABRB3 gene mutations might appear in a limited time frame, and the genes might be switched on or off as a function of age, controlling the predisposition, expression, modulation and temporal sequence of childhood-onset IGEs. Congruently, CAE is characterized by an age-dependent onset, and in the majority of the CAE patients absences disappear with age (31,32).
Direct evidence that a reduction of GABRB3 expression can result in epilepsy is provided by the characteristics of the gabrb3 gene knockout mice. These mice exhibit a high incidence of neonatal mortality, cleft palate, seizures as well as EEG abnormalities, often associated with arrested behavior resembling an absence seizure (33). Moreover, our results correspond with the concept of the pathophysiological mechanisms of absence seizures studied in various animal models with generalized spike and wave discharges associated with behavioral arrest (34–37). It appears that generalized spike and wave discharges are generated and sustained by highly synchronized abnormal oscillatory rhythms in thalamocortical networks that mainly involve neocortical pyramidal cells, the reticular thalamic nucleus, and the relay nuclei of the thalamus (36). In case of a reduced GABRB3 expression level, the number of GABAA receptors in the thalamic reticular neurons is also reduced, as the β3 subunit is the most abundant GABAA receptor subunit in early development (18). A reduced GABAergic inhibition between the thalamic reticular neurons leads to an increase in their pacemaking capacity and therefore to an increased likelihood of generating absence seizures. This concept corresponds to the observed increased hypersynchrony of thalamic network activity in gabrb3 knockout mice (38).
In summary, in this study, we not only demonstrated that the haplotype 2 of the GABRB3 gene is associated with CAE, but we also could identify functional consequences of the underlying genetic alterations. Thus, we demonstrated that the disease-associated exon 1a promoter haplotype 2 causes a significantly reduced transcriptional activity when compared with the exon 1a promoter haplotype 1 over-represented in the controls. Thus, reduced expression of the GABRB3 gene could be one potential cause for the development of CAE, pathogenetically relevant not only for a single patient or a single family but for a distinct patient group. Because of the fact that not all patients harbor the haplotype 2 exon 1a promoter, further studies have to be performed in patients suffering from CAE to get to know the pathogenetic role of other candidate genes important in the pathophysiology of absence seizures. One of these genes, CACNA1H, encoding the α1H subunit of the T-type Ca2+ channel, has already been reported to be a further susceptibility gene for CAE (39–42), although, a subsequently performed linkage analysis provided no evidence for a CAE locus in the CACNA1H region (43).
Furthermore, the number of patients has to be increased for grouping them according to different outcomes such as remission, improvement or persistence of absence seizures with age, development of generalized tonic clonic seizures during adolescence or later on in adulthood. This might allow to clarify a possible relationship between the disease underlying genetic causes and the course of the disease.
MATERIALS AND METHODS
Subjects and diagnosis
Subjects investigated in this study were taken from the previously studied CAE trios (20) recruited by the outpatient division for seizure disorders at the Department of Child and Adolescent Neuropsychiatry, Medical University of Vienna. Diagnosis of CAE, inclusion/exclusion criteria and pre-entry confirmatory examinations have been already described (20). Patients and/or their parents had to provide informed written consent. The study was performed according to a protocol approved by the Local Ethical Committee.
DNA isolation and SSCP analysis
High molecular weight genomic DNA was extracted from each blood sample using the Nucleon BACC3 kit (Amersham Biosciences). DNA from 45 CAE patients was used to screen for polymorphisms in the GABRB3 gene by SSCP analysis. Fragments containing the GABRB3 exons including all exon–intron boundaries were amplified by PCR. The oligonucleotide primers and the PCR conditions used have been published (25). Briefly, 100 ng of genomic DNA was amplified using 5 pmol each of the forward and reverse exon primer, 2.0 mm dNTPs, 1× PCR buffer (Qiagen) and 0.5 U Qiagen Taq DNA polymerase in a final volume of 25 µl. Formamide solution (95% formamide, 20 mm EDTA, 10 mm NaOH, 0.02% bromophenol blue, 0.02% xylene cyanol) of 4 µl was added to 4 µl of PCR product. After denaturation for 5 min at 95°C and cooling on ice, each sample was loaded immediately on a CleanGel 48S (Amersham Biosciences) equilibrated with the rehydration buffer. Electrophoresis was performed using the Multiphor II Electrophoresis Unit (Amersham Biosciences). Gels were subsequently silver-stained with PlusOne Silver Staining Kit (Amersham Biosciences) and analyzed for possible band shifts. A modification of SSCP, called restriction fragment fingerprinting was used for longer amplicons (300–600 bp). For that, the PCR fragments were digested with restriction endonucleases, denatured and then scanned for mutations by non-denaturing gel electrophoresis as described earlier.
Sequencing analysis
The results of SSCP analysis were confirmed by sequencing both strands of the DNA fragments with different ssDNA-mobility-patterns (custom sequencing performed by VBC-BIOTECH Services GmbH, Vienna).
SNP genotyping
The diallelic haplotype-tagging SNPs listed in Table 1 were all typed by PCR–RFLP analysis. PCR primers flanking the polymorphisms were designed using the Primer3 program (http://frodo.wi.mit.edu/cgi-bin/primer3/primer3_www.cgi). All SNPs were amplified by the same procedure. Briefly, 100 ng of genomic DNA was amplified using 5 pmol each of the forward and reverse primer (Supplementary Material, Table S1), 2.0 mm dNTPs, 1× PCR buffer with or without Q-solution (Qiagen) and 0.5 U Qiagen Taq DNA polymerase in a final volume of 25 µl. Cycling conditions were 95°C for 2 min, followed by 35 cycles of 94°C for 30 s, annealing at the appropriate temperature for 30 s, and synthesis at 72°C for 30 s and finally, a 2 min extension at 72°C. PCR products were digested with the appropriate restriction enzyme (Table 1), according to the manufacturer's protocol. Digested products were run on agarose gels, stained with ethidium bromide and scored by UV visualization.
Reporter plasmid construction
Recombinant plasmids for reporter gene assays were constructed by cloning DNA fragments from the exon 1a promoter region of the GABRB3 gene representing haplotype 1 and haplotype 2, respectively, into the reporter vector pGL3 Enhancer (Promega, Mannheim, Germany), which contains an SV40 enhancer located downstream of the luciferase gene but lacks upstream eukaryotic promoter. The enhancer containing reporter vector was chosen to facilitate the detection of weak promoters. The exon 1a promoter region, a 976 bp fragment spanning from −979 to −4 (numbering with respect to the initiator methionine of exon 1a; GenBank accession no. NT_026446) was PCR amplified from genomic DNA of probands that were homozygous for either haplotype 1 or haplotype 2 using gene-specific primers containing either a SacI (forward primer) or a BglII (reverse primer) restriction site at their 5′ end. PCR was performed using AccuPrime GC-rich DNA polymerase (Invitrogen) according to the manufacturer's protocol. The nucleotide sequences of all constructs were verified by sequence analysis as described earlier. Plasmid DNA used for transfection was isolated using the EndoFree Plasmid Maxi kit (Qiagen GmbH, Hilden, Germany).
Cell culture and luciferase assay
HEK293 cells (ATCC #CRL1573) and NT2 cells (Ntera2/D1, human neuronal-like teratocarcinoma cells) (Stratagene) were maintained in Dulbecco‘s Modified Eagle Medium high glucose (Life technologies) supplemented with 10% fetal calf serum, 2 mm glutamine, 100 U/ml penicillin and 100 µg/ml streptomycin at 37°C in an atmosphere of 5% CO2 using standard cell culture techniques as described previously (44). Cells were plated at a density of 1.5–2.5×10⁵ per well of a six-well cluster plate (Costar Europe Ltd., The Netherlands), 16–22 h before transfection. Cells were transfected with 3.3 µg of pGL3 test plasmid per well using the calcium phosphate precipitation method (45,46). Forty hours after transfection, culture medium was removed from transfected cells, cells were washed once with phosphate-buffered saline (PBS) solution and lysed with 500 µl 1× Glo Lysis Buffer (Promega) per well. Protein concentration of the lysates was determined using the BCA Protein Assay system (Pierce, Rockford, IL, USA). Aliquots of the lysates were assayed for luciferase activity using the Bright-Glo™ Luciferase Assay System (Promega). A promoterless pGL3 enhancer-vector defined the base line for promoter activity, whereas a pGL3 luciferase gene construct with SV40 promoter and enhancer (pGL3 control, Promega) served as a positive control for luciferase expression and a monitor for transfection efficiency in every experiment. Initial experiments used co-transfection with an SV40-β-galactosidase reporter vector for normalization of the data. This approach was abandoned because of strong interaction between the two promoter constructs (substantial luciferase activity determined in single transfections was dramatically reduced in co-transfections), as reported in other systems (47). All transfections were performed in triplicate; each experiment was repeated at least six times. In order to exclude that differences in the purity of the various plasmid constructs could affect luciferase expression, experiments were performed with different plasmid preparations.
Preparation of nuclear cell extracts
Nuclear extracts from NT2 cells were prepared from 90% confluent cultures in 100 mm2 dishes. All extraction procedures were performed on ice with ice-cold reagents. Cells were washed twice with 2 ml of PBS and lysed by the addition of 0.5 ml of hypo-osmotic buffer (10 mm HEPES-KOH, pH 7.9; 10 mm KCl; 1.5 mm MgCl2; 1 mm DTT; 0.4% Nonidet P-40; 1 tablet Complete™ Mini EDTA free protease inhibitor (Roche) was added before use per 10 ml solution) directly to the plate. After an incubation of 10 min at room temperature, the lysates were scraped from the plates and centrifuged at 4°C, 15 000g for 3 min. The pelleted nuclei from one plate were resuspended in 150 µl of high-salt buffer (20 mm HEPES-KOH, pH 7.9; 420 mm NaCl, 1.5 mm MgCl2, 0.2 mm EDTA, 25% glycerol, 1 mm DTT and 1 tablet Complete™ Mini EDTA free protease inhibitor, Roche, was added before use per 10 ml solution) to solubilize the DNA-binding proteins. The suspended nuclei were vigorously shaken for 90 min at 4°C and centrifuged (20 min, 15 000g, 4°C). The clear supernatants containing the nuclear proteins were stored in small aliquots at −80°C until used for EMSA. Protein concentration was determined using the BCA Protein Assay system (Pierce) as described earlier.
Electrophoretic mobility shift assay
Complementary oligonucleotides to detect the −897 SNP were synthesized by VBC-BIOTECH Service GmbH, Vienna (forward 5′-TATATTTAAAATTAATGCACAG-3′ and reverse 5′-CTGTGCATTAATTTTAAATATA-3′ for the −897 T variant, and forward 5′-TATATTTAAAATCAATGCACAG-3′ and reverse 5′-CTGTGCATTGATTTTAAATATA-3′ for the −897 C variant). The two −897 variant-specific double-stranded oligonucleotides were generated by heating the complementary oligonucleotides in a buffer solution (10 mm Tris–HCl, pH 7.5; 20 mm NaCl) at 95°C for 5 min, and then allowed to cool to room temperature. For EMSA, oligonucleotide probes were end-labeled with (γ-33P) ATP (3000 Ci/mmol, Hartmann Analytic, Germany) using T4 polynucleotide kinase (Promega) and purified on MicroSpin G-25 columns (Amersham Biosciences). Unlabelled double-stranded oligonucleotides were used as sequence-specific competitors. Consensus AP2 oligonucleotide (Promega) was also used as a non-specific competitor. Binding was performed in a 10 µl reaction mixture using the Gel Shift Assay Systems (Promega). Five micrograms of nuclear proteins were pre-incubated in gel shift binding buffer with or without unlabelled DNA competitor at 23°C for 15 min before labeled probe was added and incubated at 23°C for another 20 min. The DNA–protein complexes formed were resolved on 6% DNA retardation gels (Novex). Electrophoresis was carried out in 0.5× TBE buffer at 250 V for 25 min. The dried gel was analyzed using phosphorimaging instrumentation [Personal Molecular Imager FX (Bio-rad) and Quantity One Quantitation Software (Bio-rad)].
Statistics
For association analysis, a nuclear family-based candidate gene approach was applied. In families ascertained for the presence of an affected child, the genotype of the affected offsprings (made up of the transmitted parental haplotypes) was used as the case sample, and an artificial genotype derived from the non-transmitted parental haplotypes formed the affected family-based control sample. This matched design for patient (parental transmitted) and control (parental non-transmitted) marker alleles avoid ethic confounding in the case of a stratified population (48). The null hypothesis of no marker association with the disease was tested using MCT_m, a Monte Carlo Version of the multiallele transmission disequilibrium test (TDT) for nuclear family data (49), with one million shuffles (code by E.R. Martin, obtained from ftp://statgen.ncsu.edu/pub/martin/Mctest). For that, the table of transmitted and non-transmitted parental allele pairs was computed and passed as input to the MCT_m program.
The TDT originally was proposed as a test of linkage in the presence of association. If the sample consists of only nuclear families with a single affected child, then the TDT also can be used to test for association in the presence of linkage. The use of Monte Carlo randomization techniques is recommended if the sample size is small, to guard against an overly conservative test. Regardless of the test statistic, this procedure always leads to a test with a significance level close to the nominal value (49,50).
In transient transfection experiments, haplotype 1 promoter activity was referred as reference activity and consecutively, haplotype 2 activities were given as the percentage of haplotype 1 activities. Differences between haplotype 1 and haplotype 2 promoter activities were analyzed non-parametrically and statistical significance was determined by Mann–Whitney test.
In silico prediction of putative transcription factor binding sites
Putative transcription factor binding sites were identified using the TFSEARCH program using the Transcription Factor Binding Sites Database, version 1.3, Japanese Genome Center (http://www.cbrc.jp/research/db/TFSEARCH.html) and the TESS-String-Based Search of the Transcription Factor Database (http://www.cbil.upenn.edu/tess/).
SUPPLEMENTARY MATERIAL
Supplementary Material is available at HMG Online.
ACKNOWLEDGEMENTS
We thank Professor Werner Sieghart for continuous interest and support and valuable discussions, Susanne Karall and Mirjana Stojanovic for their excellent technical assistance. This work was supported by the Jubiläumsfonds der Stadt Wien für die Österreichische Akademie der Wissenschaften (Project No. J/25/00) and by the Jubiläumsfonds of the Austrian National Bank (Project No. 9976).
Conflict of Interest statement. The authors declare that they have no conflicts of interest.
