


Abstract
This study sets out to identify novel susceptibility genes for late-onset Alzheimer's disease (LOAD) in a powerful set of samples from the UK and USA (1808 LOAD cases and 2062 controls). Allele frequencies of 17 343 gene-based putative functional single nucleotide polymorphisms (SNPs) were tested for association with LOAD in a discovery case–control sample from the UK. A tiered strategy was used to follow-up significant variants from the discovery sample in four independent sample sets. Here, we report the identification of several candidate SNPs that show significant association with LOAD. Three of the identified markers are located on chromosome 19 (meta-analysis: full sample P = 6.94E − 81 to 0.0001), close to the APOE gene and exhibit linkage disequilibrium (LD) with the APOEε4 and ε2/3 variants (0.09 < D′<1). Two of the three SNPs can be regarded as study-wide significant (expected number of false positives reaching the observed significance level less than 0.05 per study). Sixteen additional SNPs show evidence for association with LOAD [P = 0.0010-0.00006; odds ratio (OR) = 1.07–1.45], several of which map to known linkage regions, biological candidate genes and novel genes. Four SNPs not in LD with APOE show a false positive rate of less than 2 per study, one of which shows study-wide suggestive evidence taking account of 17 343 tests. This is a missense mutation in the galanin-like peptide precursor gene (P = 0.00005, OR = 1.2, false positive rate = 0.87).
INTRODUCTION
Late-onset Alzheimer's disease (LOAD) is an age-related neurodegenerative disease primarily affecting learning and memory. Two recently published studies suggest that the heritability of AD (proportion of phenotypic variance in the population attributable to genes) is in the range of 60–80%, with the balance of variance attributable to unique (typically adult) environmental influences (1,2). The only known genetic risk factor is the apolipoprotein E (APOE) gene. The APOE4 allele is highly enriched in AD cases when compared with non-demented individuals, whereas the APOE2 allele is under-represented in cases (3). However, only 50% of AD cases carry an APOE4 allele and several additional putative LOAD susceptibility loci have been identified through linkage studies (4).
In addition to linkage studies, many association studies have examined specific candidate genes as risk factors for disease, often through single nucleotide polymorphism (SNP)-based disease association studies (http://www.alzgene.org). Early association studies generally tested SNPs in one or a small number of selected biological and/or positional candidate genes at a time, but recent reports, including those from our groups, have expanded the search by testing a large number of SNPs from within linkage regions and/or whole chromosomes (5–7). These recent studies have led to the identification of various novel candidate genes that may contribute to the etiology of LOAD, including DAPK1 on chromosome 9 (8), GAPD and its homolog on chromosome 12 (5) and an RPS3A homolog and several others on chromosome 10 (6,7). Both, DAPK1 and GAPD, are regulators of neuronal apoptosis and RPS3A is also involved in the apoptotic process. These genetic variants have been replicated to various degrees in several of the case–control sample sets we have tested but show relatively small-to-moderate effect sizes. As such, definitive conclusions concerning their potential involvement in conferring susceptibility will require further studies and meta-analyses.
In the absence of convincing evidence that explains most of the genetic contribution to LOAD risk, a more thorough investigation is warranted. Perhaps, the best and most comprehensive approach may be an SNP-based, genome-wide association study. Fortunately, such a study design has become feasible and has been applied successfully in other studies in the search for risk factors of common complex genetic diseases (9,10). Two strategies that utilize current knowledge and technology are commonly used: the linkage disequilibrium (LD) approach interrogates independent, position-specific markers that tag a large number of haplotype blocks to narrow the location of susceptibility alleles and the other study design directly tests potentially causative mutations; this requires making assumptions about the effect a mutation may have on gene or protein function. The latter study design may provide a focused strategy to directly identify a disease relevant mutation. Here, we describe findings from a large-scale, genome-wide SNP-based association study of LOAD. We have screened 17 343 putative functional variants across the genome using a large, well-characterized case–control sample set collected in the UK and followed up on a subset of markers in four sample sets from the UK and USA. We show that markers in LD with APOE were successfully identified from this screen and that other novel susceptibility genes show evidence of association with LOAD.
RESULTS
To identify novel genetic variants that predispose to LOAD, we performed SNP-based association studies in up to five independent, case–control sample sets, totaling 1808 cases and 2062 controls. Our overall strategy was first to generate a short list of candidate variants that met the follow-up criteria, through testing a large number of SNPs in DNA pools from one set of cases and controls (UK1, Fig. 1A). Those SNPs that met previously defined significance criteria were typed in DNA pools from a second set of cases and controls (WU: Fig. 1B). Markers that satisfied threshold criteria from these first two rounds of pooled genotyping were individually genotyped in four sets of cases and controls (UK1, WU, SD and UK2). Finally, markers showing the most evidence of association (P < 0.01) were genotyped in the fifth sample (UK3). The effect size and significance of the association with LOAD were calculated for each sample set and for all sample sets combined (see Materials and Methods, statistical analysis section).
![Discovery sample results and follow-up strategy. (A) Allelic P-values for 17 339 SNPs in DNA pools of the UK1 sample set. SNPs are plotted according to chromosome and position. Four SNPs [rs1331212 (chr. 6), rs157581 (chr. 19), rs405509 (chr. 19) and hCV3098650 (chr. 19, 57.7 Mb)] with allelic P-values < 0.00001 have been omitted from the graph. U: chromosome or position on a chromosome is unknown. (B) Number of unique SNPs that were tested in the specified sample sets. Allele frequency refers to data derived from DNA pools.](https://oup.silverchair-cdn.com/oup/backfile/Content_public/Journal/hmg/16/8/10.1093_hmg_ddm031/1/m_ddm03101.jpeg?Expires=1716433231&Signature=oKfLl9MRl2xODreHi71eCVRE4sSnzrMhbhPlI0tCi-ehwg6hJHnvZk~4uQQmjglFPFp8Crd2G07D5ZtBlZ6ZDr-KL0cvyliASAqIWEHbCghjvilcIv~IBRcpGP05BKYB0aHF8uiWLsmT305x11EenNTNl5m44Lm9tGZtD0KVloGfiKDxNWnWtOUEoUvkDkT2FZ7BdycG96aPmZP0S9W-Gvli0xDH0~fox~Ljt3Y52EyLQpSC4Bjv~W2S73rIpc~XZRD1u8xi0osf3h~~sKcfm2F7lu6eGBUubHAek958ZRtkEBQw0AS~gKXNPpf7D62ibRIg66O00Hv-jVHcnrnkxQ__&Key-Pair-Id=APKAIE5G5CRDK6RD3PGA)
Discovery sample results and follow-up strategy. (A) Allelic P-values for 17 339 SNPs in DNA pools of the UK1 sample set. SNPs are plotted according to chromosome and position. Four SNPs [rs1331212 (chr. 6), rs157581 (chr. 19), rs405509 (chr. 19) and hCV3098650 (chr. 19, 57.7 Mb)] with allelic P-values < 0.00001 have been omitted from the graph. U: chromosome or position on a chromosome is unknown. (B) Number of unique SNPs that were tested in the specified sample sets. Allele frequency refers to data derived from DNA pools.
The markers we tested were primarily located within genes or promoter regions and targeted putative functional mutations (e.g. non-synonymous, putative transcription factor binding site, 5′/3′-UTR, mouse–man conserved sequence) (Table 1). By prioritizing putative functional mutations for our scan, we expected to increase our chances of finding disease-associated variants that have a direct biological effect and therefore may show a stronger effect than markers that are in LD with the causal mutation.
SNP category
| SNP categories | Count |
|---|---|
| Nonsense | 228 |
| Missense | 12 066 |
| Splice site | 100 |
| ESS | 232 |
| UTR (5′/3′) | 994 |
| Transcription factor binding site | 2 318 |
| Silent mutation | 468 |
| Human–mouse conserved region | 32 |
| Intron | 559 |
| Intergenic/unknown | 346 |
| Sum | 17 343 |
Specifically, hypothesis generation was carried out by first genotyping approximately 20 000 SNPs in pooled cases and controls of the UK1 sample set. Excluding markers of low frequency (minor allele frequency of < 2% in both cases and controls, 2803 markers) and inconsistent allele frequencies between orthogonal pools (assay quality P < 0.01, 193 markers), we tested 17 343 SNPs, located in 11 221 unique genes, for association with disease risk. As small measurement errors in allele frequencies determined from DNA pools can result in false negative as well as false positive findings, we adopted a relaxed significance threshold (generally, P < 0.075, see Materials and Methods) to select markers for further testing in the WU sample set and relied on further testing in independent samples to help reduce false positive findings. The significance threshold in pools was further relaxed for markers in predefined biological candidate genes (P < 0.1, see Materials and Methods), which were selected on the basis of our understanding of AD biology. By applying these thresholds for minor allele frequency, allelic P-value and OR, we identified a total of 1544 markers from the UK1 study for subsequent analysis in the WU pools. Of these, 119 markers met our threshold criteria for the WU sample set (allelic P < 0.15, same risk allele as UK1).
To test further the association of these markers with LOAD, we individually genotyped all 119 markers in the SD sample set and the UK2 sample set. Because spurious associations may arise from measurement and technical errors in the pool-derived allele frequency estimates, we also individually genotyped these 119 markers in the UK1 and WU sample sets and required P < 0.05 for the meta-analysis of UK1 and WU to assess the marker further (90 markers). A meta-analysis combining these four sample sets was then performed and the 19 most significant markers (Pmeta < 0.005) were genotyped in a fifth sample set (UK3), consisting of 503 LOAD cases and 643 matched controls. The results of a meta-analysis of all five sample sets on these 19 markers are presented in Table 2, along with P-values for each sample separately. The P-values given in Table 2 for the meta-analysis were estimated by simulation, in order to account for the multi-stage study design (see Materials and Methods). Of these 19 markers, in the five control samples, Hardy–Weinberg equilibrium was violated at a P < 0.05 level in one test out of 94 (hCV15746640 in UK1), which is less than would be expected by chance.
Markers showing most evidence for association from a meta-analysis of five LOAD case–control sample sets
| Accession no. | Gene symbol | Allelic P-value | OR (95% CI) Full sample | Expected number of false positive | ||||||
|---|---|---|---|---|---|---|---|---|---|---|
| UK1 | WU | SD | UK2 | UK3 | Full sample | |||||
| 1 | rs157581a | TOMM40 | 6.86E − 14 | 3.38E − 14 | 5.1836E − 22 | 2.9394E − 15 | 4.8225E − 24b | <1.0E − 8 | 2.73 (2.46–3.05) | <1.0E − 8 |
| 2 | rs405509a | APOE | 0.000081 | 0.0035 | 0.00010 | 0.000300 | 0.002b | <1.0E − 8 | 1.43 (1.3–1.57) | <1.0E − 8 |
| 3 | rs3745833 | GALP | 0.008 | 0.036 | 0.512 | 0.261 | 0.061b | 0.000050 | 1.2 (1.09–1.32) | 0.87 |
| 4 | rs1554948 | TNK1 | 0.130 | 0.0090 | 0.699c | 0.054 | 0.021b | 0.000063 | 1.19 (1.08–1.3) | 1.10 |
| 5 | rs1132899a | APOC2 | 0.137 | 0.0075 | 0.056 | 0.013 | 0.975c | 0.000076 | 1.19 (1.08–1.3) | 1.32 |
| 6 | rs11622883 | 0.144 | 0.010 | 0.979 | 0.033 | 0.091b | 0.000094 | 1.19 (1.08–1.3) | 1.63 | |
| 7 | rs8192708 | PCK1 | 0.0033 | 0.026 | 0.396 | 0.791c | 0.051b | 0.000099 | 1.29 (1.12–1.49) | 1.72 |
| 8 | rs505058 | LMNA | 0.0119 | 0.150 | 0.357 | 0.171 | 0.261 | 0.00020 | 1.35 (1.13–1.63) | 3.41 |
| 9 | rs3800324 | PGBD1 | 0.204 | 0.026 | 0.502 | 0.317 | 0.146 | 0.00032 | 1.43 (1.13–1.8) | 5.59 |
| 10 | rs6907175 | LOC651924 | 0.017 | 0.304 | 0.042 | 0.957 | 0.00047 | 1.16 (1.04–1.3) | 8.15 | |
| 11 | rs1859849 | 0.0047 | 0.168 | 0.776 | 0.031 | 0.575c | 0.00058 | 1.15 (1.03–1.28) | 10.10 | |
| 12 | hCV22274641d | THEM5 | 0.000031 | 0.109 | 0.647c | 0.169 | 0.467c | 0.00061 | 1.24 (1.05–1.47)e | 10.58 |
| 13 | rs2074877 | MYH13 | 0.017 | 0.029 | 0.664 | 0.931c | 0.742 | 0.00072 | 1.12 (1.02–1.23) | 12.44 |
| 14 | hCV15746640d | CTSS | 0.0008 | 0.031 | 0.595c | 0.116 | 0.293c | 0.00078 | 1.21 (1.02–1.42)e | 13.46 |
| 15 | rs444013 | UBD | 0.010 | 0.042 | 0.299 | 0.741c | 0.845c | 0.00079 | 1.11 (1.01–1.22) | 13.77 |
| 16 | rs9608099 | BCR | 0.261 | 0.0018 | 0.651c | 0.134 | 0.197c | 0.00097 | 1.09 (0.99–1.21)e | 16.81 |
| 17 | rs2882676 | AGC1 | 0.076 | 0.033 | 0.358 | 0.375 | 0.050c | 0.0010 | 1.07 (0.97–1.18)e | 17.22 |
| 18 | rs13022344 | TRAK2 | 0.0051 | 0.0077 | 0.821c | 0.628 | 0.015c | 0.0010 | 1.07 (0.97–1.18)e | 17.35 |
| 19 | rs11016976 | EBF3 | 0.050 | 0.024 | 0.294 | 0.966 | 0.033c | 0.0010 | 1.08 (0.95–1.24)e | 17.47 |
aSNPs that are in LD with APOE ε2/3/4.
bEvidence of replication in UK3 (P < 0.05, one-tailed).
cOpposite allele associated, compared with UK1 and WU.
dSNPs that map to reported AD linkage regions.
eSignificant (P < 0.05) evidence for heterogeneity of OR between samples.
Of the 19 markers in Table 2 (SNP genomic position and function are in Table 3), three are located near the APOE locus on chromosome 19 (rs157581, rs405509 and rs1132899). The LD of these three markers with the APOE ϵ4 and ϵ2/3 markers is between 0.92 and 0.088 (D′) and 0.66 and 0.001 (r2, Supplementary Material, Table S2). To determine whether these markers increase disease risk independently of APOE ϵ2/3/4, we calculated P-values adjusted for either rs429358 (ϵ4-allele) or rs7412 (ϵ2/3-allele) (Table 4). Although these three markers show a wide spread of LD with the APOE alleles, none of the three markers increases LOAD risk independently of rs429358 and rs7412. The 16 other markers had effect sizes ranging between 1.07 and 1.45 in the multi-sample meta-analysis and several map to known linkage regions, biological candidate genes and novel genes.
Genomic position and function of the most significant markers from a meta-analysis of five LOAD case–control sample sets
| Accession no. | SNP type | Gene symbol | Gene name | Chromosome | Position (Mb) |
|---|---|---|---|---|---|
| hCV15746640 | Missense (Celera) | CTSS | Cathepsin S | 1 | 147.55 |
| hCV22274641 | Missense (Celera) | THEM5 | Thioesterase superfamily member 5 | 1 | 147.79 |
| rs505058 | Silent | LMNA | Lamin A/C | 1 | 152.92 |
| rs13022344 | Missense | TRAK2 | Trafficking protein, kinesin binding 2 | 2 | 202.09 |
| rs3800324 | Missense | PGBD1 | PiggyBac transposable element derived 1 | 6 | 28.37 |
| rs444013 | UTR3 | UBD | Ubiquitin D | 6 | 28.37 |
| rs6907175 | UTR3 (Celera) | LOC651924 | Homolog to ubiquitin-like 1-activating enzyme E1B (SUMO-1-activating enzyme subunit 2) | 6 | 142.43 |
| rs1859849 | Intergenic | 7 | 25.49 | ||
| rs11016976 | TFBS (Celera) | EBF3 | Early B-cell factor 3 | 10 | 131.54 |
| rs11622883 | Intergenic | Near EST DA712292 and SERPINA13 | 14 | 94.23 | |
| rs2882676 | Missense | AGC1 | Aggrecan 1 | 15 | 87.2 |
| rs1554948 | Silent (Celera) | TNK1 | Tyrosine kinase, non-receptor, 1 | 17 | 7.23 |
| rs2074877 | Missense | MYH13 | Myosin, heavy polypeptidel 3 | 17 | 10.16 |
| rs157581 | TFBS (Celera) | TOMM40 | Translocase of outer mitochondrial membrane 40 homolog | 19 | 50.09 |
| rs405509 | Intergenic | APOE | Apolipoprotein E | 19 | 50.1 |
| rs1132899 | Missense | APOC2 | Apolipoprotein C-11 | 19 | 50.14 |
| rs3745833 | Missense | GALP | Galanin-like peptide precursor | 19 | 61.39 |
| rs8192708 | Missense | PCK1 | Phophoenolpyruvate carboxykinase 1 (soluble) | 20 | 55.57 |
| rs9608099 | UTR5 (Celera) | BCR | Breakpoint cluster region | 22 | 21.96 |
Significance of markers near the APOE locus after correction by other markers
| Correction SNP | ||||||
|---|---|---|---|---|---|---|
| rs157581 | rs405509 | rs429358 | rs7412 | rs1132899 | ||
| Evaluated SNP | rs157581 | 7.1E − 59 | 1.3E – 46 | 8.5E – 01 | 4.8E – 55 | 1.6E – 51 |
| rs405509 | 1.3E – 03 | 1.9E – 13 | 7.4E – 01 | 9.8E – 08 | 4.4E – 12 | |
| rs429358 | 4.5E – 35 | 2.2E – 74 | 2.6E – 97 | 2.9E – 79 | 1.6E – 79 | |
| rs7412 | 2.6E – 13 | 2.1E – 06 | 2.3E – 04 | 4.1E – 12 | 3.9E – 11 | |
| rs1132899 | 4.9E – 03 | 1.9E – 04 | 1.3E – 01 | 2.8E – 05 | 1.7E – 05 | |
rs429358 determines whether the ϵ4 allele of APOE is present or absent. rs7412 determines whether the ϵ3 or ϵ2 allele of APOE is present. The diagonal contains the single marker P-values.
Note: results are for UK1, WU, SD and UK2 samples sets combined.
Excluding the three SNPs associated with APOE, four of the other 15 SNPs successfully genotyped in the UK3 sample showed evidence of association with LOAD and the same risk allele as the four sample set meta-analysis (two-sided P < 0.1 in Table 2, corresponding to a single-sided P < 0.05). These SNPs are in TNK1, GALP and PCK1, as well as an intergenic SNP near SERPINA13 (see Table 3 for SNP genomic position and function). The probability of observing four or more associated SNPs out of the 15 by chance is P = 0.0055. This result suggests that the non-APOE-associated SNPs are enriched with markers that are truly associated with LOAD. Furthermore, a meta-analysis of all five sample sets shows that two of the three APOE-associated SNPs have study-wide significance (TOMM40 and APOE intergenic SNPs), as the expected number of false positive results at least as extreme as the observed result per study is less than 0.05 (final column, Table 2). A missense mutation in the GALP gene showed study-wide suggestive evidence of association with LOAD (expected false positives per study of 0.87). It is also of interest that a total of four SNPs (in addition to the three APOE markers) achieved a P-value expected to be achieved less than twice per study.
These results are based on analyses of allelic odds ratios (ORs), i.e. assuming a multiplicative model for genotypic relative risks. Tests of recessive effects were performed for each homozygous genotype.
Of the 19 SNPs in Table 2, only the two APOE-associated SNPs achieved study-wide significance. None of the remaining 100 SNPs achieved the significance criteria for genotyping in the UK3 sample set.
DISCUSSION
To the best of our knowledge, this is the first reported genome-wide, association study in LOAD, focusing on putative functional SNPs. As with several recently reported genome scans for Parkinson's disease and type-I diabetes (9–15), we have carried out the study sequentially, utilizing multiple comparable case–control sample sets. This should help to effectively reduce the number of false positive findings. We observed strong evidence of association between markers associated with APOE, two of which reached study-wide significance following correction for multiple testing (17 343 tests) and had a false positive rate of less than 1 under simulation. In addition to the three APOE markers, four SNPs achieved a P-value expected to be observed less than twice per study (i.e. intergenic SNP—chromosome 14, GALP, TNK1 and PCK1). A missense mutation in a novel candidate gene, encoding a galanin-like peptide precursor (GALP), showed study-wide, suggestive evidence of association with LOAD (locus-specific P = 0.00005) and a false positive rate of less than 1 per study. It is noteworthy that a sample size of 3900 cases and 3900 controls would be required to achieve 80% power to detect association with a variant such as that observed in GALP, with an OR of 1.2, and a minor allele frequency of 0.35 with a locus-specific P-value corresponding to study-wide significance. Thus, it is possible that our study has missed some genuine small effects.
Excluding the three markers near the APOE locus, a total of 15 SNPs on 11 chromosomes had a P-value of less than 0.005 in the meta-analysis, including all five sample sets. The effect sizes of these markers are rather modest (1.07–1.45), consistent with the common disease—common variant hypothesis. However, we expect that some of these markers represent chance findings and markers that are genuinely associated with LOAD may be in LD with the causative mutation, despite our strategy to test putative functional SNPs. Thus, validation studies of these markers in other sample sets will be critical to further clarify their absolute significance. Furthermore, additional dense genotyping in these candidate regions may be required to pinpoint the causal variant(s). However, the results of the final follow-up study in the UK3 sample show significant relationships (one-sided P-value < 0.05) with four of the 15 most significant SNPs. The probability of this observation being due to chance is P = 0.0055. It therefore appears unlikely that all the novel associations identified are false positives.
This study therefore provides a broader list of SNPs that warrant further validation in other sample sets. The fact that the three most significant SNPs are located near the APOE locus serves to validate our approach, which selected markers for follow-up by comparing estimated allele frequency information from DNA pools rather than individual DNA samples. A similar strategy has been used to identify genetic risk factors of myocardial infarction (16) and advanced fibrosis associated with chronic hepatitis C (17). Errors in allele frequency estimates in DNA pools can have a significant impact on advancing individual markers for further testing, particularly those with modest genetic effect. In contrast, because our scan only covers about one-third of all annotated genes and because we adopted a gene-centric rather than LD-based method to select SNPs, we cannot make a comprehensive assessment as to whether factors with an effect size as great as that of APOE4 exist. Another limitation of the study design is that the power to detect recessive effects is very low in pooled DNA samples. Thus, this study should not be used to exclude genes as potential risk factors for LOAD.
To a certain extent (e.g. our selection of SNPs heavily favored non-synonymous and gene-centric variants; but other types of SNPs, including those in intergenic regions, may be functional as well), our genome scan is unbiased, free from constraints from the current understanding of AD biology or previous linkage findings and is thus likely to identify novel genetic susceptibility factors. However, it is encouraging that several SNPs do map to regions near known linkage peaks and/or to excellent biological candidate genes. These include several markers on chromosomes 1 and 6. Both Kehoe et al. (18) and Blacker et al. (19) reported a linkage peak on the long arm of chromosome 1. Three significant SNPs from this study are located within the reported peak linkage region. Two SNPs, separated by 240 bp, map to cathepsin S and a gene in the thioesterase superfamily member 5 (THEMS), respectively. Early studies show that over-expression of cathepsin S (CTSS) increases the generation of amyloid β-peptide in transfected human cells and that cathepsin S immunoreactivity is increased in Alzheimer's disease and Down syndrome brain (20,21). The third SNP maps to lamin A/C (LMNA), mutations of which cause a variety of diseases (http://www.ncbi.nlm.nih.gov/entrez/dispomim.cgi?id=150330). For chromosome 6, Blacker et al. (19) reported a strong linkage peak near the telomeric end of the long arm. Our significant SNP rs6907175 is located within the reported linkage peak and maps to a gene homologous to ubiquitin-like 1-activating enzyme E1B or SUMO-1-activating enzyme subunit 2. This gene appears to be an excellent biological candidate gene for AD, as sumoylation directly modulates the production of amyloid β-peptide (22).
Several other markers map to genes that play a role in glucose homeostasis or protein trafficking and signal transduction and therefore present additional candidate genes that could play a role in LOAD. The SNP in GALP (rs3745833) has one of the most significant meta P-values, not considering two markers near the APOE4 locus, and is completely independent of APOE (data not shown). Galanin-like peptide is known to play a role in the control of feeding and body weight/obesity (23), which might indirectly affect the susceptibility to LOAD. The neuropeptide galanin (GAL) modulates cholinergic pathways, such that over-expression inhibits acetylcholine production (24) and impairs memory (25). Several groups have shown that the network of galaninergic fibers within the human cholinergic basal forebrain (CBF) hyperinnervates the surviving cholinergic neurons in the later stages of AD (26). Recently, Mufson et al. (27) observed increased immunoreactive fibers, neurites and plaques in the cortex and hippocampus of mice transgenic for APP and PS-1 mutations. They also showed evidence that GAL remodeling may influence neurofibrillary tangle formation by changing tau phosphorylation in CBF neurons in AD. The SNP, rs11622883 that almost reaches study-wide significance (locus-specific P = 0.000094, 1.63 false positives per study), maps close to the α-1 antiproteinase gene cluster, particularly SERPINA13. This family of genes, particularly in the case of α-1 antitrypsin (SERPINA1) deficiency, has been implicated in disorders arising from protein conformational instability/aggregation (28).
Phosphoenolpyruvate carboxykinase 1 (PCK1), implicated by rs8192708, has been shown to be a risk factor for type-2 diabetes mellitus (29), thereby possibly increasing risk for LOAD as well [see, for example, Arvanitakis et al. (30)]. In addition, trafficking protein, kiresin binding 2 (TRAK2) and tyrosine kinase, non-receptor 1 (TNK1) may be of interest because they are involved in protein trafficking and signal transduction that might be relevant to, for example, the processing of amyloid precursor protein and amyloid β-production. In contrast to these genes/variants, however, it is likely that the significant association of two SNPs, rs3800324 and rs444013, reflects the hypervariation in the Human Leukocyte Antigen locus on chromosome 6 and may not be specific to the genes these markers map to, because they are within this unusually large region of high LD.
TNK1 is a non-receptor tyrosine kinase which mediates intracellular signaling downstream of receptor activation, e.g. TNK1 associates with phospholipase C (PLC) gamma 1, suggesting a role for TNK1 in phospholipid signal transduction (31). Numerous studies have suggested that impaired neurotransmitter receptor mediated signal transduction, particularly the phosphoinositide hydrolysis cycle contributes to the neurochemical pathology of AD. PLC is a key enzyme in the phosphoinositide hydrolysis cycle, and altered regulation of PLC activity in AD brains has been observed (32–34). It has also been shown that stimulation of muscarinic receptors coupled with PLC can alter amyloid precursor protein processing and amyloid peptide production (35,36). Thus, aberrant TNK1 activity in the AD brain could lead to the observed pathology through its interaction with PLC.
In summary, our genome scan has identified novel susceptibility genes for LOAD. Confirmation in appropriately powered validation studies would provide fresh guidance in the understanding of AD pathogenesis.
MATERIALS AND METHODS
Clinical samples
Five LOAD case–control sample sets, designated as the UK1, WU, SD, UK2 and UK3 sample sets, respectively, were used in this study. Demographic information for these samples is shown in Table 5. Cases had a minimum age at disease onset (AAO) of 60 years and a diagnosis of probable or definite AD (NINCDS-ADRDA), whereas controls were ascertained at the age of 65 years or older and screened for evidence of dementia (MMSE ≥ 28, clinical dementia rating = 0 or full neurological exam). All individuals were of Caucasian descent. All sample sets show the expected APOE4 distribution in cases and controls. Previously, we were unable to detect evidence of significant population stratification in the UK1, WU or SD sample sets (5).
Sample set characteristics
| Sample set | Sample size (Cs/Co) | AAO/AAE (Cs/Co) | ApoE4 allele % (Cs/Co) | Female % (Cs/Co) |
|---|---|---|---|---|
| UK1 | 380/396 | 75.7 ± 7.1/76.6 ± 6.2 | 36.9/13.3 | 76.6/75.0 |
| UK2 | 309/349 | 76.3 ± 7.0/76.7 ± 5.6 | 36.7/11.8 | 72.8/56.7 |
| UK3 | 503/643 | 75.1 ± 6.5/76.1 ± 6.4 | 37.1/15.2 | 64.0/59.0 |
| WU | 376/344 | 76.3 ± 9.9/77.6 ± 7.5 | 33.5/12.4 | 62.7/61.6 |
| SD | 240/330 | 72.0 ± 2.2/79.3 ± 7.2 | 38.9/11.8 | 45.4/63.3 |
SNP selection
The majority of SNPs that were chosen for the scan is predicted to modulate gene or protein function (Table 1); missense and nonsense variants account for 70% of the analyzed markers and SNPs within putative transcription factor binding sites account for 13%. Allele frequencies of 19 863 unique autosomal markers and 390 unique X-chromosome markers were determined in DNA pools of the discovery sample set (UK1). Markers with low minor allele frequencies (<0.02% in case and control pools, 2803 markers) and those for which assay quality was poor [significantly inconsistent allele frequencies among three orthogonal pools (discussed subsequently), 193 markers] were not further analyzed, resulting in 17 343 SNPs analyzed for association with LOAD. The allele frequencies of these markers are fairly evenly distributed (Fig. 2A) on the basis of the data in control pools. The number of SNPs analyzed in each chromosome is given in Figure 2B. The SNPs map to 11 221 unique genes based on the Celera annotation (Assembly R27). The distribution of these genes on specific chromosomes is given in Figure 2C. Although SNP coverage varies from chromosome to chromosome, the relative gene coverage per chromosome is similar with an average of 35.5% of genes containing at least one SNP (Fig. 2D).
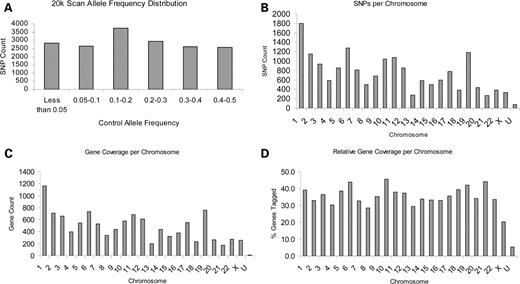
Characteristics of the 17 343 discovery SNPs. (A) Allele frequency distribution of 17 343 SNPs in control pools of the UK1 sample set. (B) Number of SNPs that were tested per chromosome. (C) Number of genes per chromosome that were tagged with at least one SNP. (D) Percentage of total genes per chromosome (Celera R27 annotation) that were tagged with at least one SNP. U: chromosome is unknown.
Allele frequency determination in pools and statistical analysis
From each of the UK1 and WU samples, we constructed 12 DNA pools. Overlapping pools for each sample were constructed to contain (i) all male cases, (ii) all female cases, (iii) all cases with AAO < 75 years, (iv) all cases with AAO ≥ 75 years, (v) all cases who carry one or more copies of the APOE4 allele and (vi) all cases who do not carry an APOE4 allele. The six corresponding pools of control subjects were also constructed with the exception that control subjects were stratified by age at examination rather than AAO. Pools were constructed taking account of phenotypic characteristics to allow future analyses of specific phenotype–genotype relationships, although none is included in this initial analysis. The number of individuals in each pool is given in Supplementary Material, Table S1. The allele frequencies of each of the 12 pools were determined from the average of two SYBR® Green (Applied Biosystems, CA, USA) real-time PCR reactions, as described by Germer et al. (37). Allele numbers (rounded to the nearest integer) for each pool were estimated by multiplying the chromosome count in the pool by the estimated allele frequency. Our design resulted in a 3-fold redundancy (orthogonal pools), that is, there are three ways of reconstructing the allele frequencies in the complete sample based on combining the gender pools, the AAO pools or the APOE status pools. On the basis of the average from each of the three methods, allelic ORs were estimated for each marker, as was a statistical test for allelic association. It should be noted that the P-value from this test is expected to have an inflated type-I error rate because of measurement error generated when estimating allele frequencies from the replicate pools used in this study and from the technical error associated with pool construction. Analyzing the average of the three orthogonal pools helps to reduce the inflation by averaging out the measurement and technical errors. In addition, χ2 tests were performed to calculate an assay quality score separately for cases and controls to test the hypothesis that the three replicate pools have equal allele frequency. We used the three orthogonal measurements on case and control pools for the 17 262 autosomal SNPs meeting our quality score and allele frequency thresholds to estimate the standard deviation of a single orthogonal pool measurement. Standard deviations gradually increased from 0.005 (N = 5476 SNPs) for minor allele frequency < 0.10 to 0.014 (N = 2514 SNPs) for the most common SNPs (minor allele frequency > = 0.4). For SNPs residing on the X chromosome, allele counts were estimated, assuming that females contribute two alleles and males one allele and statistical tests were modified accordingly. The quality score P-value for SNPs on the X chromosome is based on a χ2 test, which tests the hypothesis that male and female pools have equal allele frequency as replicate pools do not exist for these SNPs. It should be noted that the correlation between allele frequencies estimated by pooling and those observed from individual genotyping in the 119 SNPs chosen for follow-up was very high, ranging from 0.993 (WU cases) to 0.996 (UK1 cases). This indicates that the pooling results are reliable.
Criteria for follow-up
The following criteria were applied to identify autosomal markers that were then followed-up in DNA pools of the WU sample set: a non-significant assay quality score P-value (P ≥ 0.01) in case pools and control pools and identical risk alleles in all three orthogonal pools (i.e. combined APOE, sex and AAO) together with one of the following: (i) a significant allelic P-value (P < 0.05) and an OR greater than 1.25 or smaller than 0.8; (ii) an allelic P-value of < 0.075, an OR > 1.15 or OR < 0.87 and minor allele frequency > 5% in either case or control pools and (iii) for markers that map to a biological candidate gene, a greater than 5% minor allele frequency in either case or control pools, a P-value < 0.1 and an OR > 1.25 or OR < 0.8. This weighting scheme was introduced to reduce the number of false positive markers that may be due to measurement or technical errors for low frequency markers between 2 and 5% allele frequency.
X-chromosome assays were followed-up in WU pools when the following criteria were met: assay quality score P-value ≥ 0.01 in case and control pools, identical risk allele in male and female pools and either (i) a significant allelic P-value (P < 0.05) and an OR > 1.25 or OR < 0.8 or (ii) minor allele frequency of > 5% in either cases or controls, a P-value of < 0.075 and an OR > 1.15 or < 0.87.
The threshold criteria in the WU DNA pools to select 119 markers for individual genotyping in four sample sets (UK1, WU, SD and UK2) were allelic P-value less than 0.15 (χ2 test for autosomes and Mantel–Haenszel test for X-chromosome markers) and identical risk alleles in the UK1 and WU pools. Finally, 19 SNPs showing the most evidence for association with LOAD (P < 0.01) were genotyped in the UK3 sample set.
Individual genotyping and statistical analysis
Individual genotyping and statistical analyses were performed as previously described (5,6,38). Allele-wise association for each individually typed marker was tested using a standard two-sided χ2 test. Accuracy of our individual genotyping was > 99% (5). Deviation from the Hardy–Weinberg equilibrium was tested for all markers in each of the five samples. Study heterogeneity was tested by a χ2 test for heterogeneity of the ORs, and meta-analysis was performed using fixed effects Mantel–Haenszel methods to combine ORs across studies. Random-effects meta-analyses were also performed using the DerSimonian–Laird method. These gave very similar results to the fixed-effect analysis and are thus not shown.
Combining all five samples in a meta-analysis increases power over a discovery and replication design (39), and our study has power > 90% to detect allelic relative risks of 1.5 or greater when the frequency of the associated allele lies in the range 0.2–0.8, at a significance level of 1 × 10⁻⁶. SNP-specific significance levels for the five-sample meta-analyses were obtained by simulating 100 000 000 replicate samples under the null hypothesis of no association and applying the test criteria at each stage, as specified in the previous section. Replicates that did not meet all the test criteria were assigned a final statistic of zero. P-values for the test statistics from the observed data were obtained by counting the number of simulated replicates with a final test statistic equal to or greater than the observed statistic and dividing by 100 000 000. For each SNP in Table 2, the expected number of false positives in the study giving a test statistic at least as significant as the observed statistic was estimated by multiplying the SNP-specific P-value by the number of SNPs tested (17,343). This assumes that the tests are independent (i.e. no LD between the SNPs), which is reasonable given the relatively sparse SNP set used.
APOE correction analysis
Logistic regression was used to estimate ORs adjusted for the effects of another SNP in order to assess the relative importance of SNPs located in the region containing the APOE gene. The logistic regression models were performed for all pairs of SNPs genotyped in the region using indicator variables to represent each genotype and testing for significance of each SNP using a test with two degrees of freedom.
SUPPLEMENTARY MATERIAL
Supplementary Material is available at HMG Online.
ACKNOWLEDGEMENTS
Funding for this work was partly provided by the Medical Research Council, UK (J.W., M.J.O., S.L., M.O'D.), the Alzheimer's Research Trust (J.W., M.J.O., M.O'D. and S.L.), The National Institute of Health (Alzheimer's disease research center grants P50 AG05681 (to J.C.M.), P50 AG05131 (to L.T.); RO1 AG16208 (to A.G.) and PO1 AG03991 (to J.C.M.) and the Welsh Assembly Government.
Conflict of Interest statement. Some of the authors are employed by Celera Diagnostics, have personal financial interests in the company or receive research funding from Celera Diagnostics.
