


Abstract
BACKGROUND: A significant relationship exists between an abnormally high sperm protamine-1 (P1)/protamine-2 (P2) ratio and male infertility. In this study we investigate whether a decreased P1/P2 ratio is also linked to male infertility and we attempt to describe, at the protein expression level, the underlying cause of sperm P1/P2 deregulation. METHODS: P1 and P2 protein concentrations were quantified in sperm from 272 infertility patients and 87 fertile donors. P1/P2 ratios and protamine quantity were correlated with fertility status using semen analysis, sperm penetration capacity, and IVF data. RESULTS: We identified four distinct groups in the study: normal P1/P2 fertile donors, normal P1/P2 patients, low P1/P2 patients, and high P1/P2 patients. P1 and P2 were both under-expressed in patients with a normal P1/P2 ratio, but not in fertile donors. In patients with a low P1/P2 ratio, P1 was under-expressed while P2 was over-expressed; in patients with a high P1/P2 ratio, P1 was normally expressed and P2 was under-expressed. Patients with abnormal P1/P2 ratios displayed significantly reduced semen quality and sperm penetration ability. CONCLUSIONS: We have identified a novel population of infertile males with a reduced P1/P2 ratio. Aberrant P1/P2 ratios arise from an abnormal concentration of P1 and/or P2, either of which is associated with male infertility.
Introduction
During spermiogenesis, sperm protamines replace somatic cell histones in a multi-step process (Oliva and Dixon, 1991). The first step in this process occurs in round spermatids and involves replacement of the histones with the transition nuclear proteins (TP1 and TP2). Subsequently, in elongating spermatids, the protamines replace TP1 and TP2. This histone–protamine replacement results in a highly condensed, transcriptionally silent chromatin (Dadoune, 1995).
The importance of the protamines is highlighted by the high level of conservation found within mammalian genera (Corzett et al., 2002). In human males there are two forms of sperm protamine, protamine-1 (P1) and protamine-2 (P2), which occur in a strictly regulated 1/1 ratio (Corzett et al., 2002). It now appears that strict regulation of this protamine-1/protamine-2 ratio (P1/P2) is critical for the fertility status of human sperm.
A number of studies have established a relationship between deregulated protamine expression and human male infertility (Chevaillier et al., 1987; Balhorn et al., 1988; Belokopytova et al., 1993; de Yebra et al., 1993, 1998; Carrell and Liu, 2001). Each of these studies demonstrated that an elevated P1/P2 ratio is highly correlated to male infertility. In addition, the studies conducted by de Yebra et al. (1998) and Carrell and Liu (2001) described a population of infertile males with undetectable P2 in their sperm. Taken together, these data have led to the assumption that decreased expression of P2 is responsible for the increased P1/P2 ratio observed in infertile males. However, studies have failed to elucidate a population of infertile males with a diminished P1/P2 ratio. Such a finding would question the assumption that P2 deregulation is always responsible for aberrant P1/P2 ratios.
In this study, we aimed to quantify the sperm P1 and P2 concentrations in infertility patients and men of known fertility; to evaluate semen quality and IVF outcome in patients with a reduced P1/P2 ratio; and to assess which of the protamine proteins is abnormally expressed in infertile males with an abnormal P1/P2 ratio.
Materials and methods
Materials
Unless otherwise noted, all chemicals were obtained from Sigma Chemical Company (USA). Reagents for gel electrophoresis were purchased from BioRad Laboratories (USA).
Study population and semen quality evaluation
Institutional Review Board approval was obtained prior to initiation of this study. Semen was collected and evaluated from 87 fertile donors and 272 patients presenting for infertility assessment and/or preparing to undergo IVF. A single semen sample was used for diagnostic assays, including protamine protein extraction and quantification. A second sample was used for the IVF procedure. Patients were excluded from the study if the sperm concentration was <1 × 10⁶/ml or if they were presenting for post-vasectomy analysis.
Semen quality was evaluated by following WHO (World Health Organization, 2000) standards for semen analysis, including sperm concentration, motility and morphology. In addition, a sperm penetration assay (SPA) was performed on the semen sample as previously described (Carrell and Urry, 1996; Carrell et al., 1998). The percentage of hamster ova penetrated by one or more sperm is reported.
Purification of nuclear proteins
Sperm nuclear proteins were extracted as previously described from all 87 fertile donors and 272 patients enrolled in the study to determine P1/P2 ratios (Carrell and Liu, 2001). P1 and P2 concentrations were subsequently quantified in all 87 fertile donor samples and 139 of the 272 patients. Prior to extraction, sperm concentrations were determined in samples being quantified for P1 and P2 concentrations using WHO criteria. All samples were run in duplicate and the average P1 and P2 concentrations and P1/P2 ratio from the two runs were reported. Semen aliquots with a known number of sperm (in samples being quantified for P1 and P2 concentrations) were centrifuged at 500 g for 5 min at 4 °C. The pellet was washed in 1 mmol/l phenylmethylsulfonyl fluoride (PMSF) in distilled water, centrifuged at 500 g for 5 min at 4 °C, and the pellet was resuspended in 100 μl of 100 mmol/l Tris buffer containing 20 mmol/l EDTA and 1 mmol/l PMSF (pH 8.0). One hundred microlitres of 6 mol/l guanidine and 575 mmol/l dithiothreitol was added and mixed, followed by mixing of 200 μl 522 mmol/l sodium iodoacetate. The suspension was protected from light and kept at room temperature for 30 min. The suspension was mixed with 1.0 ml of 100% ethanol at 4 °C for 1 min and centrifuged at 12 000 g for 10 min at 4 °C. The ethanol wash was repeated and the pellet was resuspended in 0.8 ml of 0.5 mol/l HCl and incubated for 15 min at 37 °C and centrifuged at 10 000 g for 10 min. The supernatant was kept and the nuclear proteins were precipitated by the addition of 100% trichloroacetic acid (TCA) to a final concentration of 20% TCA. The solution was incubated at 4 °C for 5 min and centrifuged at 12 000 g for 10 min. The pellet was washed twice in 500 μl 1% 2-mercaptoethanol in acetone. The final pellet was dried and stored at −20 °C until analysed using gel electrophoresis.
Preparation of the human protamine standard
A human protamine standard was prepared as previously described (Mengual et al., 2003). A pool of 20 semen samples was made in order to extract and quantify sperm protamines. Briefly, sperm were washed twice with 0.5 mol/l HCl before protamine extraction to remove other acid-extracted proteins. After acid treatment, the protamines were extracted as described above. The protein extract contained highly purified protamine and the final protamine concentration was determined using the RC DC protein assay kit (BioRad Laboratories, USA). The protamine extract was run using acid–acrylamide gel electrophoresis to determine the ratio of P1 to P2 (see below).
The final concentration of P1 and P2 was calculated from the percentage composition of each of the protamines in the total protamine standard. Subsequently, 1.52, 0.76, 0.38 and 0.19 μg of human sperm protamine standard were loaded in each gel and a standard regression curve was made to calculate the amount of protamine in each of the patient samples (Figure 1). The r2 value of the regression curve was ≥0.96 for each gel run.
P1/P2 quantification
Acetic acid–urea gel electrophoresis was performed as previously described by Carrell and Liu (2001). The separating gel contained 20% acrylamide, 0.1% bisacrylamide, 0.9 mol/l acetic acid, and 2.5 mol/l urea. The stacking gel was comprised of 7.5% acrylamide, 0.2% bisacrylamide, 2.5 mol/l urea, and 0.375 mol/l potassium acetate at pH 4.0. Gels were stained with Coomassie Blue using standard techniques. The gels were scanned using a Umax-SE scanner with the SilverFast scanning software package (Umax Technologies, USA). The intensity of bands corresponding to P1 and P2 was quantified using National Institutes of Health Image-J software. P1 and P2 quantities were calculated against the standard curve generated from the human protamine standard as described above (Figure 1). Protein quantity is reported as ng protein/106 sperm. Identity of protamine bands were established using western blot analysis as reported in a previous study (Carrell and Liu, 2001).
Protamine quantification quality control
We employed two distinct quality controls to ensure our protamine quantification protocol could produce valid and reproducible results with respect to evaluation of the P1/P2 ratio, [P1] and [P2]. First, aliquots of 20 × 106 sperm were made from a common semen sample taken from a pool of 20 semen samples. One of these aliquots was run with each round of extractions (n=15). The resulting mean P1/P2 ratio (0.85±0.01), P1 concentration (441.1±3.7 ng/106 sperm), and P2 concentration (522.1±4.5 ng/106 sperm) showed little between-sample variation and ensured reproducible results within individual samples. Second, to evaluate variations in the P1/P2 ratio, [P1] and [P2] between ejaculates from the same individual, we analyzed the semen from two different ejaculates (6 months apart) in 42 individuals. Results indicated no significant differences between ejaculates with respect to the P1/P2 ratio (1.03±0.04 versus 1.11±0.08), P1 concentration (560.4±42.2 versus 571.9±49.6 ng/106 sperm), or P2 concentration (535.5±30.9 versus 527.1±37.2 ng/106 sperm) as assessed by a paired t-test.
IVF
A total of 175 patients subsequently underwent IVF. Ovarian stimulation was performed using standard techniques of GnRH agonist down-regulation and gonadotrophin stimulation with ultrasound-guided transvaginal oocyte retrieval performed 36 h after hCG administration. Fertilization was achieved by standard IVF (n=71 cases), ICSI (n=73), or a combination of standard IVF/ICSI (n=31) depending on the sperm penetration score (Table I). Resulting embryos were cultured in HTF medium supplemented with 15% heat-deactivated maternal serum for 72 h post-oocyte retrieval, at which time embryos were transferred to the uterus. Embryo grade was assessed based on the degree of cellular fragmentation and the regularity of blastomere morphology, with zero being the highest quality and three being the worst quality. A previously reported embryo scoring system was used which represents the number of blastomeres minus the embryo grade (Carrell et al., 1999).
Statistical evaluation
Based on the P1/P2 ratio, study subjects were stratified into four groups: normal P1/P2 fertile donors, normal P1/P2 patients, low P1/P2 patients, and high P1/P2 patients. Low (<0.8) and high P1/P2 ratios (>1.2) were defined by the critical values calculated from the two-tailed normal distribution for the P1/P2 ratios of fertile donors with 90% confidence limits (Figure 2).
Protamine protein quantity was compared between these groups using the Kruskal–Wallis test. Deviation in P1 and/or P2 expression in patients with abnormal P1/P2 ratios is referred to as deregulation and was assessed by comparing their protein concentrations against those of the fertile donors and patients with normal P1/P2 ratios. P1 and P2 concentrations falling outside the critical values for P1 and P2 concentration in the comparison groups were classified as being deregulated. The critical values for P1 and P2 quantity define the protein concentration range within a two-tailed normal distribution at a confidence of 95%. The occurrence of P1 deregulation was compared to that of P2 deregulation using χ2-analysis.
Semen quality parameters including sperm concentration, motility and morphology were compared between groups statistically using Kruskal–Wallis analysis. The fertilization rate, embryo quality and pregnancy rate of those subjects subsequently undergoing IVF was compared between groups. Kruskal–Wallis was used to compare fertilization rate and embryo quality whereas χ2-analysis was used to compare pregnancy rates between groups.
The relationships between the P1/P2 ratio/protamine measurements (P1, P2 and total protamine quantity) and semen quality/IVF outcome measures were evaluated using Spearman's correlation. In order to use this test effectively we split the analysis between two groups for correlation analysis with the P1/P2 ratio: (i) patients with low and normal ratios (those with P1/P2 ratios of 0–1.2); and (ii) patients with normal and high ratios (those with P1/P2 ratios >0.8). The critical values define the P1/P2 ratio range within a two-tailed normal distribution of fertile donors with 90% confidence limits, as described above. For individual correlation analysis of P1 and P2 concentration with the outcome measures, we used a similar approach by evaluating two groups: (i) those with low and normal P1 or P2 concentrations (0.0–594.4 ng P1/106 sperm, 0.0–556.6 ng P2/106 sperm respectively) and (ii) those with normal and high P1 or P2 concentrations (>483.0 ng P1/106 sperm, >474.2 ng P2/106 sperm respectively). The critical values for P1 and P2 quantity define the protein concentration range within a two-tailed normal distribution of fertile donors at a confidence of 95%, as described above.
Results
P1/P2 ratio quantification
Gel electrophoresis revealed that the mean P1/P2 ratio for fertile donors was 1.06±0.01 with a range of 0.75–1.26 (Figure 2). We found a similar mean P1/P2 ratio in the patients (1.09±0.10) but the range was much wider (0.0–2.82). In the patient group, we identified 37 individuals with a significantly reduced P1/P2 ratio (<0.8) and 108 with a significantly elevated P1/P2 ratio (>1.2; Table I). In the fertile donor group, there were five individuals with a reduced P1/P2 ratio and seven individuals with an elevated P1/P2 ratio. However, the mean P1/P2 ratios for these individuals were 0.77±0.01 and 1.23±0.01 respectively compared to 0.50±0.4 and 1.55±0.06 in the patients with low and high P1/P2 ratios respectively (P<0.01).
Protamine quantification revealed that the mean P1 and P2 concentrations in the sperm of fertile donors were 538.7±28.6 and 515.4±21.1 ng/106 sperm respectively (Table II, Figure 3). Kruskal–Wallis analysis revealed that the mean P1 and P2 concentrations in the patient group with a normal P1/P2 ratio were significantly reduced versus the donors (438.8±14.0 and 427.0±20.8 ng/106 sperm, P<0.05).
The mean P1 concentrations of the patients with low and high P1/P2 ratios (459.3±32.9, 453.7±25.6 ng/106 sperm) were significantly reduced versus the fertile donors (P<0.05) but not different from the patients with a normal P1/P2 ratio (P=0.434). The mean P2 concentration in patients with a low P1/P2 ratio (580.6±29.5 ng/106 sperm) was significantly increased over that of all other groups (P<0.001). Conversely, the mean P2 concentration in patients with a high P1/P2 ratio (304.2±19.9 ng/106 sperm) was significantly decreased versus each of the other groups (P<0.001).
P1 and P2 deregulation
Based on protamine quantification, the boundaries defined by the two-tailed normal distribution in the fertile donor group were 483.0–594.4 ng/106 sperm for P1 and 474.2–556.6 ng/106 sperm for P2. The boundaries defined by the two-tailed normal distribution in the patient group with normal P1/P2 were 411.6–466.0 ng/106 sperm for P1 and 395.9–458.1 ng/106 sperm for P2. χ2-Analysis revealed that P2 is subject to deregulation much more frequently than P1 in patients with abnormal P1/P2 ratios (73/82 versus 56/82 against fertile donors: P<0.01; 26/82 versus 9/82 against patients with a normal P1/P2 ratio: P<0.001; Table III; Figure 4).
The frequency of P1 and P2 deregulation was compared within the low and high P1/P2 ratio groups (Table IV, Figure 5). P2 under-expression accounts for the majority of cases with elevated P1/P2 ratios. However, both P1 under-expression and P2 over-expression are involved in cases where the P1/P2 ratio is diminished. When using fertile donors as a standard, 63% (19/30) of the patient group with a low P1/P2 ratio displayed under-expression of P1, while 50% (15/30) showed over-expression of P2 (not significant). There were four patients within this group that showed low P1 concurrent with high P2, which accounts for the discrepancy in the overall percentage shown above.
In the high P1/P2 ratio group there were 13% (7/52) with over-expression of P1 and 90% (47/52) with under-expression of P2, a significant difference (P<0.001, Table IV). Two patients in this group showed high P1 concurrent with low P2. When using the patients with a normal P1/P2 ratio as a standard, 10% (3/30) of the low P1/P2 ratio group exhibited P1 under-expression, while 30% (9/30) demonstrated P2 over-expression (P=0.11). In the high P1/P2 ratio group 8% (4/52) had over-expressed P1 and 17% (9/52) exhibited P2 under-expression (P=0.19).
Relationship between sperm P1/P2 content and semen quality/IVF outcome
Sperm concentrations were reduced in patients with low P1/P2 (64.8±10.6 × 10⁶/ml) as well as high P1/P2 (79.0±5.1 × 10⁶/ml) versus patients with normal P1/P2 (108.5±9.56 × 10⁶/ml; P<0.005; Table I). Spearman's correlation analysis indicates that the P1/P2 ratio is significantly correlated with count (rs=0.22, P<0.05; rs=−0.18, P<0.01) in patients with low and normal P1/P2 ratios (0–1.2) as well as normal and high P1/P2 ratios (>0.8), respectively.
Progressive motility was significantly different in patients with low, normal and high P1/P2 (25.4±3.0, 44.7±2.1, 32.4±1.2% respectively; P<0.005). Spearman's correlation indicates that the P1/P2 ratio is significantly correlated with progressive motility in patients with low and normal P1/P2 ratios (0–1.2; rs=0.17, P<0.05) but only moderately correlated in patients with normal and high P1/P2 ratios (>0.8; rs=−0.11, P=0.10).
Normal head morphology was significantly reduced in the low and high P1/P2 groups (28.2±2.9 and 23.9±1.9% respectively) versus those with normal P1/P2 (44.7±2.1%; P<0.001). A significant increase in tapered heads was observed in patients with low P1/P2 (41.2±3.2%) compared with the normal P1/P2 group (26.6±2.4%; P<0.001). In patients with high P1/P2, there was a concomitant increase in tapered heads (57.6±2.0%; P<0.001). Furthermore, Spearman's correlation analysis indicates that the P1/P2 ratio is significantly correlated with normal head morphology (rs=0.25, P<0.005; rs=−0.39, P<0.005) and tapered head morphology (rs=−0.18, P<0.05; rs=0.32, P<0.005) in patients with low and normal P1/P2 ratios (0–1.2) as well as normal and high P1/P2 ratios (>0.8), respectively. Amorphous heads were increased in patients with low P1/P2 (22.5±2.2%) versus those with normal and high P1/P2 (13.0±1.5 and 13.4±1.0% respectively; P<0.05). Spearman's correlation analysis indicates the P1/P2 ratio is significantly correlated with amorphous head morphology in patients with low and normal P1/P2 ratios (0–1.2; rs=−0.16; P<0.05) but not in patients with normal and high P1/P2 ratios (>0.8; rs=0.02; P=0.73).
The mean SPA scores differed significantly between patients with decreased (n=37), normal (n=127) and elevated (n=108) P1/P2 ratios (5.0±0.94, 18.5±1.1 and 13.7±1.2 respectively; P<0.001; Table I). Spearman's correlation analysis indicates that the P1/P2 ratio is significantly correlated with SPA (rs=0.37, P<0.001; rs=−0.17, P<0.05) in patients with low and normal P1/P2 ratios (0–1.2) as well as normal and high P1/P2 ratios (>0.8) respectively.
Evaluation of male infertility diagnosis for patients within P1/P2 ratio groups revealed a significantly increased proportion of subfertile males within the low P1/P2 ratio group (95%, 35/37) and high P1/P2 ratio group (90%, 97/108) versus the normal P1/P2 ratio group (36%, 46/127) using χ2-analysis (P<0.001, Table V). Conversely, the proportion of fertile males was significantly higher in the normal P1/P2 ratio group (64%, 81/127) versus the low P1/P2 ratio group (5%, 2/37) and high P1/P2 ratio group (10%, 11/108, P<0.005; Table V).
Twenty-five of the 37 patients with a diminished P1/P2 ratio, 89 of the 127 patients with a normal P1/P2 ratio, and 61 of the 108 patients with an elevated P1/P2 ratio underwent IVF (Table I). Overall fertilization rate (IVF and ICSI combined) was significantly decreased in patients with a low P1/P2 ratio (75.4±4.0%) compared with patients with normal and elevated P1/P2 (84.4±2.0 and 86.5±2.0% respectively; P<0.05). Spearman's correlation analysis revealed that IVF fertilization is not significantly correlated to the P1/P2 ratio in patients with normal to high P1/P2 ratios (rs=0.03, P=0.71) but is moderately correlated in patients with low to normal P1/P2 ratios (rs=0.16, P=0.12). However, no significant differences between P1/P2 ratio groups or correlations with the P1/P2 ratio were observed in any other IVF outcome measure.
The relationship between semen quality/IVF outcome and P1, P2, and total protamine quantity was also evaluated. Spearman's correlation revealed a significant relationship between P1 concentration and SPA (rs=−0.26, P<0.05), sperm concentration (rs=−0.31, P<0.05), progressive motility (rs=−0.30, P<0.05) and IVF fertilization rate (rs=−0.35, P<0.05) in patients with normal and high P1 levels. However, no significant correlations with P1 concentration were observed in patients with low and normal P1 levels. P2 and total protamine concentrations showed no correlation with any of the outcome measures. Multiple regression analysis failed to resolve any significant complex relationships between the P1/P2 ratio, P1, P2, and total protamine quantity and semen quality/IVF outcome.
Discussion
In this study we provide the first description of a population of infertile males with markedly diminished P1/P2 ratios. A number of studies have reported a relationship between abnormally high P1/P2 ratios and male infertility (Balhorn et al., 1988; de Yebra et al., 1993, 1998; Khara et al., 1997; Carrell and Liu, 2001; Mengual et al., 2003). Based on these studies it has been assumed that a reduction in P2 expression is responsible for aberrant P1/P2 ratios in infertile males. Support for this conclusion was solidified by two studies that identified infertile males with complete selective absence of P2 (de Yebra et al., 1993; Carrell and Liu, 2001).
Previous studies have failed to quantify the sperm protamines in patients with aberrant P1/P2 ratios, and it has been assumed, without direct evidence, that P2 under-expression is responsible. The identification of infertile patients with abnormally low P1/P2 ratios and the possibility that P1 over-expression, rather than P2 under-expression, is responsible for the high P1/P2 ratios observed in infertile patients highlight the need for actual protein quantification, as performed in this study.
In the sperm of infertile patients, P2 deregulation occurs much more frequently than does P1 deregulation, supporting the conclusion that P2 deregulation is responsible for the majority of cases involving an aberrant P1/P2 ratio. Studies of protamine evolution have revealed that the P2 gene is more recently derived than P1 and highly variable within the mammalian genera (Lewis et al., 2003). Consistent with this data is the notion that the regulatory mechanisms governing P2 expression are more susceptible to variation than those for P1 expression. Indeed, 90% of patients with abnormally high P1/P2 ratios exhibited P2 under-expression.
However, P1 deregulation is also implicated in aberrant human sperm P1/P2 ratios. A small proportion (13%) of patients with high P1/P2 exhibited P1 over-expression. Meanwhile, P1 under-expression and P2 over-expression were shown to be equally involved within the low P1/P2 group. There was only a small percentage of patients exhibiting low P1 levels concurrent with high P2 levels (13%) and high P1 levels concurrent with low P2 levels (4%). Therefore, both P1 and P2 deregulation are implicated in aberrant P1/P2 ratio cases in infertile human males and there do not appear to be well-defined mechanisms for compensation of under-expression of one of the protamines by over-expression of the other.
The mechanisms underlying the uncoupling of P1 and P2 expression remain elusive. An interesting aspect of protamine expression is that transcription and translation are temporally uncoupled in the developing spermatid (Steger, 1999). Studies should focus on four targets in the expression pathway to elucidate the underlying etiology of protamine deregulation: the protamine genes themselves, transcription regulation, translation regulation, and downstream protein processing. Attractive hypotheses have emerged in each of these areas to account for the induction of aberrant P1/P2 stoichiometry.
Mutations in the genes encoding P1, P2, or any of the accessory proteins including transition nuclear protein 1 and 2 (TP1 and TP2), serine/arginine protein-specific kinase 1 (SRPK1), and Ca2+/calmodulin-dependent protein kinase IV (Camk4) may play a role in P1 and P2 deregulation. For each of these genes, functional studies and animal knockouts have demonstrated the critical involvement of these proteins in faithful protamine expression, processing, and function (Papoutsopoulou et al., 1999; Wu et al., 2000; Cho et al., 2001, 2003; Zhao et al., 2004). Although genetic screens have not yet been performed on these genes in patients with specifically identified deregulations in the P1/P2 ratio, a recent study has identified single nucleotide polymorphisms in the P1 and P2 genes of a large group of fertile and infertile patients (Tanaka et al., 2003). Future investigations should be undertaken to elucidate the involvement of gene mutations in patients with deregulated P1/P2 ratios.
In the absence of any gene mutations, an irregular P1/P2 ratio may reflect defects in transcription and translation regulation. The haploid expressed P1 and P2 genes exist in a single chromatin domain in human sperm and their transcription is regulated by the same upstream regulatory elements, thus making transcriptional regulation an unlikely but possible cause of aberrant P1/P2 stoichiometry (Johnson et al., 1988; De Jonckheere et al., 1994; Nelson and Krawetz, 1994). Aberrant translation regulation is more likely to be involved in protamine expression regulation. A number of regulatory proteins have now been identified which are involved in repression or activation of protamine translation (Aoki and Carrell, 2003). Future investigations should focus on aberrant expression, activation and function of these translational regulators in patients with deregulated P1/P2 ratios.
Finally, incomplete post-translational processing of the protamines may result in deregulated P1/P2 ratios. Two reports provide strong evidence for this argument, as a group of infertile males with aberrant P1/P2 ratios also displayed an increase in P2 precursors (de Yebra et al., 1998; Carrell and Liu, 2001). Considering the importance of TP1, TP2, Camk4, and SRPK1 in the processing of P1 and P2, deregulated protamine ratios may also reflect deficiency or abnormal function of these accessory proteins. The majority of these effects would be evidenced by disruption of P1/P2 phosphorylation; thus improper signal transduction or malfunction in the appropriate kinases could lead to incomplete protein processing and unsuccessful DNA binding.
Numerous reports have now established a relationship between abnormal protamine expression and male infertility (Balhorn et al., 1988; de Yebra et al., 1993, 1998; Khara et al., 1997; Carrell and Liu, 2001; Mengual et al., 2003; Steger et al., 2003). Our data are consistent with these reports and, on three levels, provide convincing evidence for the relationship between abnormal P1/P2 ratios and male infertility. First, the sperm of infertile patients with aberrant P1/P2 ratios have reduced motility, sperm concentration, morphology, penetration capacity and, in low P1/P2 ratio patients, IVF fertilization rates. Second, we have now shown that the sperm P1/P2 ratio directly correlates with sperm motility, concentration, morphology, and sperm penetration ability. Third, most of the patients with a P1/P2 ratio were clinically diagnosed with some form of male subfertility. Moreover, the newly discovered group of infertile males with a reduced P1/P2 ratio has markedly diminished sperm quality and IVF fertilization versus those with increased P1/P2 ratios. This difference may reflect inefficient sperm chromatin packaging when P2 is more abundant than P1.
Clearly, there is a ratio-dependent interaction between P1 and P2 critical for proper chromatin packaging and the subsequent events in spermiogenesis. The precise nature of this interaction, however, has not yet been elucidated. Recent reports of protamine knockouts indicate that haploinsufficiency of P1 or P2 causes infertility in mice and that mouse P2 deficiency leads to sperm DNA damage and embryo death (Cho et al., 2001, 2003). Taken together, these data demonstrate that protamines are important components of spermatid differentiation and that aberrations in protamine stoichiometry are related to infertility and may confer defects during spermiogenesis.
An alternative hypothesis is that abnormal protamine expression may not be an independent cause of infertility, but rather a result of generalized abnormal spermiogenesis. For example, the protamines may be regulated in conjunction with other key genes during spermiogenesis that affect their expression. Although the animal models argue against this hypothesis by demonstrating that P1 and P2 deficiency are direct causes of infertility, no such studies exist in the human (Cho et al., 2001, 2003).
ICSI appears to overcome defective sperm function associated with an abnormal P1/P2 ratio in light of our data indicating little effect of the P1/P2 ratio on IVF pregnancy rates. However, evaluation of the P1/P2 ratio may still serve as a valuable clinical diagnostic test for three reasons. First, we have shown that the P1/P2 ratio correlates highly with sperm penetration ability, count, morphology and motility. Second, recent studies have emphasized the importance of sperm DNA damage for proper embryogenesis. Protamine content appears to be critical for proper chromatin integrity evidenced by increased susceptibility of protamine deficient sperm to DNA damage (Manicardi et al., 1998; Agarwal and Allamaneni, 2004). Third, in light of recent concerns about imprinting diseases associated with ICSI, human sperm protamines may be of utmost clinical significance even though they do not impair IVF/ICSI pregnancy rates. It is now clear that proper chromatin structure is critical for faithful methylation of imprinted genes (Paldi, 2003). Since the primary role of the sperm protamines is to impart proper sperm chromatin structure, it is possible that protamine and chromatin structural defects may render sperm susceptible to improper imprinting patterns in critical genes. It will be important to evaluate the relationship between abnormal P1/P2 ratios and sperm DNA damage and imprinting patterns, the underlying etiology of P1/P2 defects, and why the P1/P2 ratio is linked to sperm penetration and capacitation.
To summarize, we have now identified a new classification of infertile patients with diminished P1/P2 ratios. The identification of this group raised the question: which of the protamines is deregulated in infertile patients with aberrant P1/P2 stoichiometry? Quantification data indicate that the majority of these cases are due to P2 deregulation. However, P1 deregulation also plays a role, especially in infertile patients with a low P1/P2 ratio. Finally, we have shown that the P1/P2 ratio is associated with sperm quality. Moreover, patients with a reduced P1/P2 ratio have severely affected sperm quality and reduced IVF fertilization, greater than the previously described class of patients with an elevated P1/P2 ratio. These data highlight the clinical importance of sperm protamines in fertility diagnosis and prognosis. Additionally, identification of the nature of protamine deregulation at the protein expression level serves as a necessary first step to elucidating the underlying causes of abnormal protamine expression in infertile males.
![(A) Acid gel electrophoresis of purified P1 (arrow) and P2 (arrowhead) proteins. Shown are representative banding patterns for a patient with a high P1/P2 ratio (lane 1), a low P1/P2 ratio (lane 2), and four human protamine standards used to generate standard curves (lane 3: 0.1895 μg; lane 4: 0.3789 μg; lane 5: 0.7578 μg; lane 6: 1.5156 μg). (B) Representative standard curves used to calculate P1 and P2 quantity. Linear regression resolved a P2 standard curve fitting the equation [P2]=0.3919(Intensity)+0.066 with an R2 value of 0.9999. The P1 standard curve fit the equation [P1]=0.3547(Intensity)+0.0259 with an R2 value of 0.9988.](https://oup.silverchair-cdn.com/oup/backfile/Content_public/Journal/humrep/20/5/10.1093_humrep_deh798/2/m_135531f1.jpeg?Expires=1716671650&Signature=D0jV0Hi36ipfZwSeWRsj~DmpYPl1QvDWmBSjiVr3aL2aMWn1YAxHYOeEQ5Rfh-hFq~EcZwn1P1w1OGVrr-PDLwfdjYqHUShVN1D8NPBvfENkbXQC1gCxTwpqRfx46nA6Cb65ztD~zGd9VDOxHNstECM2ylhmL5XBrObRdGT7E3NF4XLp2FbYuUqXVXm~M6-jBPykQuRWtBz~GW0XkN0eGthVnOY4uLfwsPj-xN-1M2ZD4k4tDQFcs5FSisZSIR8f8AB-jkfM~7fXYBy6LupRAN8JfI-Ie8Hab~ZqUiLeAK~RxOiecrv8BS633DaOsr7bTrRztWVTAQ~N76ex1NOV5w__&Key-Pair-Id=APKAIE5G5CRDK6RD3PGA)
(A) Acid gel electrophoresis of purified P1 (arrow) and P2 (arrowhead) proteins. Shown are representative banding patterns for a patient with a high P1/P2 ratio (lane 1), a low P1/P2 ratio (lane 2), and four human protamine standards used to generate standard curves (lane 3: 0.1895 μg; lane 4: 0.3789 μg; lane 5: 0.7578 μg; lane 6: 1.5156 μg). (B) Representative standard curves used to calculate P1 and P2 quantity. Linear regression resolved a P2 standard curve fitting the equation [P2]=0.3919(Intensity)+0.066 with an R2 value of 0.9999. The P1 standard curve fit the equation [P1]=0.3547(Intensity)+0.0259 with an R2 value of 0.9988.
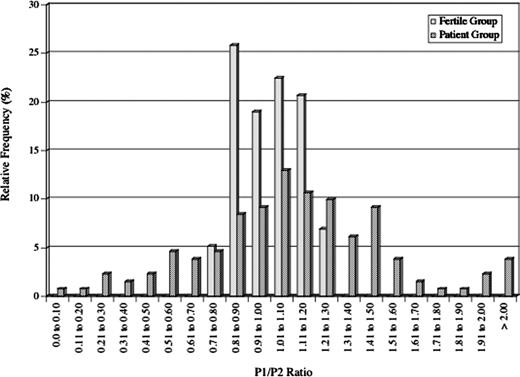
Distribution of P1/P2 ratios in fertile donors and infertility patients. The histogram shows the relative frequency of fertile donors (solid boxes) and infertility patients (meshed boxes) within bins of 0.10 P1/P2 ratio units. A much broader P1/P2 ratio distribution is observed in the patients (range: 0.0–2.82) versus the fertile donors (range: 0.75–1.26).
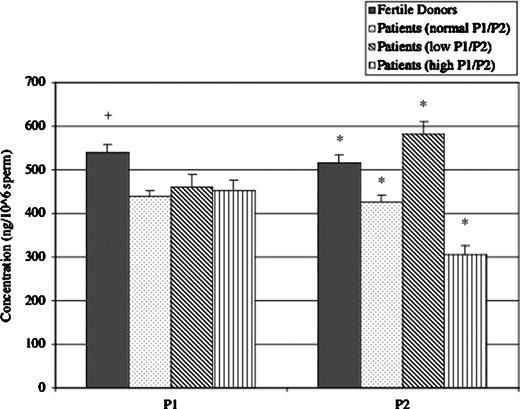
Mean P1 and P2 content in the sperm of fertile donors and infertility patients. The mean concentration of P1 (left) and P2 (right) is shown with standard error bars for the fertile donors and three groups of infertility patients. Patients with normal P1/P2 ratios under-expressed both P1 and P2. Meanwhile, P2 deregulation accounts for aberrations in the P1/P2 ratio of the other infertility patients with an over-expression leading to a low P1/P2 ratio and severe under-expression leading to a high P1/P2 ratio. +Significant differences (P<0.05) from each of the other groups within the P1 category. *Significant differences (P<0.001) from each of the other groups within the P2 category.
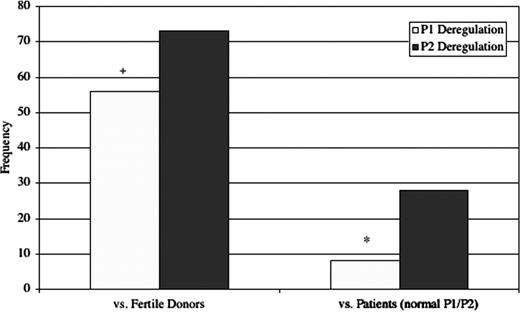
P1 and P2 deregulation frequency in patients with abnormal sperm P1/P2 ratios. P2 is subject to deregulation much more frequently than P1 in patients with abnormal P1/P2 ratios when using both the fertile donors (+P<0.01) and patients with normal P1/P2 ratios (*P<0.001) as comparison groups.
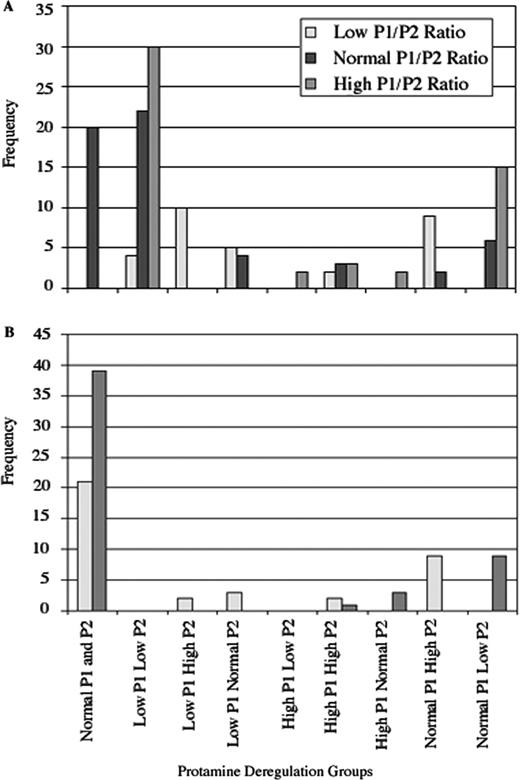
Frequency of protamine deregulation groups using fertile donors (A) and infertility patients with a normal P1/P2 ratio (B) as comparison groups. Study subjects were grouped according to P1 and P2 concentration. Equal numbers of patients with a low P1/P2 ratio displayed over-expression of P2 or under-expression of P1. The majority of patients with an elevated P1/P2 ratio were found to have under-expressed P2, whereas a small percentage displayed over-expression of P1.
Comparison of semen analysis parameters and IVF outcomes between P1/P2 ratio groups
| P1/P2<0.8 | P1/P2=0.8–1.2 | P1/P2>1.2 | P | |||||
|---|---|---|---|---|---|---|---|---|
| n | 37 | 127 | 108 | |||||
| Count (×106 sperm/ml) | 64.8±10.6 | 108.5±9.56 | 79.0±5.1 | < 0.005a | ||||
| Progressive motility (%) | 25.4±3.0 | 44.7±2.1 | 32.4±1.2 | < 0.005b | ||||
| Normal heads (%) | 28.2±2.9 | 52.8±2.1 | 23.9±1.9 | < 0.001a | ||||
| Tapered heads (%) | 41.2±3.2 | 26.6±2.4 | 57.6±2.0 | < 0.001b | ||||
| Amorphous heads (%) | 22.5±2.2 | 13.0±1.5 | 13.4±1.0 | < 0.05c | ||||
| Sperm penetration assay | 5±0.94 | 18.5±1.1 | 13.7±1.2 | < 0.001b | ||||
| IVF cycles (n) | 25 | 89 | 61 | |||||
| Fertilization rate (%) | 75.4±4.0 | 84.4±2.0 | 86.5±2.0 | < 0.05c | ||||
| Fertilization rate by type (%) | ||||||||
| ICSI | 75.2±4.0 | 80.5±5.1 | 83.5±1.9 | NS | ||||
| IVF | 75.8±13.6 | 86.0±2.7 | 86.1±2.2 | NS | ||||
| IVF/ICSI | NA | 83.7±3.9 | 75.0±5 | NS | ||||
| Fertilization type used (%) | ||||||||
| ICSI | 73 (18/25) | 17 (15/89) | 65 (40/61) | < 0.001a | ||||
| IVF | 27 (7/25) | 50 (45/89) | 31 (19/61) | |||||
| IVF/ICSI | 0 | 33 (29/89) | 4 (2/61) | |||||
| ES/embryo transferred | 4.8±0.4 | 5.2±0.2 | 4.8±0.2 | NS | ||||
| ES/embryo total | 3.5±0.3 | 4.1±0.2 | 3.5±0.3 | NS | ||||
| Pregnancy rate overall (%) | 36 (9/25) | 41 (37/89) | 44 (27/61) | NS | ||||
| Spontaneous abortion rate (%) | 11 (1/9) | 3 (1/37) | 4 (1/24) | NS | ||||
Significant difference between columns 2 and columns 1 or 3.
Significant difference between all columns.
Significant difference between columns 1 and columns 2 or 3.
NS = not significant; NA = not applicable; ES = embryo score.
Protamine quantification summary
| Fertile donors | Patient group | P | |||||
|---|---|---|---|---|---|---|---|
| Normal P1/P2 | Low P1/P2 | High P1/P2 | |||||
| n | 87 | 57 | 30 | 52 | |||
| Mean P1/P2 ratio | 1.06±0.01 | 1.01±0.01 | 0.50±0.09a | 1.55±0.06a | < 0.001 | ||
| P1 concentration (ng/106 sperm) | 538.7±28.6a | 438.81±14.0 | 459.3±32.9 | 453.7±5.6 | < 0.05 | ||
| P2 concentration (ng/106 sperm) | 515.4±21.1a | 427.0±20.8a | 580.6±29.5a | 304.2±19.9a | < 0.001 | ||
Significantly different from all other columns.
Contingency table comparing incidence of P1 and P2 deregulation in patients with an abnormal P1/P2 ratio
| Patients with abnormal P1/P2 ratios | P | |||
|---|---|---|---|---|
| Deregulation | No deregulation | |||
| P1a (%) | 68 (56/82) | 32 (26/82) | < 0.01 | |
| P2a (%) | 89 (73/82) | 11 (9/82) | ||
| Patients with abnormal P1/P2 ratios | P | |||
|---|---|---|---|---|
| Deregulation | No deregulation | |||
| P1a (%) | 68 (56/82) | 32 (26/82) | < 0.01 | |
| P2a (%) | 89 (73/82) | 11 (9/82) | ||
Protamine deregulation assessed using fertile donors as a standard.
Contingency table comparing incidence of P1 and P2 deregulation in patients with low and high P1/P2 ratios
| Patients with low P1/P2 ratios | Patients with high P1/P2 ratios | |||||||||
|---|---|---|---|---|---|---|---|---|---|---|
| Deregulation | No deregulation | P | Deregulation | No deregulation | P | |||||
| P1 deregulationa (%) | 63 (19/30) | 37 (11/30) | NS | 13 (7/52) | 87 (45/52) | < 0.001 | ||||
| P2 deregulationa (%) | 50 (15/30) | 50 (15/30) | 90 (47/52) | 10 (5/52) | ||||||
Protamine deregulation assessed using fertile donors as a standard.
NS = not significant.
Composition of P1/P2 ratio groups with respect to male diagnosis
| Male infertility diagnosis | P1/P2<0.8 | P1/P2=0.8–1.2 | P1/P2>1.2 | P | ||||
|---|---|---|---|---|---|---|---|---|
| Fertile | 5 (2/37) | 64 (81/127) | 10 (11/108) | < 0.001 | ||||
| Subfertile | 95 (35/37) | 36 (46/127) | 90 (97/108) | |||||
| Clinical diagnosis | ||||||||
| Normozoospermic | 5 (2/37) | 64 (81/127) | 10 (11/108) | |||||
| Asthenozoospermic | 3 (1/37) | 2 (3/127) | 2 (2/108) | |||||
| Oligozoospermic | 5 (2/37) | 1 (1/127) | 0 (0/108) | |||||
| Teratozoospermic | 0 (0/37) | 5 (6/127) | 17 (18/108) | |||||
| Normozoospermic with reduced penetration ability | 14 (5/37) | 7 (9/127) | 7 (8/108) | |||||
| Asthenozoospermic with reduced penetration ability | 11 (4/37) | 9 (11/127) | 6 (7/108) | |||||
| Oligozoospermic with reduced penetration ability | 3 (1/37) | 0 (0/127) | 2 (2/108) | |||||
| Teratozoospermic with reduced penetration ability | 22 (8/37) | 9 (11/127) | 24 (26/108) | |||||
| Asthenoteratozoospermic | 3 (1/37) | 2 (3/127) | 5 (5/108) | |||||
| Oligoasthenozoospermic | 0 (0/37) | 0 (0/127) | 1 (1/108) | |||||
| Asthenoteratozoospermic with reduced penetration ability | 22 (8/37) | 1 (1/127) | 19 (21/108) | |||||
| Oligoasthenozoospermic with reduced penetration ability | 3 (1/37) | 0 (0/127) | 1 (1/108) | |||||
| Oligoteratozoospermic with reduced penetration ability | 3 (1/37) | 1 (1/127) | 2 (2/108) | |||||
| Oligoasthenoteratozoospermic | 3 (1/37) | 0 (0/127) | 2 (2/108) | |||||
| Oligoasthenoteratozoospermic with reduced penetration ability | 5 (2/37) | 0 (0/127) | 2 (2/108) | |||||
Values are percentages (numbers in parentheses).
References
Agarwal A and Allamaneni SS (
Aoki VW and Carrell DT (
Balhorn R, Reed S and Tanphaichitr N (
Belokopytova IA, Kostyleva EI, Tomilin AN and Vorob'ev VI (
Carrell DT and Liu L (
Carrell DT and Urry RL (
Carrell DT, Udoff LC, Hatasaka HH, Jones KP and Peterson CM (
Carrell DT, Peterson CM, Jones KP, Hatasaka HH, Udoff LC, Cornwell CE, Thorp C, Kuneck P, Erickson L and Campbell B (
Chevaillier P, Mauro N, Feneux D, Jouannet P and David G (
Cho C, Willis WD, Goulding EH, Jung-Ha H, Choi YC, Hecht NB and Eddy EM (
Cho C, Jung-Ha H, Willis WD, Goulding EH, Stein P, Xu Z, Schultz RM, Hecht NB and Eddy EM (
Corzett M, Mazrimas J and Balhorn R (
De Jonckheere J, Nelson JE, Ginsburg KA, Martin L and Krawetz SA (
de Yebra L, Ballesca JL, Vanrell JA, Bassas L and Oliva R (
de Yebra L, Ballesca JL, Vanrell JA, Corzett M, Balhorn R and Oliva R (
Johnson PA, Peschon JJ, Yelick PC, Palmiter RD and Hecht NB (
Khara KK, Vlad M, Griffiths M and Kennedy CR (
Lewis JD, Song Y, de Jong ME, Bagha SM and Ausio J (
Manicardi GC, Tombacco A, Bizzaro D, Bianchi U, Bianchi PG and Sakkas D (
Mengual L, Ballesca JL, Ascaso C and Oliva R (
Nelson JE and Krawetz SA (
Oliva R and Dixon GH (
Paldi A (
Papoutsopoulou S, Nikolakaki E, Chalepakis G, Kruft V, Chevaillier P and Giannakouros T (
Steger K (
Steger K, Fink L, Failing K, Bohle RM, Kliesch S, Weidner W and Bergmann M (
Tanaka H, Miyagawa Y, Tsujimura A, Matsumiya K, Okuyama A and Nishimune Y (
World Health Organisation (
Wu JY, Ribar TJ, Cummings DE, Burton KA, McKnight GS and Means AR (
Author notes
1Andrology and IVF Laboratories, 2Department of Surgery, 3Department of Physiology and 4Department of Obstetrics and Gynecology, University of Utah School of Medicine, Salt Lake City, UT 84108, USA
