


Abstract
BACKGROUND: We evaluated basal and dynamic hormonal markers [(FSH, inhibin B, estradiol and anti-Mullerian hormone (AMH)] during the follicular phase and luteal phase of the menstrual cycle and ultrasonic ovarian morphology as predictors of IVF outcome. METHODS: Fifty-six women, aged <38 years, with normal day 3 FSH levels were included prospectively. Serum estradiol, inhibin B and AMH were measured before and 24 h after administration of 300 IU of recombinant FSH on cycle day 3–4 and during the luteal phase. Ovarian volume and antral follicle count (AFC) were evaluated on cycle day 3–4. The predictive value of oocyte number and pregnancy were assessed using uni- and multivariate analysis. RESULTS:Poor responders (<6 oocytes) had significantly lower luteal AMH levels, while high responders (>20 oocytes) had significantly higher AFC, AMH and luteal stimulated inhibin B and estradiol than normal responders. Multivariate regression analyses showed that the best models for predicting oocyte number included AFC, follicular phase AMH and stimulated inhibin B. Only AMH showed a significant difference between pregnant and non-pregnant women at both cycle phases. CONCLUSIONS: In young women (<38 years), AFC or basal AMH and stimulated inhibin B predict ovarian response for IVF. The only predictor for pregnancy is follicular or luteal phase AMH.
Introduction
Determination of ‘ovarian reserve’ is important before any expensive IVF treatment is undertaken. Identification of both low and high responders prior to treatment may decrease cycle cancellation rate and side effects, such as ovarian hyperstimulation syndrome (OHSS). Determination of the probability of pregnancy beforehand is important because of its prognostic value. This allows physicians to evaluate and counsel patients before IVF stimulation and to optimize stimulation protocols or consider other treatment options such as gamete donation or adoption. However, there is no consensus regarding the methods for screening for ovarian reserve or for the probability of pregnancy.
The most common cause for diminution of pregnancy rate is ageing, because of the gradual depletion of the quantity and quality of the follicular pool (Faddy and Gosden, 1996). However, it remains a challenge to identify those young women with normal ovulatory cycles but low ovarian reserve that have a low chance for pregnancy following IVF treatment. Early follicular phase basal FSH (Mausher and Oehninger, 1988; Creus et al., 2000; Chuang et al., 2003), inhibin B (Hall et al., 1999), morphometric ultrasonographic parameters such as antral follicle count (AFC) (Tomas et al., 1997; Pellicer et al., 1998; Chang et al., 1998; Dumesic et al., 2001) and ovarian volume (Lass et al., 1997; Syrop et al., 1999; Frattarelli et al., 2000) were all shown to be correlated with ovarian response in IVF patients. However, in a meta-analysis, it was concluded that basal FSH is not a useful predictor of IVF outcome (Bancsi et al., 2003), possibly because of intercycle variability (Scott et al., 1990; Bancsi et al., 2004). Several studies found no or limited clinical value in measuring basal early follicular inhibin B as an indicator of pregnancy in IVF patients (Hall et al., 1999; Tinkanen et al., 1999; Creus et al., 2000; Ravhon et al., 2000; Dumesic et al., 2001). AFC may be more useful than basal hormonal markers in predicting ovarian response (Dumesic et al., 2001; Bancsi et al., 2003; Popovic-Todorovic et al., 2003; Yong et al., 2003).
Dynamic tests of ovarian reserve have also been performed. These include the well known clomiphene citrate challenge test (CCCT) (Navot et al., 1987) and the GnRH agonist stimulation test, which involves evaluation of changes in estradiol (Garcia et al., 1990; Winslow et al., 1991; Galtier-Dereure et al., 1996; Ranieri et al., 1998) and inhibin B levels (Ravhon et al., 2000) from cycle day 2 or 3 after its administration. The exogenous FSH ovarian reserve test (EFORT) analysed change in estradiol (Fanchin et al., 1994) and inhibin B (Dzik et al., 2000; Elting et al., 2001) seen 24 h after the administration of 300 IU of FSH on cycle day 3–5. These dynamic tests were shown to be more sensitive than basal FSH, inhibin B or age (Kwee et al., 2003; Yong et al., 2003). In addition, serum inhibin B levels early during FSH stimulation for IVF correlated highly with the number of oocytes retrieved (Eldar-Geva et al., 2002; Yong et al., 2003).
A new suggestive marker is the dimeric glycoprotein anti-Mullerian hormone (AMH), also termed Mullerian-inhibiting substance, a member of the transforming growth factor-β (TGF-β) superfamily. AMH is produced by granulosa cells from pre-antral and small antral follicles (Durlinger et al., 2002). Serum AMH levels decrease over time (de Vet et al., 2002) and are strongly related to the number of oocytes retrieved for IVF treatment (Seifer et al., 2002; Van Rooij et al., 2002; Fanchin et al., 2003). However, most previous studies that aimed to find the best predictor(s) from the known ones for IVF outcome did not include AMH in their analysis (Kwee et al., 2003; Popovic-Todorovic et al., 2003; Yong et al., 2003).
The aim of our study was to evaluate ultrasonic ovarian morphology (AFC and ovarian volume) and basal and dynamic hormonal markers (FSH, inhibin B, estradiol and AMH) during the follicular and the luteal phases as predictors of oocyte number and pregnancy in young women undergoing IVF treatment.
Materials and methods
Patients
Fifty-six women undergoing IVF treatment were included prospectively in the study. The inclusion criteria were age <38 years, day 3 FSH serum concentrations <10 IU/l, normal ovulatory cycles with a mean cycle length of between 26 and 35 days, and good physical and mental health. Women with endocrine abnormalities, such as hyperprolactinaemia, polycystic ovarian syndrome or thyroid dysfunction, or ovarian cysts >2 cm in diameter were excluded. The causes of infertility were tubal factor in seven and a male factor in 36 patients. In 11 patients, the infertility was unexplained and in two patients it was related to multiple causes. The Shaare-Zedek Medical Center Research Ethics Committee approved the study protocol. Informed consent was obtained from all participants.
Protocol
During the cycle prior to IVF treatment, the following tests were performed: (i) transvaginal ultrasonographic evaluation of the number of 2–10 mm follicles in both ovaries (AFC) and ovarian volume on cycle day 3–4; and (ii) ‘FSH challenge test’ (FCT) on two occasions, initially on cycle day 3–4 and subsequently during the luteal phase (5–10 days post-ovulation). This involved serum sampling before and 24 h after s.c. administration of 300 IU of recombinant human FSH (Gonal F, Serono, Herzliya, Israel) for determination of FSH, estradiol, inhibin B and AMH. Serum samples were centrifuged at 2000 g within 2 h and stored at −20°C until assayed.
After completion of the luteal FCT, the women were treated with the long downregulation protocol consisting of 0.1 mg/day decapeptyl s.c. (Ferring Ltd, Herzliya, Israel) and after pituitary suppression a daily dose of 150 IU of recombinant FSH (Gonal F; Serono, Israel) and 150 IU of HMG (Menogon; Ferring Ltd). The dose of gonadotrophins was adjusted from day 5 of stimulation according to the ovarian response. HCG 10 000 IU (Chorigon; Teva, Petach-Tiqua, Israel) was given when at least three follicles >17 mm developed. Oocytes were retrieved transvaginally 36 h later. A maximum of three embryos were transferred. The luteal phase was supported by 600 mg/day vaginal micronized progesterone (Utrogestan; CTS, Petach-Tiqua, Israel) or by 50 mg/day progesterone i.m. (Gestone; Ferring Ltd).
Hormone assays
Serum concentrations of estradiol and FSH were measured using Immulite 2000 (Diagnostic Product Corporation, Los Angeles, CA). Assay sensitivities were 150 pmol/l and 0.1 IU/l, respectively. Inter- and intra-assay coefficients of variation were 9.2 and 4.9% for estradiol and 4.3 and 3.6% for FSH, respectively. Serum inhibin B concentrations were measured using a highly sensitive two-site enzyme-linked immunosorbent assay (ELISA; Serotec, Oxford, UK). The assay sensitivity was 15 pg/ml. Inter- and intra-assay coefficients of variation were 15 and 7%, respectively. AMH concentrations were measured using an ultrasensitive two-site ELISA (Immunotech-Coulter, France). The assay sensitivity was 0.7 pmol/l. Inter- and intra-assay coefficients of variation were 8.7 and 5.3%, respectively.
Statistical analysis
The main outcome measures of our study were the number of oocytes retrieved and ongoing pregnancy. Student’s t-test, Mann–Whitney U-test and Fisher’s exact test were performed for testing for differences between groups, as indicated. Analysis of variance (ANOVA) or Friedman tests were used for repeated measurements. Univariate linear regression analyses were performed, with the number of oocytes retrieved as the dependent variable. Independent variables included diagnosis, treatment cycle number, age, weight, body mass index (BMI), day 3 FSH, AFC, ovarian volume, early follicular phase and mid-luteal phase basal and stimulated estradiol, inhibin B and AMH and their increments (Δ serum hormone level, i.e. stimulated minus basal levels). Multivariate stepwise linear regression analyses of covariance (ANCOVA) were also used. Related variables were not used in the same model. The ability of parameters to discriminate between pregnant and non-pregnant patients was assessed by calculating the area under the receiver operating characteristic curve (ROCAUC). Samples with hormone values below the assay detection limit were assigned values equal to the detection limit of that assay. Results are presented as mean ± SD, unless otherwise indicated. The SPSS statistical package was used for all statistical analyses. Statistical significance was defined as P < 0.05.
Results
Of the 56 women tested, seven had <6 oocytes (poor responders), 32 had 6–19 oocytes (normal responders) and 17 had ≥20 oocytes (high responders). The characteristics of the women are presented in Table I. Poor responders had significantly lower luteal phase serum AMH levels, while high responders had significantly higher follicular and luteal phase AMH levels compared with normal responders. High responders had in addition significantly higher AFC, ovarian volume and luteal phase Δ inhibin B and stimulated estradiol.
Characteristics of patients and tests
| Variable | Poor responders (n=7) | Normal responders (n = 32) | High responders (n = 17) |
|---|---|---|---|
| Age (years) | 32.1 ± 6.0 | 30.4 ± 4.5 | 28.7 ± 4.1 |
| BMI (kg/m2) | 23.5 ± 4.3 | 23.7 ± 5.3 | 24.3 ± 6.3 |
| No. of treatment cycles | 1.4 ± 0.8 | 2.2 ± 2.2 | 1.8 ± 1.6 |
| Follicular phase variables | |||
| Basal FSH (IU/l) | 8.3 ± 1.6 | 8.3 ± 3.4 | 5.8 ± 2.3 |
| Basal inhibin B (pg/ml) | 79.4 ± 19.8 | 137.9 ± 210.6 | 127.8 ± 126.5 |
| Stimulated inhibin B (pg/ml) | 136.2 ± 40.4 | 222.9 ± 268.7 | 296.9 ± 269.1 |
| Δ inhibin B (pg/ml) | 56.8 ± 30.1 | 85.0 ± 66.7 | 169.1 ± 171.3 |
| Basal AMH (pmol/l) | 13.6 ± 11.3 | 14.1 ± 7.5 | 37.8 ± 19.3c |
| Stimulated AMH (pmol/l) | 11.0 ± 6.7 | 14.1 ± 7.0 | 40.3 ± 22.6b |
| Basal estradiol (pmol/l) | 208 ± 119 | 161 ± 39 | 161 ± 59 |
| Stimulated estradiol (pmol/l) | 343 ± 112 | 283 ± 155 | 343 ± 274 |
| AFC | 11.5 ± 9.2 | 18.8 ± 8.5 | 38.9 ± 16.7 b |
| Ovarian volume (ml) | 8.0 ± 3.5 | 13.4 ± 5.1 | 36.5 ± 33.9a |
| Luteal phase variables | |||
| Basal inhibin B (pg/ml) | 29.3 ± 16.6 | 29.5 ± 25.3 | 64.9 ± 85.1 |
| Stimulated inhibin B (pg/ml) | 49.6 ± 20.6 | 72.5 ± 54.6 | 218.5 ± 184.9 |
| Δ inhibin B (pg/ml) | 20.3 ± 20.5 | 41.3 ± 49.6 | 153.6 ± 109.8a |
| Basal AMH (pmol/l) | 3.6 ± 1.9 d | 17.5 ± 9.3 | 33.1 ± 15.8b |
| Stimulated AMH (pmol/l) | 5.5 ± 5.1 b | 23.6 ± 33.0 | 34.7 ± 15.9a |
| Basal estradiol (pmol/l) | 451 ± 151 | 339 ± 147 | 435 ± 175 |
| Stimulated estradiol (pmol/l) | 451 ± 151 | 437 ± 252 | 737 ± 367a |
aP < 0.05, bP < 0.01, cP < 0.005, dP < 0.001 versus normal responders.
The net increase in serum FSH 24 h following its administration was similar between the follicular and the luteal phases (3.3 ± 2.2 and 4.1 ± 1.8 IU/l, respectively, P = 0.11) and was not associated with any parameter tested. Serum inhibin B increased in all women 24 h following FSH stimulation, both in the follicular phase and in the luteal phase; the net increase (Δ inhibin B) was higher in the follicular phase (Table I). For each patient, the degree of inhibin B response to FSH was similar in both cycle phases (Friedman test). In contrast to inhibin B and estradiol, AMH did not change 24 h following FSH stimulation, either at the early follicular or at the luteal phase (paired Student’s t-test).
The number of oocytes retrieved showed highly significant positive correlations with AFC, AMH and follicular phase Δ inhibin B (Table II, Figure 1). Less, but still significant positive correlations were also found with follicular and luteal phase stimulated inhibin B. Negative correlations were found with age and basal FSH.
Significant Pearson’s correlation between oocyte number and test parameters
| Variable | r value |
|---|---|
| Age (years) | −0.275a |
| Follicular phase variables | |
| Basal FSH (IU/l) | −0.356a |
| Stimulated inhibin B (pg/ml) | 0.458 a |
| Δ inhibin B (pg/ml) | 0.558b |
| Basal AMH (pmol/l) | 0.647b |
| Stimulated AMH (pmol/l) | 0.700b |
| AFC | 0.728b |
| Luteal phase variables | |
| Stimulated inhibin B (pg/ml) | 0.358a |
| Δ inhibin B (pg/ml) | 0.384a |
| Basal AMH (pmol/l) | 0.518b |
| Stimulated AMH (pmol/l) | 0.576b |
P < 0.05, bP < 0.001.
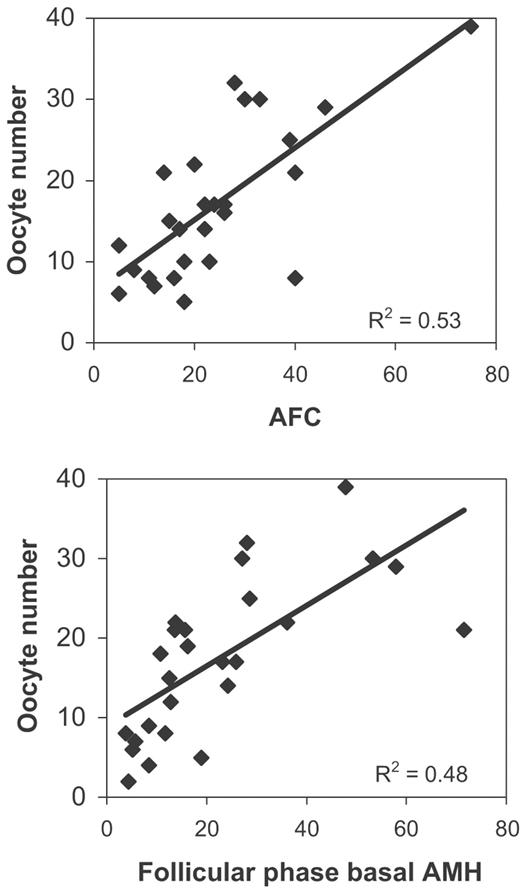
Correlation between oocyte number and AFC and AMH in early follicular phase.
Significant correlations were found between AFC and some endocrine markers (Table III, Figure 2). The most significant correlations were found with follicular phase inhibin B and AMH. Less significant correlations were found with luteal phase AMH and inhibin B. The correlation between AFC and the number of follicles >10 mm on the day of HCG administration was 0.673 (P < 0.0001).
Significant Pearson’s correlation coefficients between AFC and endocrine markers
| Variable | r |
|---|---|
| Follicular phase variables | |
| Basal inhibin B (pg/ml) | 0.708c |
| Stimulated inhibin B (pg/ml) | 0.788c |
| Δ inhibin B (pg/ml) | 0.731b |
| Basal AMH (pmol/l) | 0.759 c |
| Stimulated AMH (pmol/l) | 0.788c |
| Stimulated estradiol (pmol/l) | 0.451a |
| Luteal phase variables | |
| Basal inhibin B (pg/ml) | 0.451a |
| Stimulated inhibin B (pg/ml) | 0.477a |
| Δ inhibin B (pmol/l) | 0.465a |
| Basal AMH (pmol/l) | 0.615c |
| Stimulated AMH (pmol/l) | 0.511b |
aP < 0.05, bP < 0.01, cP < 0.001.
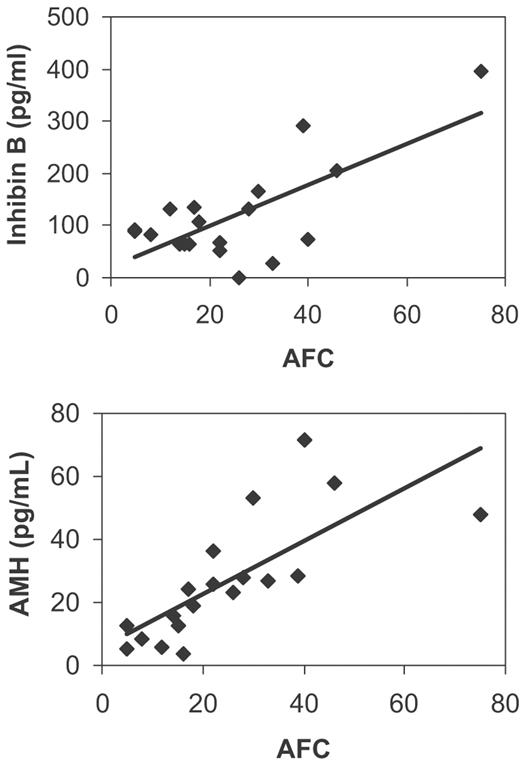
Correlation between AFC and follicular phase inhibin B and AMH.
Multiple regression ANCOVA showed that the best model for predicting the number of oocytes included AFC alone (adjusted r2 = 0.657, P < 0.0001). Adding endocrine markers to the model did not improve its significance. When only endocrine parameters were entered into the model, the combination of follicular phase AMH (P < 0.05) and Δ inhibin B (P < 0.01) was selected (adjusted r2 = 0.624, P < 0.001).
Twenty-six women conceived as a result of the IVF cycle treatment (46%). The clinical and test results of pregnant and non-pregnant women are presented in Table IV. The only parameter that showed significant difference between the two groups was AMH, at both cycle phases. A cut-off basal AMH (either follicular or luteal) of 18 pmol/l had a positive predictive value of 67% and a negative predictive value of 61% for achieving an ongoing pregnancy (P < 0.01). The ROCAUC was 0.75 (95% confidence interval 0.61–0.87, P = 0.003).
Comparison between pregnant and non-pregnant women
| Variable | Pregnant (n = 26) | Non-pregnant (n = 30) |
|---|---|---|
| Age (years) | 29.5 ± 4.4 | 30.6 ± 4.9 |
| BMI (kg/m2) | 23.6 ± 4.7 | 23.6 ± 5.3 |
| No. of treatment cycles | 2.5 ± 2.5 | 1.5 ± 0.8 |
| Follicular phase variables | ||
| Basal FSH (IU/l) | 6.0 ± 1.5 | 8.4 ± 3.5 |
| Basal inhibin B (pg/ml) | 98.2 ± 96.1 | 138.8 ± 200.5 |
| Stimulated inhibin B (pg/ml) | 239.8 ± 249.0 | 219.0 ± 240.8 |
| Δ inhibin B (pg/ml) | 141.6 ± 159.9 | 80.2 ± 60.6 |
| Basal AMH (pmol/l) | 28.1 ± 18.3 a | 13.8 ± 9.6 |
| Stimulated AMH (pmol/l) | 28.6 ± 20.4 a | 12.7 ± 7.2 |
| Basal estradiol (pmol/l) | 183 ± 81 | 196 ± 94 |
| Stimulated estradiol (pmol/l) | 307 ± 202 | 348 ± 198 |
| AFC | 26.4 ± 16.5 | 21.4 ± 12.5 |
| Ovarian volume (ml) | 25.0 ± 29.3 | 13.7 ± 6.0 |
| Luteal phase variables | ||
| Basal inhibin B (pg/ml) | 28.9 ± 38.1 | 43.6 ± 48.7 |
| Stimulated inhibin B (pg/ml) | 110.2 ± 118.2 | 89.8 ± 104.1 |
| Δ inhibin B (pg/ml) | 78.0 ± 88.8 | 46.2 ± 64.0 |
| Basal AMH (pmol/l) | 25.2 ± 14.3 b | 14.2 ± 9.5 |
| Stimulated AMH (pmol/l) | 28.4 ± 15.8 b | 13.8 ± 8.8 |
| Basal estradiol (pmol/l) | 366 ± 182 | 379 ± 138 |
| Stimulated estradiol (pmol/l) | 508 ± 363 | 718 ± 240 |
P < 0.02, bP < 0.005, Student’s t-test
Discussion
In the current study, we investigated the value of morphometric, basal and dynamic endocrine parameters during the follicular and the luteal phases as predictors of IVF outcome in young women (<38 years old) with normal day 3 FSH (<10 IU/l). While most previous studies and meta-analyses have focused on prediction of low responders (Hendriks et al., 2005), we showed in this study that we could predict, with reasonable accuracy, the number of oocytes to be retrieved as a continuous measurement, thus, both low and high responders could be identified. Using multivariate analysis, we found that the best model for predicting the number of oocytes to be retrieved comprises ultrasonic assessment of AFC. The adding of any endocrine measurements could not improve the significance of the model. However, when only endocrine markers were tested, the combination of follicular phase basal AMH and inhibin B increment following FSH stimulation (Δ inhibin B) was also highly significant. Nevertheless, AMH, either early follicular or luteal, was the only parameter that was significantly different between pregnant and non-pregnant women and could offer significant prognostic value for an ongoing pregnancy.
Our finding that either ultrasonography or endocrine test could predict the ovarian response has major clinical importance. The availability and cost of either ultrasonography or serum hormone assays is different in various countries. The correlation between AFC and inhibin B and AMH, especially in the early follicular phase (Table III), in both this and previous studies (Bancsi et al., 2002; Yong et al., 2003), is explained by the fact that both signify the number of small antral follicles (Durlinger et al., 2002; Pangas et al., 2002).
We found that dynamic endocrine tests were better than basal evaluation of FSH, inhibin B or estradiol in predicting ovarian response. This is similar to findings in previous studies (Dzik et al., 2000; Ravhon et al., 2000; Elting et al., 2001; Kwee et al., 2003; Popovic-Todorovic et al., 2003; Yong et al., 2003). In addition, we found that stimulated inhibin B was better than stimulated estradiol, in agreement with Kwee and co-authors (2003). The secretion of inhibin B, FSH and estradiol is mutually co-modulated. Very small antral follicles secrete inhibin B, but not estradiol, in response to FSH stimulation. The extent of inhibin B response to standard FSH dose reflects the size of the cohort of healthy recruitable follicles. These follicles are present in the ovaries during both the luteal and the follicular phases. Indeed, we demonstrated that the degree of serum inhibin B response to standard exogenous FSH stimulation was similar between the follicular and the luteal phase, in accordance with Yong and co-investigators (2003). In addition, we found that early follicular and mid-luteal serum AMH levels were very similar, in accordance with Cook and co-workers (2000). The option to perform the test in either phase is more convenient to the patient. Currently used methods must be performed in the early follicular phase and some, such as the CCCT, have added inconvenience since this test takes longer than a week to be performed.
In contrast to the combination of ultrasonic and endocrine parameters, which could predict ovarian response, the only significant predictor of the probability of achieving a pregnancy was AMH. The pregnancy rate in the entire group was 46%. The best positive and negative predictive values were 67 and 61%, respectively, and the ROCAUC was 0.75, which, although significant, gives only a fair ability to predict pregnancy. Even so, AMH added a considerable prognostic value: The probabilities of a pregnancy for women with serum AMH ≥18 pmol/l or <18 pmol/l are 67 and 39%, respectively. Recently, Hazout et al. (2004) also showed that day 3 serum AMH had a greater independent contribution in predicting pregnancy following IVF treatment than inhibin B, FSH or estradiol. On the contrary, very recently, Penarrubia et al. (2005) found in a heterogeneous group of women that serum AMH levels, either basal or following 4 days of FSH stimulation, were not useful in prediction of pregnancy following IVF treatment. Yet, basal and stimulated day 5 AMH levels were significantly lower in women whose cycles were cancelled because of a poor ovarian response. Therefore, definite clinical applicability of AMH measurement as a predictor of pregnancy in various populations requires further studies in a large group of patients.
Before the use of AMH, it was concluded that inhibin B reflects ovarian reserve but is less useful at predicting pregnancy (Hall et al., 1999). In a recent meta-analysis, Hendriks et al. (2005) found that although AFC, and to a lesser extent day 3 FSH, performed well in the prediction of poor ovarian response, both failed in predicting pregnancy. Ongoing pregnancy rates depend on ovarian reserve and on many other factors such as sperm parameters, factors influencing fertilization, implantation and abortion. Therefore, in small series, factors found to predict oocyte number may not predict the probability of pregnancy at the same statistical significance. However, an important factor beside the oocyte quantity that determines the chance of pregnancy is oocyte quality. It was shown that in young women with low ovarian reserve, oocyte quality, but not quantity, could predict pregnancy (van Rooij et al., 2004). AFC and the associated endocrine markers for follicular number could predict oocyte number, but not inevitably oocyte quality. Female age, which correlates with oocyte quality, was shown to be superior to inhibin B levels at predicting pregnancy in IVF ( Hall et al., 1999; Creus et al., 2000). Since all patients in our study were young (<38 years), other factors related to oocyte quality could be identified. A direct marker of oocyte quality has yet to be found. However, it has been shown that serum insulin-like growth factor-I (IGF-I)/IGF-binding protein-1 (IGFBP-1), but not inhibin B, indicated oocyte quality in assisted reproduction treatments (Fried et al., 2003). Our results may support the assumption that there is an association between AMH and oocyte quality. This issue requires further studies in a large group of patients.
Prediction of the chance of pregnancy allows physicians to provide the patients with information about their prognosis and consider other treatment options, such as gamete donation or adoption. Prediction of ovarian response is additionally important because it may help to optimize the stimulation protocol for achieving a better response, in both low and high responders (Kligman and Rosenwaks, 2001; Popovic-Todorovic et al., 2003). In the current study, we found that either ultrasonic (AFC) or endocrine assessment (basal AMH and stimulated inhibin B) could predict ovarian response, while the only predictor for pregnancy was either follicular or luteal phase AMH level.
The authors are grateful to the nursing and secretarial staff of the IVF Unit in Shaare-Zedek Medical Center for their assistance, to Taly Avraham-Bdolach for statistical analysis of the results, and to Shunit Damary for her participation in the recruitment of patients.
References
Author notes
1IVF Unit, 2Institute of Hormone Research and 3Ultrasound Unit, Department of Obstetrics and Gynecology, Shaare-Zedek Medical Center, Ben Gurion University of the Negev, Jerusalem 91031, Israel
