


Abstract
A model suggesting that high perception of stigma is associated with reduced disclosure to others, leading to lower social support and higher distress in new attendees at an infertility clinic is tested.
Questionnaires measuring stigmatization (Stigma consciousness questionnaire), disclosure of fertility difficulties (Disclosure questionnaire), social support (Duke-UNC Functional Social Support Questionnaire) and fertility-related [Fertility Problem Inventory (FPI)] and generic distress [Hospital Anxiety and Depression Scale (HADS)] were completed by 87 women and 64 men. Data were analysed by gender comparisons, correlations and path analysis.
Women reported higher stigma and disclosure than men. For women, stigma and disclosure were unrelated but in men higher stigma was associated with lower disclosure. Perceptions of stigma were related to low social support for both genders. Social support was negatively related to anxiety, depression and overall infertility distress and showed greater predictive capacity than satisfaction with partner relationship. Testing the model showed that, for men, stigma was linked to lower disclosure and support and higher fertility-related and generic distress. Disclosure itself did not link to support. For women, greater disclosure linked only to higher generic distress. Stigma was directly linked to fertility-related distress and to low perceived support which mediated a relationship with generic distress.
Stigma and the wider social context should be considered when supporting people with fertility problems. Greater disclosure may be associated with higher distress in women.
Introduction
Infertility now affects a significant proportion of couples. Some studies suggest that this can be associated with elevated levels of distress, particularly in women whether or not treatment is sought (Greil, 1997; Slade et al., 1997; King, 2003; McQuillian et al., 2003) whereas others have emphasized the emotional normality of samples (Downey et al., 1989; Downey and McKinney, 1992). Psychosocial factors such as cognitive appraisals, have been identified as influencing emotional status and higher perceived social support is also associated with greater global life quality for both men and women, and lower emotional distress for women with fertility difficulties (Connolly et al., 1992; Nachtigall et al., 1992; Abbey et al., 1994). The role of social support as a buffer in the context of stressors other than infertility is well documented (Taylor and Seeman, 1999). However, people experiencing infertility often report feelings of isolation (Imerson and McMurray, 1996). Indeed, Schmidt et al. (2005) reported that distress in the social domain increased for both men and women who had not achieved a pregnancy in 12 months of treatment.
The general literature on coping suggests that individuals seek social support less in situations which threaten self-esteem (Folkman et al., 1986). Infertility may threaten self-esteem due to its potentially stigmatizing nature. A stigma is defined as a negative sense of social difference from others, that is, so outside the socially defined norm, it is both deeply discrediting and devalues the individual (Goffman, 1963). Desire for children is typically seen as the norm within societies (Rosenblatt et al., 1973) and indeed may have a survival dimension. Therefore, childlessness in couples could be seen as a form of ‘deviant behaviour’. If infertility is experienced as stigmatizing (Whitford and Gonzalez, 1995), this may isolate people from potential sources of support.
People who do not disclose their fertility difficulties to others risk being assumed as voluntarily childless, itself identified as stigmatizing (Lampman and Dowling, 1995). Whiteford and Gonzalez (1995) found that couples without children who had not confided in others about their fertility difficulties suffered joking questions and comments about their sexual behaviour and potential or absent outcomes. Such experiences may result in more fear around disclosure, feelings of isolation and withdrawal from social situations, which could then impact on emotional status. However, where the fertility problem is known to others, it has been shown that people are likely to receive comments that they perceive as unsupportive (Miall, 1985). The importance of others' knowledge and responses is further endorsed by Mindes et al. (2003) who found that not only were unsupportive responses from others associated with poorer adjustment at the time, but they also predicted depressive symptoms and psychological distress in those who subsequently remained infertile.
It has been postulated that secrecy requires constant vigilance in social interactions and therefore has significant psychological costs (Smart and Wegner, 2000). Specifically, ‘the pre-occupation model’ suggests that the more one attempts to suppress a particular idea the more it intrudes into consciousness. Wegner (1994) has postulated the idea of a duality of processing involving conscious suppression and then unconscious ‘ironic monitoring’ of that process which inevitably brings those thoughts into consciousness. There are therefore grounds to suggest that higher stigma may link with lower disclosure and greater distress. Van Balen and Trimbos-Kemper (1994) suggested that the 10% of men who kept their infertility as a secret were more distressed. Disclosure is also an important issue in a variety of health conditions such as HIV status. Kelly and McKillop (1996) provide a detailed discussion of psychological issues related to patterns of disclosure.
The quality of the relationship (Newton et al., 1999) and communication (Schmidt et al., 2005) with the partner impact on the emotional status of subfertile couples. The partner is potentially a crucial source of support for men and women who are reluctant to discuss their fertility difficulties with others (Hirsh and Hirsh, 1989). In the context of a stigmatizing stressor, the need for the partner for support and emotional well-being may well increase.
Seeking treatment itself requires some level of confrontation and disclosure. However, the possible influence that the infertility-related perceived stigma and disclosure patterns may have on physical, emotional and social well-being has received little attention. A greater understanding of the factors influencing the levels of distress and well-being at this early stage in the process could prove valuable to counsellors and other health professionals when identifying those in greater need of input and also potentially inform the content of therapeutic work. Most previous studies have tended to focus on the emotional responses encountered later in the process, after a specific diagnosis has been made or when the treatment is initiated. There is evidence to suggest a relationship between stress indicators and sperm quality (Fukuda et al., 1996; Pook et al., 1999) and ovarian response to treatment (Lancastle and Boivin, 2005), which highlights the importance of identifying the factors that may influence stress in the early stages of the process.
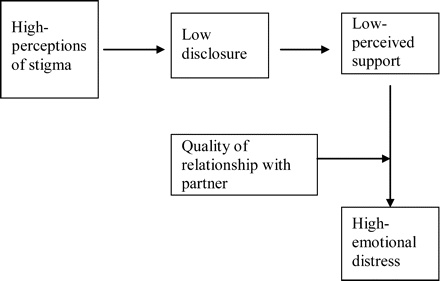
Understanding the relationships between perceived stigma, disclosure, social support and partner relationship may therefore assist in prediction of levels of distress. A potential model for understanding how these variables may interact is presented in Fig. 1. People experiencing infertility problems may perceive infertility as being stigmatizing. This may result in lower disclosure of their difficulties to others. Lower disclosure may result in lower social support and as others are unaware of the couples' difficulties, the couple may face insensitive comments in relation to their childlessness. Feelings of isolation and perception of low social support may then adversely affect distress levels. This may be influenced by the quality of relationship with the partner.
A predictive model for emotional distress in infertility
Measures of distress may be generic or specifically infertility related. Infertility-related distress can potentially lead to more generalized distress where individuals begin to experience anxiety or depression symptoms in relation to other areas of their lives. Finally, as differential role expectations and socializations exist for men and women (Becker, 1990; Greil, 1991), the perception of stigma in relation to subfertility is likely to differ. Consequently, gender differences must be considered within this model.
The present study aims to
describe and compare the levels of perceived stigmatization, disclosure patterns and social support in men and women embarking on infertility work-up and to make gender comparisons;
test the model of proposed inter-relationships between stigma, disclosure, social support, partner relationship and fertility related and generic distress.
Specific hypotheses
Stigma is inversely related to disclosure and social support and positively associated with fertility related and general distress;
disclosure is inversely related to social support;
social support is inversely related to fertility and general distress;
the effect of perceived stigma on emotional distress will be affected by disclosure, partner and generic social support.
Materials and Methods
Participants
Participants were men and women attending a specialist infertility centre for their first appointment between December 2002 and March 2003. One hundred and fifty-one people [87 women and 64 men (62 couples)] completed the study. This constitutes 43% of a consecutive sample of attendees fulfilling the following inclusion criteria: (i) new attendees for infertility treatment, (ii) have no children from their relationship and (iii) with sufficient English language to understand and complete the measures. As the purpose was to investigate these factors as they relate to those embarking on infertility work-up, it was appropriate to be as inclusive as possible.
Men in the sample were significantly older (mean = 34.8 years, SD = 6.3) than the women (mean = 31.8 years, SD = 5.7), (t = 3.06, d.f. 149, P < 0.01). The mean number of years participants had lived with their partner was 5.33 (SD = 3.68) and 66.9% were married. These demographic characteristics of the study sample are in harmony with those of the infertility first attenders population in terms of age with mean ages for men of 35.4 years (SD = 6.3) and women of 31.8 years (SD = 5.8). However, the study participants were slightly more likely to be married, 66% versus 60% for the potential population.
Table 1 shows the sample characteristics. For both men and women, the samples are slightly skewed towards the upper social class categories, based on the occupational status (Standard Occupational Classification, 1991) and participants were predominantly of white background. Ethnic minorities were less represented within the sample than within the clinic as a whole (5% versus 15%).
Sample characteristics
| Men-frequencies (n = 64) (%) | Women-frequencies (n = 87) (%) | |
|---|---|---|
| Highest educational qualification | ||
| No exams | 4 (6.3) | 3 (3.4) |
| General Certificate Secondary Education (GCSE)/Ordinary (O) level | 22 (34.4) | 31 (35.6) |
| Advanced Level | 6 (9.4) | 8 (9.2) |
| Vocational Qualification | 11 (17.2) | 16 (18.4) |
| Degree/Further Degree | 21 (32.8) | 29 (33.3) |
| Social class based on occupationa | ||
| I | 9 (14.8) | 9 (11.1) |
| II | 23 (37.7) | 26 (32.1) |
| III | 18 (29.5) | 36 (44.4) |
| IV | 10 (16.4) | 6 (7.4) |
| V | 1 (1.6) | 4 (4.9) |
| Ethnicity | ||
| White Background | 61 (95.3) | 82 (94.3) |
| Pakistani | 1 (1.6) | 1 (1.1) |
| African | 1 (1.6) | 2 (2.3) |
| Not Specified | 1 (1.6) | 2 (2.3) |
aTaken from the Standard Occupational Classification (1999).
Table 2 presents the fertility characteristics of the participants. The women reported experiencing fertility difficulties for slightly longer than the men. Five women and nine men had had a biological child from a previous relationship and one man and one woman had an adopted child.
Fertility characteristics
| Fertility characteristics | Men (n = 64) | Women (n = 87) |
|---|---|---|
| Mean duration of infertility (SD) | 2.76 years (2.78) | 3.44 years (3.38) |
| (Partner) Pregnant before (%) | 19 (29.7) | 32 (36.8) |
| (Partner) Outcome | ||
| Spontaneous abortion (%) | 8 (42.1) | 13 (40.6) |
| Ectopic pregnancy (%) | 1 (5.3) | 3 (9.4) |
| Termination (%) | 5 (26.3) | 8 (25.0) |
| Live birth (%) | 5 (26.3) | 8 (25.0) |
Procedure
The study was approved by the South Sheffield Ethics Committee. A letter from the medical consultant inviting potential volunteers was sent along with their initial appointment documents. An information sheet providing details of the study was also included as well as a reply slip, which the couples were asked to bring to their initial appointment, detailing whether or not they were willing to be approached to discuss participation in the study. Those in agreement were then approached at the clinic by the researcher, prior to their appointment. Participants were provided with a questionnaire booklet to complete, separately and without consulting with one another, while waiting for their appointment or to post back if time was insufficient.
Measures
The following measures were administered in the form of a questionnaire booklet.
Adapted stigma consciousness questionnaire (Scale available from the authors)
The stigma consciousness questionnaire (SCQ) (Pinel, 1999) was developed to predict the extent to which individuals expect to be stereotyped and discriminated against by others in general. This 10-item scale was designed to be modified for different stigmatized groups and therefore was adapted to measure stigma consciousness relating to fertility difficulties. It included items such as ‘other people have a lot more negative thoughts about people with fertility difficulties than they actually express’ and ‘Most people without fertility difficulties have a problem viewing those with them as equals’. One item from the 10-item scale (Number 9 relating to whether those without fertility difficulties are perceived to discriminate against those with) produced low internal consistency, and therefore, was discarded from further analysis. A final score of stigma consciousness was determined by totalling the remaining nine items, scores ranged from 0 to 54, with higher scores indicating greater stigma consciousness. The final scale produced an acceptable internal consistency, Cronbach's alpha score, of 0.77.
The Disclosure Questionnaire (Scale available from the authors)
A 17-item questionnaire was developed to assess disclosure behaviour. The development of this questionnaire was informed by the patient profile questionnaire (Henderson et al., 2002), designed to assess disclosure behaviour in cancer patients. The measure asks who ‘the participant has spoken to or asked another to tell about their fertility difficulties’ and yields three scores—disclosure to immediate family, disclosure to others and total disclosure.
Section 1 covers disclosure to immediate family. Responses relate to eight categories covering their own or partner's mother, father, brothers and sisters, respectively. A score of 1 was available for each of the four sections for own and partner's family told. A score of − 1 was given to each parent/partner's parent that was available to disclose to but who was not told. To score disclosure to own and partner's brothers and sisters, respectively, − 1 was given if no siblings of a particular gender were told and a score of − 1 was also given if partner's siblings of that gender were not told. If some brothers or sisters were told a score for disclosing to that grouping was derived by calculating how many were told divided by the number available to tell. A score of 0 was given to any category where there was no one available to tell. Total scores for immediate family had a possible range of − 8 to 8. Negative scores indicate non-disclosure despite the family member being available to tell whereas higher scores indicate more people told.
Section 2 covers disclosure to others and assesses the number of other people told in the categories of: own and partner's other family members, close and distant friends, co-workers, people having similar difficulties and others in general. Respondents indicated which frequency rating was appropriate for each category with five possible options (0, 1, 2–4, 5–10 and more than 10). Scores from each category were totalled using the lower end of the frequency range. Higher scores indicated more people told.
An overall total disclosure score was calculated which was the total number of people disclosed to, based on the total number of family members told and the ‘others’ scores. Spearman correlations identified high consistency between these measures of disclosure with no coefficients falling below 0.7. As a result for the path analysis, to test the proposed model, total number of people disclosed to was the chosen variable. However, the separate dimensions are shown for the individual analyses.
The Duke-UNC functional social support questionnaire (Broadhead et al., 1988)
This eight-item, functional, social support questionnaire yields a single total support score, with higher scores indicating greater perceptions of support, was used. The scale showed high internal consistency (Cronbach's alpha = 0.88). An example of an item (reverse scored) is ‘I get invitations to go out and do things with other people’ with visual analogue ratings being from ‘as much as I would like’ to ‘much less than I would like’.
Dyadic Adjustment Scale-7 (Spanier, 1976)
A seven-item short form of the dyadic adjustment scale (DAS) (Spanier, 1976) was used to assess levels of adjustment and distress in the couple relationship. This measure contains seven items, six measured on a six choice-scale and one on a seven-choice scale, with higher scores indicating more relationship adjustment. The short form has well-established validity (Sharpley and Rogers, 1984; Hunsley et al., 2001). The present study identified high internal consistency (Cronbach's alpha = 0.80).
The Fertility Problem Inventory (Newton et al., 1999)
This standardized measure was selected as a means of measuring fertility specific distress. It consists of 46 items, rated on a six-choice scale, with higher scores indicating more psychological strain or distress. It assesses fertility related distress falling under five domains, social, sexual, relationship, future concern and role identification, with a final score indicating overall infertility-related strain. High internal consistency for the whole scale was found for the present study (Cronbach's alpha = 0.93).
The Hospital Anxiety and Depression Scale (Zigmond and Snaith, 1983)
This standardized measure, designed for use with a medical population, was selected as a general measure of distress, assessing anxiety and depression symptoms. It consists of seven depression items and seven anxiety items, which are rated on a scale of 0 to 3. This scale has shown good reliability and validity, with internal consistency, assessed by Cronbach's alpha, being 0.90 for the depression scale and 0.93 for the anxiety scale. A total of the two dimensions are used as a measure of general distress.
Analyses and statistics
Analyses were conducted using SPSS11.0 with parametric and non-parametric statistics being applied dependent on the nature of the distributions. Data are presented as means (standard deviation) and a P-value < 0.05 was considered significant. To test the proposed model, a path analysis was completed using the approach outlined by Kenny (2004). The value of a path analysis in this context is that it provides an integrated understanding of how factors may inter-relate to lead to the critical outcomes of high distress and therefore identifies potential underlying psychological processes. In this approach to path analysis, direct and indirect paths between variables are tested by regression analysis and the significant paths retained. P-values < 0.05 were taken as significant.
Results
Gender comparisons
Gender differences were analysed using the independent t-test or Mann–Whitney test. Table 3 shows women had disclosed to significantly more people than men despite reporting higher stigma. Women also scored significantly higher than men on all three measures of distress (infertility-related strain, anxiety and depression symptoms). Women were found to score significantly higher than men on all subscales of the FPI with the exception of childfree/status quo acceptance.
Gender comparisonsa
| Variable | Men (n = 64) Mean (SD) | Women (n = 87) Mean (SD) | t/z scores (t-tests/Mann–Whitney) |
|---|---|---|---|
| Disclosure to immediate own and partners' family | −1.54 (5.63) | −0.00 (5.06) | t = −1.71 |
| Disclosure to others | 4.45 (8.29) | 5.36 (8.54) | z = −1.55 |
| Total number of people disclosed to. | 7.16 (10.48) | 8.80 (10.23) | z = −1.969* |
| Stigma | 16.81 (8.05) | 22.30 (9.93) | t = −3.63*** |
| Perceived social support | 34.22 (5.35) | 32.87 (6.86) | z = −0.91 |
| Infertility-related strain (FPI) separate subscales: | 119.30 (28.25) | 143.69 (33.8) | t = −4.79*** |
| Social concern | 20.86 (7.46) | 30.47 (9.69) | t = −6.86*** |
| Sexual concern | 17.09 (6.82) | 21.20 (8.19) | t = −3.34** |
| Relationship concern | 20.73 (7.74) | 23.59 (9.27) | t = −2.00* |
| Role identification | 32.56 (10.49) | 38.50 (9.66) | t = −3.59*** |
| Childfree/status quo acceptance | 28.05 (7.58) | 29.97 (7.82) | t = −1.51 |
| Anxiety symptoms (HADS) | 6.20 (3.56) | 8.91 (3.93) | t = −4.35*** |
| Depressive symptoms (HADS) | 2.34 (2.1) | 3.93 (3.19) | t = −3.68*** |
*P < 0.05, **P < 0.01, ***P < 0.001 (all two-tailed).
aNon-parametric analyses are provided where there is deviation from normality.
Child status and duration of infertility
The few participants who had had a biological child showed no significant differences in stigma and duration of infertility was uncorrelated with any outcome measure except anxiety in men (rs = 0.33, P < 0.05).
Relationships between stigma, disclosure and social support
The associations between stigma, disclosure and perceived social support were measured using Spearman's correlations. For men, stigma consciousness was significantly, negatively correlated with the total number of people disclosed to (rs = −0.26, P < 0.05). For women, there were no associations between stigma and disclosure. No significant associations were found between disclosure patterns and perceived available social support for men or women. However, negative relationships between stigma consciousness and perceived social support were identified for both genders (rs = −0.42, P < 0.01 for men and rs = −0.28, P < 0.01 for women).
The relationship between measures of perceived support and distress
The relationships between perceived availability of social support, relationship satisfaction and the measures of distress were assessed using Spearman's correlations (separately for men and women). Table 4 shows that for men, negative associations were found between perceived available social support and all three measures of distress, whereas partner relationship satisfaction was only found to have a significant negative association with depressive symptoms. A similar pattern of associations is shown for women, although partner relationship satisfaction was also found to have a significant negative association with anxiety symptoms. As the social support measure potentially encompasses support from the partner, further hierarchical regression analysis (Table 5) was completed to check whether it contributes to prediction of distress above and beyond relationship satisfaction. The two variables accounted for 40% and 46% of the variance in depression symptoms for men and women, respectively. They also accounted for 12% of the variance in anxiety symptoms for women. Table 5 shows that for women, perceived available social support plays a significant individual role in predicting anxiety symptoms, over and above that accounted for by partner relationship satisfaction. This was also the case for both men and women in relation to depression symptoms, over and above that predicted by partner relationship satisfaction. Therefore, social support only was selected for further analysis.
Correlations for the variables with results for women bottom left quadrant and men upper right sections of the table are shown (Spearman's are presented for consistency as typically one variable of the pair was non-normally distributed)
| Stigma | Total disclosure | Perceived social support | Partner relationship satisfaction | Global strain (FPI) | Anxiety (HADS) | Depression (HADS) | |
|---|---|---|---|---|---|---|---|
| Stigma | −0.26* | −0.42*** | −0.03 | 0.43*** (0.40***) | 0.44*** | 0.08 | |
| Total disclosure | −0.22 | 0.02 | −0.14 | 0.10 (0.12) | −0.08 | 0.08 | |
| Perceived social support | −0.28** | 0.01 | 0.47*** | −0.53*** (−0.31**) | −0.39** | −0.54*** | |
| Partner relationship satisfaction | −0.23* | −0.10 | 0.40*** | −0.17 (−0.15) | −0.18 | −0.48*** | |
| Global strain (FPI) | 0.67*** (0.64***) | 0.13 (0.10) | −0.25* (−0.23*) | −0.16 | 0.43*** (0.31**) | 0.38** (0.29*) | |
| Anxiety HADS | 0.41*** | 0.21 | −0.24* | −0.28** | 0.48*** (0.45***) | 0.55*** | |
| Depression HADS | 0.40*** | 0.15 | −0.55*** | −0.43*** | 0.55*** (0.52***) | 0.67*** |
Global strain (FPI) excluding social concern is presented in brackets following results for full score.
*P < 0.05, **P < 0.01, ***P < 0.001 (all two-tailed).
The effect of social support on distress while controlling for partner relationship satisfaction using hierarchical regressions
| Dependent variable | Predictor variables | R square change | F Change (df1, df2) | Significance | Overall R square for both predictor variables |
|---|---|---|---|---|---|
| Anxiety symptoms (HADS) in women | Partner relationship satisfaction | 0.07 | 6.58 (1,85) | 0.012 | 0.12 |
| Perceived social support | 0.05 | 4.28 (1,84) | 0.042 | ||
| Depressive symptoms (HADS) in women | Partner relationship satisfaction | 0.16 | 16.51 (1,85) | <0.001 | 0.46 |
| Perceived social support | 0.29 | 45.08 (1,84) | <0.001 | ||
| Depressive symptoms (HADS) in men | Partner relationship satisfaction | 0.17 | 12.35 (1,62) | 0.001 | 0.40 |
| Perceived social support | 0.23 | 22.89 (1,61) | <0.001 |
Testing the model using path analysis
In order to ensure that a specific hypothesis-driven testing was followed using the key variables, the analysis focused only on stigma, total disclosure, social support, global infertility-related distress and total distress (HADS total). The analyses were conducted separately for men and women. Several of the variables were first transformed to produce distributions that conformed more closely to normal prior to analysis. These were: disclosure (which was log-transformed), support (which was reflected and log-transformed, thereby becoming a measure of lack of support) and total HADS (which was square-root transformed). Since the model proposes a single causal chain of one independent and four dependent variables, a sequence of multiple regression analyses was conducted regressing each dependent variable on all prior variables. Following the procedure outlined by Kenny (2004), the regressions were conducted first with all paths present, second with all predicted paths and significant non-predicted paths present and finally retaining only significant paths (all alphas were set at 0.05).
The outcomes of these path analyses for men and women are shown in Figs 2 and 3. The final model was tested in the Mx Structural Equation Modeling package (Neale et al., 2003) to obtain an index to assess the goodness of fit of each of the proposed models to the data. The root mean square error of approximation (RMSEA) index gave the very acceptable low values of 0.00 for the model for men and 0.056 for the model for women. Values less than 0.06 indicate a close fit (Hu and Bentler, 1999).
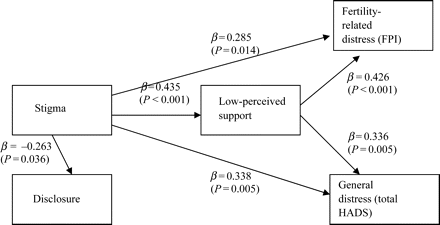
Path analysis for men
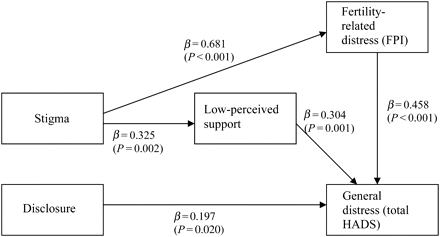
Path analysis for women
Essentially for men, as predicted by the model, stigma is inversely related to disclosure, but this does not form a pathway through to low support and distress. Instead, there is a strong pathway to perceptions of low support and through this to both infertility specific and general distress. There are also additional direct pathways to both measures of distress. Interestingly, the infertility-related distress is not directly linked to more generalized distress for men.
For women, there are many similarities but important differences. Step 1 of the model is not supported in that stigma does not predict disclosure. As for men, there is a significant pathway from stigma to perception of low support and through this to general distress but not to infertility-specific distress. However, there is a strong direct pathway not mediated by support from stigma to infertility-specific distress. Additional paths indicate that for women high infertility distress is associated with high general distress and the greater the disclosure to others the greater the general distress.
Discussion
This study investigated whether stigma affects disclosure which in turn was hypothesized to influence perceived social support availability and consequently distress in new patient attenders at an infertility clinic. To maximize the generic applicability of the study findings, the aim was to be as inclusive as possible. The data therefore were derived from a heterogeneous sample in which specific location of cause was not yet identified.
The analysis of gender differences
Women reported higher levels of fertility-related stigma than men. This could indicate that women are more sensitive to perceptions of stigma in general. However, Pinel (1999) found, in a study of stigma consciousness in the general population, that men were more stigma conscious than women, on stigma related to gender. Another explanation could be that women are more at risk of being stigmatized for fertility difficulties than men. Previous research has suggested that the socialization process promotes different meanings around procreation for men and women, reflecting the virility of the man, whereas motherhood is more central to the female identity (Mahlstedt, 1985).
Despite greater stigma, women also reported greater disclosure. Other studies have suggested that women are more likely to communicate to others about their fertility difficulties than men (Berg and Wilson, 1991; Beutel et al., 1999; Schmidt et al., 2005), although the degree of communication does not, in this study, correspond absolutely to the measure of disclosure that represents the number of people rather than the frequency of discussion. The tendency for women to disclose more than men about stressors in other contexts is well documented (Tamres et al., 2002).
Similar to other studies no gender differences were found between men and women on perceived availability of social support (Tilden et al., 1990). Mean levels of support were at the higher end of the range for community samples indicated by Broadhead et al., (1988). However, the study results suggest that as women disclose more and are more stigma conscious, they may be more vulnerable to negative social experiences related to their infertility than men.
Considering the psychological status, women were found to report significantly higher distress, in terms of infertility-related strain (FPI), anxiety (HADS) and depression (HADS), than men. This has also been found in other infertility populations (Abbey et al., 1991; Berg and Wilson, 1991). Overall, means for global strain on the FPI in the current sample were equivalent to those in other infertility samples for men (119.3 versus 117.0) but substantially higher for women (143.7 versus 134.4) (Newton et al., 1999).
The model
The model predicts that stigma would be associated with reduced disclosure and although this was supported for men, no association was found for women. Findings within the coping literature may help to explain why feelings of stigma were not found to affect disclosure patterns in women. Women have been found to seek others' support as a coping mechanism more frequently than men (Wright et al., 1991; Lee et al., 2000). It may be difficult for women to inhibit a coping response, they typically use even though it may create further difficulties for them. Interestingly, the path analysis suggested for women greater disclosure was associated with high-generalized distress. Restriction of potentially stigmatizing information may allow for improved sense of control and containment of the impact of fertility difficulties. Once a wide variety of others in different contexts such as work, friends are aware, it may be that this allows no respite from the possibility of others raising this issue, thereby limiting predictability in social situations. These results also contrast with the view that ‘holding a secret’ inevitably intensifies the stressful impact of an adverse event. Alternatively, it may be that it is the degree of distress that drives women to discuss with others as a way of attempting to manage this impact. However, consistent with the present findings, McEwan et al., (1987) found that people experiencing fertility difficulties, who shared their difficulties only with a partner rather than seeking social support outside the partnership show less emotional distress.
In the present study, it was not disclosure that was found to affect perceptions of availability of social support as predicted but stigma consciousness. Higher stigma was related to lower perceptions of available social support for both men and women. Individuals are known to seek social support less in situations that threaten self-esteem (Folkman et al., 1986). Therefore, the relationship found between stigma consciousness and social support may be connected through self-esteem, which requires further investigation.
The lack of association between disclosure and social support suggests that perceptions of support from others may not require people to disclose their fertility difficulties. However, the measure of support in the present study did not assess how supported people felt in relation to their fertility difficulties but their perceptions of support in general. The former may have produced different results. The measure of disclosure also assessed the number of people disclosed to rather than frequency of communication with others. Social support may be associated with regular communication with a small number of people rather than telling many people but discussing this only once. The work by Schmidt et al. (2005) addressing the different dimensions of communication about infertility indicates the need for further investigations into both actual and perceived support as well as frequency of communication and number of people disclosed to provide a clearer picture.
The results of the present study suggest that the original proposed model over emphasized the role of disclosure. Stigma consciousness may influence the extent to which people interpret ambiguous responses from others as being stigmatizing and as a consequence lead to less perceived support and more feelings of stigma. We, therefore, propose that future studies should use longitudinal designs to identify whether stigma leads to lower perceptions of support or visa versa.
As predicted, higher perceptions of social support availability were associated with lower distress, in terms of both infertility specific and general distress in both men and women. Perceived social support was found to be predictive of such distress even when the effects of partner relationship had been accounted for. This suggests that degree of support from outside the partner relationship has an important influence on distress levels, in people experiencing fertility difficulties.
The initial model (Fig. 1) did not predict that stigma consciousness would have a direct effect on distress. However, for both men and women, a direct pathway from stigma to infertility-specific distress was found. In addition, for men only, stigma also linked directly to generic distress. Of particular interest is that for women, there was a significant pathway from infertility-related distress to generalized distress, whereas for men these were not directly related. This suggests again that whereas for men fertility related distress may be relatively well contained and does not influence more generic functioning, this is not the case for women.
The value of this study is that, although limited in sample size, it provides an innovative analysis of relationships between stigma, disclosure, support and distress. Clearly, only a proportion of the potential sample participated. Participants appeared to reasonably reflect the potential sample in age and marital status but showed less ethnic diversity. However, there is a possibility that those actually choosing to participate may find disclosure easier, although the minimization of face-to-face contact by the use of questionnaires may have limited this impact. In addition, although individuals were asked to complete the forms without consultation in order to maintain the independence of the data, it was not possible to supervise every individual therefore it is difficult to ascertain if this was adhered to in every case. It could also be considered that stigma and the social concern aspect of the FPI might overlap in their measurement. However, the former relates to generic beliefs and expectations whereas the latter relates more to feelings of individuals in contexts specific to them. Reductions in correlations with stigma and support when social concern was excluded from the FPI were marginal. From a statistical perspective, it must also be noted that although correlations between variables were statistically significant, the magnitude of association was often small. In addition, path analysis is a complex statistical procedure, using multiple variables and a larger sample would have enhanced the power.
However, the study clearly illustrates that the concept of stigma and the relevance of disclosure patterns are potentially important factors in responses to infertility, and it is to be hoped that aspects relating to social context can now receive greater research attention.
Clinical implications
This study suggests that taking into account patients' perceptions of stigma may help to identify those at greater risk of distress. In preparation for infertility treatment, some discussion around the issues of stigma and disclosure may be helpful together with consideration of gender differences. For those requiring counselling, it may be that specific cognitions about stigma are common and could be targeted in therapeutic input. Disclosure was not associated with increased perceptions of support, and for women, more disclosure was predictive of higher generalized distress. In other conditions where individuals perceive themselves as stigmatized, such as social anxiety, cognitive behavioural interventions invite sufferers to confront and test out their fears of negative evaluation from others. In such cases, exposure to the feared situation typically leads to reduction of anxiety. However, for infertility where it is one aspect of life that may be causing distress, it may be that containment is more effective particularly in the early stages. Certainly, this study suggests therapeutic work should not automatically encourage people to seek support through widely disclosing their fertility difficulties. However, disclosing to others in similar situations may reduce the stigma and the level of anxiety which argues further consideration of the value of support groups.
