


Abstract
Is there a relationship between serum progesterone (P) and endometrial volume on the day of embryo transfer (ET) with ongoing pregnancy rate (OPR) in artificial endometrium preparation cycles?
Patients with serum P < 9.2 ng/ml on the day of ET had a significantly lower OPR but endometrial volume was not related with OPR.
A window of optimal serum P levels during the embryo implantation period has been described in artificial endometrium preparation cycles. A very low endometrial volume is related to poor reproductive outcome.
Prospective cohort study with 244 patients who underwent ET in an oocyte donation cycle after an artificial endometrial preparation cycle with estradiol valerate and vaginal micronized progesterone (400 mg/12 h). The study period went from 22 February 2016 to 25 October 2016 (8 months). Sample size was calculated to detect a 20% difference in OPR (35–55%) between two groups according to serum P levels in a two-sided test (80% statistical power, 95% confidence interval (CI)).
Patients undergoing their first/second oocyte donation cycle, aged <50, BMI < 30 kg/m2, triple layer endometrium >6.5 mm and 1–2 good quality transferred blastocysts. A private infertility centre. Serum P determination and 3D ultrasound of uterine cavity were performed on the day of ET. Endometrial volume measurements were taken using a virtual organ computer-aided analysis (VOCAL™) system. The primary endpoint was OPR beyond pregnancy week 12.
About 211 of the 244 recruited patients fulfilled all the inclusion/exclusion criteria. Mean serum P on the day of embryo transfer was 12.7 ± 5.4 ng/ml (Centiles 25, 9.2; 50, 11.8; 75,15.8).
OPRs according to serum P quartiles were: Q1: 32.7%; Q2: 49.1%; Q3: 58.5%; Q4: 50.9%. The OPR of Q1 was significantly lower than Q2–Q4: 32.7% versus 52.8%; P = 0.016; RR (95% CI): 0.62 (0.41–0.94). The mean endometrial volume was 3.4 ± 1.9 ml. Serum P on the day of ET did not correlate with endometrial volume. A logistic regression analysis, adjusted for all the potential confounders, showed that OPR significantly lowered between women with serum P < 9.2 ng/ml versus ≥9.2 ng/ml (OR: 0.297; 95%CI: 0.113–0.779); P = 0.013. The ROC curve showed a significant predictive value of serum P levels on the day of ET for OPR, with an AUC (95%CI) = 0.59 (0.51–0.67).
Only the women with normal uterine cavity, appropriate endometrial thickness and good quality blastocysts transfer were included. Extrapolation to an unselected population or to other routes and/or doses of administering P needs to be validated. The role of endometrial volume could not be fully defined as very few patients presented a very low volume.
The present study suggests a minimum threshold of serum P values on the day of ET that needs to be reached in artificial endometrial preparation cycles to optimize outcome. No upper threshold could be defined.
None.
NCT02696694
Introduction
No endometrial preparation protocol for embryo transfer is consistently superior to the others (Burks & Paulson, 2015; Yarali et al., 2016). Nevertheless, many centres prefer artificial endometrium preparation cycles with hormonal replacement therapy (HRT) because it allows the day of embryo transfer (ET) to be scheduled. It also controls days of exposure to exogenous progesterone (P) very precisely, which is essential for controlling the window of implantation to favour synchrony between the embryo and endometrium (Blesa et al., 2014). This treatment consists in giving estrogens from Day 2 or 3 of the patients’ menstruation. Once endometrium thickness reaches about 7 mm, exogenous P is introduced to prepare the endometrium for embryo implantation (El-Toukhy et al., 2008). However, neither the optimal length of exposure to P before frozen embryo transfer (FET) (van de Vijver et al., 2016) nor what serum P levels are required to optimize cycle outcome have been firmly established.
For this reason, it is interesting to analyse if serum P levels on the day of ET are related with ongoing pregnancy rate (OPR). Evidence on this topic is scarce and is based on retrospective studies with contradictory results (Brady et al., 2014, Kofinas et al., 2015). One recent suggestion is that an optimal window of P levels, in which the highest pregnancy rate is observed, exists in the mid-luteal phase (Yovich et al., 2015).
Both endometrium thickness and volume increase during the menstrual cycle and are greater in the mid-luteal phase (Jokubkiene et al., 2006). The relationship between endometrial volume and pregnancy rates has been studied, but with contradictory results, mainly because measurements are taken at different cycle times (Saravelos and Li, 2016). The studies that have analysed endometrial volume on the day of ET suggest a threshold below which pregnancy rates lower (around 2.5 ml) (Zollner et al., 2003). Moreover, no pregnancies have been described in a uterus of 1 ml or with a smaller endometrial volume (Raga et al., 1999).
Given this background, we used a prospective design to examine if serum P levels are related with endometrial volume on the day of ET, and if both parameters can predict chances in ongoing pregnancy.
Materials and Methods
Design and setting
A prospective cohort study at the Instituto Valenciano de Infertilidad (IVI, a University-affiliated infertility clinic) in Valencia, Spain, between 22 February and 25 October 2016. The www.clinicaltrials.gov registration number is NCT02696694.
IRB approval was obtained before the study started.
Patient population
This study included 244 infertile patients undergoing their first/second oocyte donation cycle. All the patients underwent a single or double ET in the blastocyst stage after an artificial endometrial preparation cycle (see the treatment details in the Study Protocol section). Fresh and frozen embryo transfer cycles were included.
Eligible patients were aged <50 years, BMI < 30 kg/m2, had no systemic diseases, a triple layer endometrium >6.5 mm after HRT and 1–2 good quality blastocysts transferred on Day 5 of embryo development according to the Spanish ASEBIR classification (Pons, 2015).
We excluded those patients with recurrent miscarriages, implantation failure (e.g. unsuccessful transfer of ≥6 embryos), severe male factor, uterine diseases (e.g. fibroids, polyps, previously diagnosed Müllerian abnormalities) or presence of hydrosalpinx.
Endpoints
The primary endpoint was the relationship between serum P levels on the day of ET and OPR beyond pregnancy week 12 in artificial endometrial preparation cycles.
The secondary endpoints were: serum P (ng/ml) and estradiol (E2, pg/ml) on the day of ET; endometrial volume (ml, measured by Virtual Organ Computer-aided analysis–VOCAL-); implantation rate (number of gestational sacs seen in a 2D ultrasound/number of embryos transferred per patient); clinical pregnancy (presence of at least one gestational sac in ultrasound) and miscarriage rate (any clinical pregnancy lost before pregnancy week 12).
Study protocol
Endometrial preparation
All the patients received HRT for endometrial preparation, and all those showing ovarian function were down-regulated with a GnRH agonist (Decapeptyl® 3.75 mg IM, single dose, Ipsen Pharma, Barcelona, Spain). Treatment started on Day 2/3 of menstruation with estradiol valerate either oral administration (Progynova®, Bayer Hispania, Barcelona, Spain)—6 mg/day or transdermal with patches (Evopad®, Janssen Cilag, Madrid, Spain)—150 mcg every 2 days. After 10–14 days on estrogens, a vaginal 2D ultrasound was performed to measure endometrial thickness and to confirm a triple layer pattern.
Patients were considered ready for ET when endometrial thickness was >6.5 mm, ultrasound detected quiescent ovaries, serum E2 was >100 pg/ml and the serum P level was <1 ng/ml. P was administered 5 days before ET with vaginal micronized P (Utrogestan®, SEID, Barcelona, Spain) at a dose of 400 mg/12 h. The last dose before ET (dose 10th) was administered on the morning of the day of ET, approximately 6 h beforehand. In case of pregnancy, HRT was maintained until pregnancy week 12.
Selecting patients
On the day of ET, eligible patients were selected for this study. After checking all the inclusion and exclusion criteria, patients were informed about the nature of the study, read the informed consent (IC) form and decided if they wished to enrol. After signing the IC form, a blood test and a 3D ultrasound of the uterus were performed 1–2 h before ET.
Serum analysis and hormone measurement
Blood was drawn to determine serum P and E2 levels. Serum P and E2 level determinations were not available until the end of the study.
Samples were tested by an electrochemiluminescence immunoassay (Cobas® e 411 analyzer, Roche diagnostics GmbH, Germany). The intra- and inter-assay variation coefficients for the P determinations were 2.4–2.7% and 5.4–5.5%, respectively, for P values between 1.57 and 30.2 ng/ml, and sensitivity was 0.03 ng/ml. The intra- and inter-assay variations coefficients for the E2 determinations were 2.4–8.5% and 2.8–11.9%, with a measurement range of 25.4–2932 pg/ml and sensitivity was 5 pg/ml.
Three-dimension ultrasound
Ultrasounds were performed uniformly by three experienced doctors (E.L; G.M and N.H) with a Voluson® S6 (General Electric Corporation, USA) device after placing patients with an empty bladder in the dorsal lithotomy position. A sweep through the mid-sagittal plane of the uterus was obtained to give a multiplanar display. The Z technique was systematically used to obtain a good quality mid-coronal uterus plane display (Abuhamad et al., 2006).
Endometrial thickness and description of the uterus, according to the ESHRE-ESGE classification (Grimbizis et al., 2016), were recorded, and endometrial volume was saved on the computer.
After the recruitment period, the stored uterine volumes were analysed by two experienced physicians (E.L and P.C) and the VOCAL imaging program took the endometrial volume (ml) measurements with 15° of rotation in the manual measurement mode.
Statistical analysis
Sample size
Sample size was calculated to detect a 20% difference (35–55%) in the OPR between two groups according to serum P levels in a two-sided test (80% statistical power, 95% confidence interval). The interquartile range (IQR) defined both groups: one comprised the patients within Q2–Q3, the other included those with serum P within Q1 or Q4.
With these criteria, 212 patients were included. After considering 15% of dropouts, 244 patients were recruited.
Statistical methods
Serum P on the day of ET was classified into four quartiles according to the 25th, 50th and 75th percentiles. All the categorical variables were compared with a Chi-square test among groups. The Student's t-test was used to compare continuous variables. To analyse the impact on cycle outcome of serum P on the day of ET defined by the four quartiles, a multinomial logistic regression analysis was performed with all the potential confounding variables.
The first quartile was taken as the reference category. Age, BMI, endometrial thickness, endometrial volume, serum E2 and number of transferred embryos were included in the analysis, regardless of their P value. A multinomial logistic regression analysis was performed to identify those variables related to the probability of having low serum P on the day of ET.
To define the predictive capability of serum P on the OPR, the receiving operating characteristic (ROC) curve was defined and the area under the curve (AUC) was calculated. The optimal threshold according to sensitivity and specificity to predict OPR was defined.
Results
Of the 244 recruited patients, 211 fulfilled all the inclusion and exclusion criteria; 33 patients were excluded due to: previously undiagnosed Müllerian abnormality in 27 patients observed by 3D ultrasound (19 T-shaped, 6 septate partial, 1 hemiuterus and 1 bicorporeal uterus); 4 cases had a submucous fibroid that slightly distorted the cavity, diagnosed by 3D ultrasound; 2 cases with a protocol deviation because P administration commenced 12 h after previously established (Fig. 1).
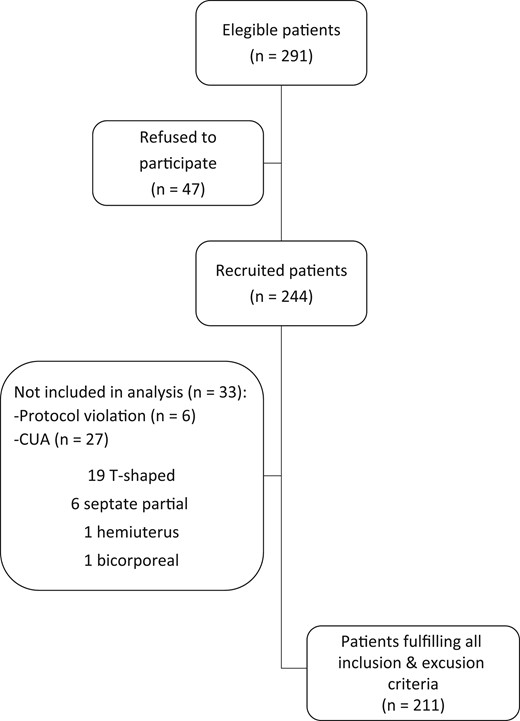
Flow chart of the study population subjected to oocyte donation treatments. Serum progesterone determination and 3D ultrasound were performed the day of embryo transfer. CUA, congenital uterine anomalies.
Patient´s mean age was 41.3 ± 4.4 years. They had a BMI of 22.3 ± 2.6 kg/m2 and endometrial thickness of 8.9 ± 1.7 mm before starting P.
Serum P on the day of ET was 12.7 ± 5.4 ng/ml. Table I shows the 5th, 10th, 25th, 50th, 75th, 90th and 95th percentile values. Serum P levels did not correlate with BMI (R2: 0.008). Serum E2 on the day of ET was 245 ± 183 pg/ml.
Descriptive analysis of the serum values of Progesterone (ng/ml) and endometrial volume (ml) on the day of embryo transfer.
| Percentiles | 5th | 10th | 25th | 50th | 75th | 90th | 95th |
|---|---|---|---|---|---|---|---|
| Progesterone (ng/ml) | 5.5 | 6.6 | 9.2 | 11.8 | 15.8 | 19.2 | 21.9 |
| Endometrial volume (ml) | 1.4 | 1.6 | 2.0 | 3.1 | 4.3 | 5.7 | 6.5 |
| Percentiles | 5th | 10th | 25th | 50th | 75th | 90th | 95th |
|---|---|---|---|---|---|---|---|
| Progesterone (ng/ml) | 5.5 | 6.6 | 9.2 | 11.8 | 15.8 | 19.2 | 21.9 |
| Endometrial volume (ml) | 1.4 | 1.6 | 2.0 | 3.1 | 4.3 | 5.7 | 6.5 |
The serum P intervals for each quartile were: Q1: <9.2 ng/ml; Q2: 9.2–11.7 ng/ml; Q3: 11.8–15.7 ng/ml; Q4: ≥15.8 ng/ml. OPR were: Q1: 32.7%; Q2: 49.1%; Q3: 58.5%; Q4: 50.9%. Miscarriages rates were 34.6%, 25.7%, 16.2% and 18.2% for Q1–Q4, respectively (Table II). Our data did not support the idea of an optimum window because the OPR was not statistically significantly different between women with serum P within the IQR (53.8%), and for patients in the first and fourth quartiles (41.9%; P = 0.327; RR (95% CI) 1.18 (0.85–1.63)).
Clinical outcome according to serum Progesterone values (ng/ml) the day of embryo transfer.
| Quartile (progesterone ng/ml) | |||||
|---|---|---|---|---|---|
| Q1 (<9.2) (n = 52) | Q2 (9.2–11.7) (n = 53) | Q3 (11.8–15.7) (n = 53) | Q4 (≥15.8) (n = 53) | P* | |
| No. of fresh/frozen cycles: n (%) | |||||
| Fresh | 20 (38) | 22 (42) | 22 (42) | 20 (38) | 0.508 |
| Frozen | 32 (62) | 31 (59) | 31 (59) | 33 (62) | |
| No. embryos transferred (mean ± SD) | 1.4 ± 0.5 | 1.3 ± 0.4 | 1.5 ± 0.5 | 1.4 ± 0.5 | 0.456 |
| No of single/double embryo transfers n (%) | |||||
| SET | 29 (56) | 39 (74) | 29 (55) | 30 (57) | 0.277 |
| DET | 23 (44) | 14 (26) | 24 (45) | 23 (43) | |
| Implantation rate% (95% CI) | 45 (32.5–57.9) | 58 (44.8–70.3) | 61 (49.1–73.2) | 55 (41.8–67.8) | 0.083 |
| Clinical pregnancy: n/Na; % (95% CI) | 26/52; 50 (35.9–64.1) | 35/53; 66 (52.9–79.2) | 37/53; 70 (57.0–82.6) | 33/53; 62 (48.8–75.7) | 0.048 |
| Miscarriage: n/Na; % (95% CI) | 9/26; 35 (15.0–54.2) | 9/35; 26 (10.5–40.9) | 6/37; 16 (3.8–28.7) | 6/33; 18 (4.3–32.1) | 0.124 |
| Ongoing pregnancy: n/Na; % (95% CI) | 17/52; 33 (19.5–45.9) | 26/53; 49 (35.1–63.0) | 31/53; 59 (44.8–72.2) | 27/53; 51 (37.0–64.9) | 0.016 |
*P values compare first quartile (Q1) versus Q2–Q4.
an = number of events; N = Number at risk.
The patients with serum P on the day of ET <9.2 ng/ml (Q1) had a significantly lower OPR than the other patients (Q2–Q4): 32.7% versus 52.8%; P = 0.016; RR (95% CI): 0.62 (0.41–0.94).
The ROC curve showed a significant predictive value of serum P levels on the day of ET for OPR, with an AUC (95%CI) = 0.59 (0.51–0.67) (Fig. 2).
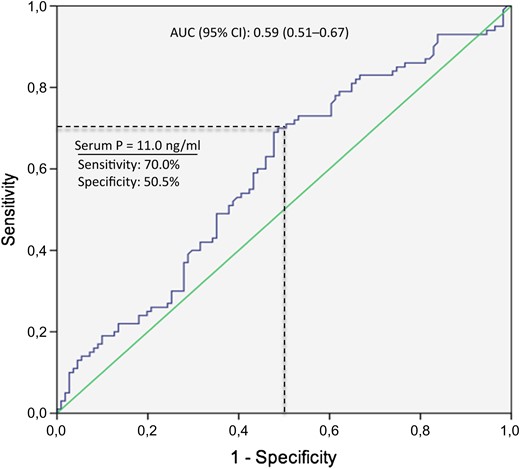
Receiving operating characteristic (ROC) curve for prediction of ongoing pregnancy rate by serum progesterone (P) levels on the day of embryo transfer. AUC, area under the curve.
The optimal serum P threshold in which sensitivity and specificity for OPR were both >50% was 11.0 ng/ml (70.0% sensitivity, 50.5% specificity). The OPR around this threshold was 35.3% versus 55.6% for serum P < 11.0 or ≥11.0 ng/ml, respectively (RR: 0.64, 95%CI: 0.46–0.88; P = 0.005). Miscarriage rates were 31.9% versus 21.2%, respectively (RR: 1.48, 95%CI: 0.85–2.58; P = 0.168).
Endometrial volume was 3.4 ± 1.9 ml and endometrial thickness was 8.9 ± 2.2 mm on the day of ET. Pearson's correlation showed that serum P correlated slightly with endometrial thickness on the day of ET (R2: 0.029; P = 0.02), but not with endometrial volume (R2:0.011; P = 0.17), whereas all the parameters related with uterine measurements (endometrial volume and thickness) and related positively with each one (data not shown).
No significant association was observed between endometrial volume and clinical outcome (Table III). Only the women with a very low endometrial volume (<p5 = 1.4 ml) (n = 10) were associated with a clinically lower OPR (22.2% versus 48.3%) (P > 0.05).
Clinical results according to endometrial volume (ml) the day of embryo transfer.
| Quartile (endometrial volume ml) | |||||
|---|---|---|---|---|---|
| Q1 (<2.0) (n = 47) | Q2 (2.0–3.1) (n = 47) | Q3 (3.2–4.2) (n = 47) | Q4 (≥4.3) (n = 48) | P* | |
| No. of fresh/frozen cycles: n (%) | |||||
| Fresh | 27 (57) | 22 (47) | 28 (60) | 24 (50) | 0.734 |
| Frozen | 20 (43) | 25 (53) | 29 (40) | 24 (50) | |
| No. embryos transferred (mean ± SD) | 1.4 ± 0.5 | 1.5 ± 0.5 | 1.3 ± 0.5 | 1.4 ± 0.5 | 0.526 |
| No.of single/double embryo transfers: n (%) | |||||
| SET | 27 (57) | 26 (55) | 34 (72) | 29 (60) | 0.605 |
| DET | 20 (43) | 21 (45) | 13 (28) | 19 (40) | |
| Implantation rate % (95% CI) | 48 (34.9–60.8) | 53 (39.7–66.7) | 60 (45.7–73.5) | 55 (41.7–68.7) | 0.294 |
| Clinical pregnancy: n/Na; % (95% CI) | 27/47; 57 (42.8–72.1) | 29/47; 62 (47.3–76.1) | 29/47; 62 (47.3–76.1) | 31/48; 65 (50.5–78.6) | 0.605 |
| Miscarriage: n/Na; % (95% CI) | 7/27; 26 (8.3–43.6) | 4/29; 14 (0.4–27.1) | 9/29; 31 (13.1–48.9) | 7/31; 23 (7.0–38.2) | 0.796 |
| Ongoing pregnancy: n/Na; % (95% CI) | 20/47; 43 (27.9–57.2) | 25/47; 53 (38.4–68.0) | 19/47; 40 (25.9–55.0) | 24/48; 50 (35.3–64.7) | 0.613 |
*P values compare the first quartile (Q1; <2.0 ml) versus the rest; Q2–Q4.
an = number of events; N = number at risk.
The multinomial logistic regression showed that OPR significantly lowered between the women with serum P < 9.2 ng/ml and the rest of patients (OR: 0.297; 95%CI: 0.113–0.779; P = 0.013) after adjusting for age, BMI, endometrial thickness, serum E2, number of transferred embryos and endometrial volume (Supplementary Table SI). The multinomial logistic analysis, done to predict serum P < 9.2 ng/ml on the day of ET, including all meaningful clinical parameters (age, BMI, days of HRT for endometrial preparation, serum E2 and endometrial thickness), showed that none of these parameters were significantly related (Supplementary Table SII).
No significant relationship between the likelihood of ongoing pregnancy and endometrial volume on the day of ET was observed (OR:0.94:95%CI: 0.77–1.16; P = 0.56).
Discussion
The results of the present study showed that patients with serum P < 9.2 ng/ml on the day of ET after an artificial endometrial preparation cycle with vaginal micronized P had a significantly reduced OPR. This was observed in the oocyte donation cycles context, and ruled out any impact of embryo quality on this finding. Moreover, all the patients received the same dose of P and for the same time before ET. Having adjusted for all the potential confounders, including the number of transferred embryos, the relationship between low serum P on the day of ET and the likelihood of ongoing pregnancy was still present. However, the capability of predicting the OPR of serum P levels on the day of ET was limited. The ROC curve value, albeit statistically significant, did not allow for accurate prediction, and the optimal threshold showed modest sensitivity and specificity values.
We observed no association for endometrial volume with either serum P levels or OPR, which suggests that, once minimal endometrial thickness is reached, serum P levels on the day of ET are more predictable for pregnancy than ultrasound endometrium evaluations.
The findings of this study suggest that a minimal threshold of serum P on the day of ET needs to be reached. Data about an optimal range on the day of ET are scarce. In FET cycles, very few retrospective studies have analysed this issue, and obtained contradicting results when using IMP (Brady et al., 2014; Kofinas et al., 2015). When using intravaginal P however, Yovich et al. (2015) found an optimal serum P concentration interval, while values outside this interval significantly related to lower pregnancy rates. Nevertheless, the upper limit did not reach statistical difference for the live birth rate, as we observed for OPR. The mean P levels observed by Yovich (19.2 ng/ml) were higher than ours (12.7 ng/ml), perhaps because these authors used a higher daily dose than we did (1200 versus 800 mg), or because levels were determined 2–3 days after ET. However, it seems that increasing doses do not proportionally increase systemic concentrations when intravaginal P is used (Paulson et al., 2014).
In any case, the results of Yovich and ours show that serum P levels can be related with chances of pregnancy in artificial cycles.
Evidence from fertile women suggests that only a very small amount of P is necessary to enable the endometrium to be receptive to the implanting embryo (Young, 2013). A classical study demonstrated an optimal range for fertility in natural cycles, with a lower threshold of 9.4 ng/ml (Hull et al., 1982). However, the value of a single P estimation in the assessment of luteal phase function in natural cycles has always been questioned given its rapid fluctuating levels in the mid-late luteal phase of normal subjects (Filicori et al., 1984).
On the contrary in artificial cycles, P rapidly reaches the systemic circulation, and the steady state is achieved within 24 h (Nahoul et al., 1993; Paulson et al., 2014), so its measurement seems more reliable. Current data suggest that P levels of >5 ng/ml that act on an adequately primed endometrium result in endometrial luteinization and receptivity, which does not differ from that achieved by much higher levels (Usadi et al., 2008; de Ziegler et al., 2013). Yet the remaining question is whether this is functionally enough to favour implantation and to maintain pregnancy in artificial cycles, in which optimal luteal phase support (LPS) with exogenous P is vital, especially when GnRH analogues for down-regulation are used.
Diminishing endometrial receptivity could be due to either an insufficient P exposure time or an insufficient serum P level, or due to both. The first problem can be overcome by adjusting the days of P exposure (Ruiz-Alonso et al., 2013). The second one, which was detected in the present study, seems biologically plausible as the P concentrations widely varied despite all women receiving the same LPS, but the uptake, absorption and metabolism of each hormone can vary among women (Yovich et al., 2015). This problem might be overcome by increasing the P dose from the very beginning, but has yet to be demonstrated, as when giving intravaginal P, when neither serum P nor endometrial tissue concentrations seem dose proportional (Paulson et al., 2014). More studies are necessary to address this issue and to discover how to overcome this, perhaps by personalizing the route and dose of P in each particular patient to search for optimal serum P levels.
One of our study limitations is that only the women with a normal uterine cavity, appropriate endometrial thickness and good quality blastocysts were included. Another limitation was a low predictive value of serum P on OPR. Thus, extrapolation to an unselected population or to patients who receive P by other routes needs to be further validated.
To conclude, this is the first prospective study to find a correlation between serum P levels on the day of ET and OPR. The oocyte donation context avoids different biases that could affect the results. Our results suggest a minimum serum P threshold to optimize OPR in artificial cycles when using intravaginal progesterone. This finding, if confirmed with a large sample of patients, should be considered when deciding if ET should be postponed or not according to serum P levels.
Supplementary data
Supplementary data are available at Human Reproduction online.
Acknowledgements
The authors thank the women who voluntarily participated and the IVI staff in Valencia, Spain.
Authors’ roles
E.L., G.M. and N.H. contributed equally to recruit patients and capture endometrial volumes. E.L. and P.C. performed the VOCAL analysis and took uterine measurements. E.L. and E.B. were involved in the study design, undertook the literature review. E.B. performed the analysis and interpreted the data. E.L. drafted the manuscript, reviewed by E.B and J.R. All the authors approved the final manuscript for submission.
Funding
None.
Conflict of interest
None declared.
