


Abstract
To date, research into the biological processes and molecular mechanisms associated with endometrial receptivity and embryo implantation has been a focus of attention, whereas the complex events that occur in the human endometrium during the menstrual and proliferative phase under the influence of estrogen have received little attention. The objective of this review is to provide an update of our current understanding of the actions of estrogen on both human and rodent endometrium, with special emphasis on the regulation of uterine growth and cell proliferation, and the value of global gene expression analysis, in increasing understanding of these processes.
Introduction
The human endometrium is an amazingly plastic tissue. Throughout the adult reproductive life, monthly steroid hormone controlled cycles of proliferation, differentiation and degeneration occur continuously. Even after menopause, the tissue retains its responsiveness to steroid hormones and endometrial cycles can also be induced. In each menstrual cycle, if no embryo implantation occurs, the functional layer of the endometrium is shed and within 2 weeks the complete functional layer is restored. The events underlying this phenomenon are highly complex and include repair of the endometrium surface, proliferation, angiogenesis, vasculogenesis, cell differentiation and extracellular matrix remodelling. Once the functional layer has successfully been rebuilt, the actions of progesterone change the estrogen primed endometrium into a receptive state ( Martin et al. , 2002 ; Navot et al. , 1989 ; Riesewijk et al. , 2003 ).
During the menstrual cycle, two phases of elevated estrogen concentrations can be distinguished. During the proliferative phase, the growing follicles produce increasing amounts of estradiol (E 2 ) that peak at ovulation. After ovulation the corpus luteum continues to produce significant amounts of estrogens, in addition to progesterone. However, it has been shown that this mid-luteal rise in estrogen is not essential for successful implantation in the human ( Ghosh et al. , 1994 ; Smitz et al. , 1993 ).
Prior to ovulation, the role of estrogen is considered to be important in the regeneration and growth of the endometrium and to prepare the tissue to respond to progesterone post-ovulation. Until the advent of microarray technology, the study of complex biological mechanisms was hindered by the fact that only the expression of individual genes could be investigated. Genome wide gene expression analysis has proven to be a powerful approach to revealing individual genes and signalling cascades that are directly or indirectly affected by the steroid hormones.
Estrogen regulation of uterine and endometrial growth
Estrogen regulation of uterine growth in rodents
The uterus in rodents and the human undergoes cyclical changes of growth and degeneration. In both species, estrogens produced from the developing follicles stimulate endometrial growth, and progesterone is responsible for converting the estrogen-primed endometrium into a receptive state. In rodents, if pregnancy does not occur, diestrous (secretory phase in humans, cycle days 15–28) terminates with regression of the corpus luteum, and the endometrium is resorbed (menstruation in humans, cycle days 1–5). During proestrous (proliferative phase in humans, cycle days 6–14) follicles develop and start to produce estrogens that stimulate endometrial growth. During estrous (peri-ovulatory period in humans, cycle days 13–15) ovarian follicles mature.
Rodents are versatile animal models that allow precise hormonal manipulation of the endometrium, usually after ovariectomy. In the classical sense, the uterine growth responses in rodents are grouped as early and late responses in relationship to a single dose of E 2 (reviewed by Barton et al. , 1998 ). The early responses that usually occur during the first 6 h after administration of estrogen include increases in RNA and protein synthesis as well as water imbibition. Late estrogen responses include cycles of DNA synthesis and epithelial cell mitosis, which begin 10–16 h after E 2 administration. Two waves of mitotic activity are generally seen. One wave after ∼16 h and one after ∼24 h.
The magnitude of uterine growth stimulation is largely dependent upon the duration of bioavailable E 2 and receptor interaction ( Agarwal et al. , 1982 ). Oestriol, which is a short-acting estrogen agonist, stimulates the early events following a single aqueous dose, but does not stimulate cell proliferation. The inability of oestriol to stimulate cell proliferation could be due to a rapid clearance of this steroid and low affinity to estrogen receptors. Similarly, administration of single doses of both E 2 and oestriol immediately activate early genes such as MYC and FOS, but additional estrogen is required for a cell to complete G1 and enter the S-phase ( Hyder et al. , 1994 ; Loose-Mitchell et al. , 1988 ).
Administration of a low dose of E 2 (0.25 or 2.5 µg/animal) to immature rats caused nuclear translocation after 1–3 h and maintenance of uterine growth occurred after 24 h. At a higher dose (10.0 µg/rat), circulatory E 2 levels were maintained longer and a biphasic nuclear translocation occurred. The uterus continued to grow until 72 h, reaching five times its original wet weight. Administration of one dose of oestriol, a short-acting estrogen, induces the same early responses as E 2 , however, no uterine proliferative response is induced ( Cheng et al. , 1985 ). These studies show that a single injection of sufficient amounts of E 2 induces endometrial growth and maturation in rats, provided estrogen levels remain elevated in the circulation for a long period of time. This is supported by reports which show that the administration of increasing doses of E 2 is required to sustain a full uterine response. Treating immature rats with a single bolus of a long-acting estrogen (17α-ethinyl oestriol-3-cyclopentyl ether, EE3CPE) did not result in further increases in uterine weight beyond 24–48 h. In contrast, multiple injections of EE3CPE for 72 h produced a progressive increase in tissue and uterine weight markedly above the 24 h level, and responsiveness to E 2 is maintained ( Katzenellenbogen et al. , 1977 ). Medlock et al. (1991) observed that rats receiving silastic implants with a pharmacological dose of E 2 (5.0 mg/ml) did maintain the maximal uterine weight gain through 24 h, whereas subcutaneous injections of a single dose (1.0 and 10.0 µg) caused only a significant and equivalent increase in uterine weight at 6 h, but the weight gain could not be maintained for long. Treating adult mice and immature female rats for several consecutive days with the same dose, also renders the uterine epithelial cells ‘refractory’ ( Newbold et al. , 2001 ; Stormshak et al. , 1976 ), and only when challenged with a higher dose this ‘refractory’ state could be overcome ( Stormshak et al. , 1976 ).
The minimal dose of E 2 that is required to induce uterine sensitivity for implantation was determined to be in the range of 1.5–3 ng ( Ma et al. , 2003 ; Milligan et al. , 1995 ). Ma et al. (2003) showed that the concentration of E 2 also controls the length of the window of uterine receptivity. At different physiological concentrations implantation can be initiated, however, high doses shorten this period. This is associated with aberrant expression of implantation-related genes including LIF , PTGS1 (cyclooxygenase 1) and AREG (amphiregulin). Finn et al. (1995) showed that administration of high doses of E 2 stimulated cell division, but no decidualization occurred.
Collectively, these findings suggest that uterine levels of E 2 must exceed a certain level to initiate the early events associated with the induction of uterine growth. However, sustained bioavailability of estrogens as well as the receptors is required to induce a full uterine proliferative response, and excessive levels of estrogen may have adverse effects on implantation.
Estrogen regulation of endometrial growth in the human
The role of estrogen in the regulation of human endometrium is still elusive. In contrast to the rodent uterus, endometrial growth in humans is not a result of water imbibition, but mostly a result of cellular amplification. Repair of the endometrial surface is already initiated during the menstruation process in the remaining basal layer, prior to any increase in estrogen concentrations ( Ferenczy, 1976 ). This process was also shown to involve recruitment of bone marrow derived cells ( Taylor, 2004 ). Proliferative activity in the basal layer remains constantly low, and once estrogen concentrations increase, proliferative activity in the developing functional layer of the human endometrium is induced. Proliferative activity peaks between cycle days 8 and 10 ( Ferenczy et al. , 1979 ).
In humans, a minimum of 5 days of estrogen exposure is required to build a sufficiently thick endometrium to allow implantation of the embryo ( Michalas et al. , 1996 ; Navot and Bergh, 1991 ). In this regard, it worth mentioning the recent study from Kurita et al. (2005) who made tissue recombinants from uterine stroma of newborn mice and epithelial cells either from newborn murine uteri or from adult human endometrium. These were placed under kidney capsules of female nude mice, which were ovariectomized 4 weeks later. After two additional weeks the animals were treated with E 2 . Similar to what is observed in vivo in the mouse and human, the proliferative response in the mouse epithelium was visible after 1 day, whereas the human epithelium required 5 days of E 2 exposure to show a maximum response. In addition, the human uterine epithelial cells responded to E 2 by up-regulation of progesterone receptor (PR), whereas in the mouse epithelium PR expression was down-regulated.
Previous studies from the same group have shown that the proliferative response in endometrial epithelium is regulated by the stromal compartment. The fact that uterine stroma from a mouse shows the same response as adult endometrial stroma from the human, indicates that these stroma-mediated effects are not species specific. The distinct responses in the mouse and human uterine epithelial cells suggest that the epithelial cells respond differently to the cues from the stromal compartment. This means that it is likely that the early responses of the stromal compartments of mouse and human endometrium show similarities, maybe allowing careful extrapolation of findings in mouse studies to the human, whereas the late responses in the epithelial compartments show more disparities.
Studying the effect of estrogens on human endometrium is complicated. Most information about the role of estrogen in the regulation of endometrial development have been obtained in IVF patients in either natural or artificially induced cycles. During IVF, high estrogen concentrations as a result of the hyperstimulation of the ovaries are thought to result in a disparity in maturation between the epithelium and the stroma which is more advanced in its development ( Noci et al. , 1997 ), possibly as a result of premature steroid receptor down-regulation ( Develioglu et al. , 1999 ; Noci et al. , 1997 ). When E 2 concentrations were >2500 pg/ml on the day of human chorionic gonadotrophin injection, significant decreases in pregnancy and implantation rates were observed compared with patients having low E 2 concentrations, whereas embryo quality was unaffected ( Pellicer et al. , 1996 ; Simon et al. , 1995 ). Reducing the E 2 levels using a step-down protocol significantly improved implantation and pregnancy rates compared to the patients that received the standard protocol, without affecting the fertilization rate and the number of good-quality embryos ( Simon et al. , 1998 ). In addition, optimal pregnancy rates were achieved when estrogen was administered for 6–11 days ( Michalas et al. , 1996 ; Navot and Bergh, 1991 ) or 12–19 days ( Younis et al. , 1992 ) before progesterone administration.
Others, however, have not find abnormal endometrial morphology or reduced implantation and pregnancy rates at high hormone levels ( de Ziegler et al. , 1991 ; de Ziegler and Bouchard, 1993 ; Sauer et al. , 1990 ; Serhal and Craft, 1987 ; Sharara and McClamrock, 2000 ). Increased implantation and pregnancy rates per embryo transfer were found in cycles with high E 2 levels (>5000 pg/ml) compared with controls ( Gelety and Buyalos, 1995 ). The length of estrogen exposure was also shown to be flexible, ranging from as short as 6 days to as long as 60 days without affecting receptivity or pregnancy rates ( Borini et al. , 2001 ; Navot et al. , 1984 ; Serhal and Craft, 1987 ; Yaron et al. , 1995 ). In line with these findings, Remohi et al. (1997) observed that implantation and pregnancy rates were also normal at very low concentrations (<50 pg/ml).
Obviously our knowledge about the regulation of endometrial growth and differentiation by estrogen shows dramatic lacunas. Studying estrogen regulation from a genomics perspective may provide new insights into the cellular regulatory mechanisms involved.
Global gene expression profiling
Gene expression studies in rodent uterus
The outcome and interpretation of global gene expression profiling studies is influenced by the use of different array platforms, the use of different protocols for sample and probe preparation, differences between mouse strains, the manner of application of the steroids and differences in data processing and analysis. (Table 1 presents a summary of gene expression studies aimed at evaluating the effects of estrogen). For human endometrium, this was first demonstrated by Horcajadas et al. (2004) . The authors compared the results of four studies on gene expression in human endometrium collected during the implantation window and reported only three genes that were up-regulated in all four studies (osteopontin, apolipoprotein D, Dickkopf) and one down-regulated gene (olfactomedin-1) ( Horcajadas et al. , 2004 ).
Summary of gene profiling studies in rodents and humans to study estrogen regulation of gene expression in uterus and endometrium
| A. Changes in menstrual and oestrous cycles |
| Human endometrium |
| Menstrual ( CD3-4 ) versus LP ( CD12-13 ) phase endometrium ( Punyadeera et al. , 2005 ) |
| Proliferative phase endometrium, LCM of epithelium and stroma ( Yanaihara et al. , 2005 ) |
| Menstrual and proliferative phase endometrium chemokine array (Jones et al. , 2004) |
| Various stages of the proliferative and secretory phase ( Ponnampalam et al. , 2004 ) |
| Mouse endometrium |
| Oestrous versus diestrous (Tan et al. , 2003) |
| Wild-type (Wt) ovariectomized (ovex) mice, estradiol (E 2 ) 100 µg/animal for 6 and 24 h, followed by LCM epithelial glands and stroma ( Hong et al. , 2004 ) |
| B. Ovariectomized rodent models |
| Wt mice sacrificed 2, 8, 12, 24 h after one dose of EE (100 µg/kg), or 72 h (dosed 3×, every 24 h) ( Fertuck et al. , 2003 ) |
| Wt mice sacrificed 0, 1, 2, 6, 12, 24, 48 h after one injection of E 2 (5 µg/kg). Extra control, αERKO mice treated with E 2 for 6 h ( Watanabe et al. , 2003 ) |
| Wt and αERKO mice sacrificed 6 h after treatment with E 2 , dose range 0.5–50 µg/kg (Watanabe et al. , 2002) |
| Wt, αERKO, βERKO mice sacrificed 0.5 and 2 h after 1 µg/kg E 2 i.p. in saline, or 6, 12, 24 h after 1 µg/kg E 2 sc in oil; additional groups received 45 µg/kg ICI in DMSO i.p., 30 min prior to E 2 ( Hewitt et al. , 2003 ) |
| Wt and αERKO mice sacrificed 2 and 24 h after administration of 1 µg/kg E 2 , or sacrificed 2 h after i.p. injection with 200 µg EGF or IGF-1 analogue 2 h after i.p. injection, or 24 h after administration by osmotic pumps ( Hewitt et al. , 2005 ) |
| Rats sacrificed after 3 days after receiving 1 µg/animal/day E 2 (Rochett et al. , 2002) |
| Rats sacrificed after 1, 4, and 7 days after receiving 2.5 mg/animal/day E 2 ( Wu et al. , 2003 ) |
| C. Immature rodent models |
| Wt mice, 20–21 days old, sacrificed 1, 2, 4, 8, 24, 72 h after administration of a high dose E 2 400 µg/kg ( Moggs et al. , 2004 ) |
| Wt mice treated with 50 µg/kg E 2 for 3 consecutive days (Waters et al. , 2001) |
| Wt rats treated sc with 0.001–10 µg/kg EE for 4 consecutive days ( Naciff et al. , 2003 ) |
| D. In vitro models |
| Primary cultures epithelium and stroma treated with E 2 , tamoxifen and raloxifene ( Pole et al. , 2005 ) |
Similar disagreements among array studies are also present among rodent studies. For instance, both Hong et al. (2004) and Watanabe et al. (2003 , 2004 ) treated ovariectomized mice for 6 h with E 2 and of the reported genes that were most affected, only seven were commonly regulated (Table 2 ). When including the findings of the study from Hewitt et al. (2003) , only MAD2 and Small proline-rich protein 2A were up-regulated by E 2 in wild-type mice in all three studies.
Genes regulated by E 2 in endometrium of ovariectomized mice after 6 h ( Hong et al. , 2004 ; Watanabe et al. , 2003 , 2004 )
| Thioether- S -methyltransferase |
| Serum-inducible kinase |
| Mitotic checkpoint component MAD2 |
| Small proline-rich protein 2A |
| Chemokine orphan receptor 1 |
| GTPase (Ran) |
| Kruppel-like factor 4 (gut) |
| Thioether- S -methyltransferase |
| Serum-inducible kinase |
| Mitotic checkpoint component MAD2 |
| Small proline-rich protein 2A |
| Chemokine orphan receptor 1 |
| GTPase (Ran) |
| Kruppel-like factor 4 (gut) |
The choice of animal model system will also have an impact on the outcome. For studying the effects of steroid hormones on steroid-responsive tissues, ovariectomized animals receiving hormone replacement is an established animal model. Alternatively, researchers have employed immature animals. Immature animals were shown to be more sensitive with regard to the detection of estrogenic effects than the ovariectomized adult animals ( Kang et al. , 2000 ). In the study of Naciff et al. (2003) prepubertal rats received increasing doses of ethynyl E 2 (EE, 0.001–10 µg/kg) and the changes in gene expression were monitored using the Affymetrix Rat Genome U34A high-density oligonucleotide array. In this study, 24-h exposure to a high dose (10 µg/kg) of EE induced a 5-fold increase in uterine wet weight and a 2-fold increase in uterine height. In contrast, treating adult ovariectomized rats with 500 µg/kg of EE did not even increase uterine wet weight ( Wu et al. , 2003 ). Moreover, the magnitude of gene expression induced by E 2 was higher in the immature rats than in the adult ovariectomized rats, i.e. complement component 3 and CD24 were induced 300- and 7.5-fold in the study of Naciff et al. versus only 3.6- and 2.8-fold in the study of Wu et al. (2003) . Whether the immature rat model or the ovariectomized/E 2 supplemented adult rat model is the most reliable model for studying the role of E 2 in the endometrium and for extrapolating findings to the human situation has yet to be decided.
The major advantage of animal models is their flexibility. Using recombinant DNA technologies, the animals can be genetically altered, and it is possible to perform longitudinal studies. For example, the mouse models were proven to be very illustrative in demonstrating the roles of the two ER isoforms, ERα and ERβ, in endometrial regulation. The availability of mouse strains in which the ERα (αERKO mice) or ERβ (βERKO mice) has been ablated, paved the way to study the selective actions of ERα and ERβ ( Hewitt et al. , 2003 ). The early and late responses of the βERKO mice were indistinguishable from those of wild-type samples, whereas the αERKO mice showed little response to E 2 ( Hewitt et al. , 2003 ). These observations indicate that ERα is essential for mediating the actions of E 2 .
Using the same mouse models, Hewitt et al. (2005) also showed that IGF-1 and ER signalling pathways act in parallel with regard to the regulation of gene expression, and that treating αERKO mice with IGF-1 elicited certain responses that closely resembled the response induced by E 2 in wild-type mice. Certain genes were regulated similarly (up: IGFBP5 , CYR61 , p21 , c-fos ; down: Txnip , IGFBP3 , SOX4 ) by E 2 and growth factors in wild-type mice, and retained growth factor responsiveness in the αERKO mice. However, another group of genes was only regulated by E 2 and only in the wild-type mice ( MAD2 , RAMP3 , LF , IGF-1 , KRT1-19 ), and they therefore depend on the presence of ERα. A third group of genes was regulated only by the growth factors (Baiap2, Kruppel-like factor 9). This confirms earlier findings that growth factors and ER signalling pathways converge in the regulation of some uterine functions that still depend on a correct ER pathway. EGF and IGF-1 treatment of ovariectomized mice resulted in increased uterine weight and proliferation of uterine epithelial cells ( Klotz et al. , 2002 ; Nelson et al. , 1991 ), but these responses were not observed in the αERKO mice ( Klotz et al. , 2000 , 2002 ).
Phenotypic anchoring
To understand complex mechanisms, relationships must be defined between the changes in gene expression and the alterations that occur in the cells or tissues ( Moggs et al. , 2004 ). In toxicogenomics this is termed ‘phenotypic anchoring’ ( Paules, 2003 ). Moggs et al. (2004) applied this approach to define the transcriptional program associated with the response of the rodent uterus to E 2 and to identify groups of genes that result in specific histological changes. A single high dose of E 2 (400 µg/ml) was administered to immature mice, which induced a sustained increase in uterine weight. In addition, uterine expression profiles were assessed after 1, 2, 4, 8, 24, 48 and 72 h. The 3538 E 2 -responsive genes were subjected to hierarchical clustering to identify the temporarily co-regulated genes and the clustered genes were further interrogated using the GOStat gene ontology mining tool to gain an overview of the predominant molecular functions and biological pathways that were regulated at the transcriptional level. The temporal associations in gene expression were anchored to distinct alterations in uterine phenotype. The authors found that E 2 regulates different classes of genes during narrow time windows, and suggested that E 2 induces uterine growth and maturation by successively regulating the activities of different biological pathways. In the first 4 h after injection of E 2 , a major influx of fluid into the uterus is seen, most likely due to an increase in vascular permeability due to increased expression of VEGF. Many genes that have roles in the regulation of vascular permeability were up-regulated (e.g. angiogenic/vascular cell growth factors VEGF , PlGF , ADM , ANG2 , TGFβ 2, the vasoactive serine protease KLK 2, - 6 , - 9 and - 22 , and vascular endothelial receptors IL17R , BDKRB1 , ENG and GNA13 ). Next to these vasoactive substances, a rapid induction of transcriptional regulators and signalling components involved in regulating growth and differentiation is observed.
Moggs et al. (2004) also reported that between 4 and 8 h after E 2 injection, no obvious changes in uterine histology occurred. However, many genes involved in mRNA (and protein synthesis) are induced, whereas a number of known transcriptional repressors (i.e. TGIF , MAD4 , EZH1 ) are suppressed. These changes are required to increase the mass of uterine cells to provide sufficient cellular components required for survival of the daughter cells ( Norbury and Nurse, 1992 ). These events occur immediately preceding the up-regulation of genes involved in controlling chromosome replication and the cell cycle. Luminal epithelial height doubled between 8 and 24 h, and mitotic activity was dramatically increased 24 h after E 2 injection and decreased again at 48 h. This agrees with the contention that most cells in the rodent uterus are stimulated to leave their quiescent state and divide synchronously after exposure to E 2 ( Quarmby and Korach, 1984 ). After induction, the expression of most genes decreased to levels well below that of the control animals, suggesting active repression to prevent further rounds of proliferation.
In parallel E 2 appeared to suppress the apoptotic process by inducing the expression of anti-apoptotic genes and simultaneously down-regulating the expression of pro-apoptotic genes. The investigations were able to provide more insight into the possible mechanisms that may be involved in the various events that lead to a receptive endometrium.
In this particular study ( Moggs et al. , 2004 ), the experiment was performed three times, and the observed uterine weight responses as well as the expression profiles of the estrogen-responsive reference genes including FOS and LTF were highly reproducible. The combination of independent experiments and the use of stringent selection criteria have increased the reliability of the findings. One would expect than that in independent studies performed in other laboratories some agreement exists. In a similar study also performed in ovariectomized immature mice by Fertuck et al. (2003) , temporal patterns of gene expression were identified after oral administration of EE instead of E 2 . Using functional gene annotation information from public databases, Fertuck et al. (2003) established associations between changes in gene expression and the pathways involved in the uterotrophic response. After K-means clustering, seven temporal gene expression patterns could be distinguished: genes induced at 2, 8, 12, 24 and 72 h, genes induced at 8 and 3 × 24 h, and genes induced at 24 and 3 × 24 h. Even these rigorous experimental and bioinformatics approaches resulted in only 31 genes that were also reported by Moggs et al. (Table 3 ). Of these 31 estrogen-regulated genes, only 14 showed similar temporal changes in gene expression. Two of the genes that were down-regulated were cell cycle-related, CCNG2 and GADD45 . These genes were also reported to be down-regulated prior to the induction of proliferation in other mouse studies ( Watanabe et al. , 2003 ). The difference in gene expression profiles could be explained by the fact that Fertuck et al. , used EE, a synthetic steroid which is significantly more stable than E 2 . Others, however, showed that the transcriptional profile in the rat uterus induced by EE is very similar to that of the endogenous E 2 ( Hyder et al. , 1999 ). This illustrates clearly that despite rigorous statistical procedures and validated experimental designs, the value of the findings for the scientific community is limited due to the large inter-laboratory variation.
E 2 -regulated genes in uteri of ovariectomized mice after phenotypic anchoring ( Moggs et al. , 2004 ; Fertuck et al. , 2003 )
| Gene symbol | Gene name | Fertuck et al. | Moggs et al. | ||||||
|---|---|---|---|---|---|---|---|---|---|
| 2 | 8 | 24 | 72 | 2 | 8 | 24 | 72 | ||
| ATF4 | Activating transcription factor 4 | 1.38 | 2.23 | 0.52 | 1.35 | 3 | 1 | 1 | 0 |
| CCNG2 | Cyclin G2 a | 0.98 | 0.09 | 0.18 | 0.68 | 0 | −2.5 | −2.5 | 0 |
| CFI | Complement component factor i a | 0.43 | 0.43 | 0.33 | 23.12 | 0.5 | 0 | 3 | 3 |
| CLCA3 | Chloride channel calcium activated 3 a | 1.05 | 0.33 | 5.26 | 8.34 | −1.5 | −3 | 3 | 3 |
| CRTR1-pending | TCFCP2 -related transcriptional repressor 1 a | 1.42 | 0.53 | 0.44 | 0.43 | 2 | 1 | −1 | 0 |
| CTSH | Cathepsin H a | 0.74 | 0.59 | 0.93 | 1.59 | 0 | 0 | 1 | 1.5 |
| DDX21 | DEAD/H (Asp-Glu-Ala-Asp/His) box polypeptide 21 (RNA helicase II-Gu) | 1.00 | 3.40 | 0.93 | 4.68 | 2 | 1.5 | 1 | 0 |
| EIF1A | Eukaryotic translation initiation factor 1A | 1.60 | 2.66 | 1.16 | 1.89 | 2 | 2 | 2.5 | 0.5 |
| EZH1 | Enhancer of zeste homolog 1 (Drosophila) | 0.76 | 0.59 | 2.56 | 0.84 | −2 | −1.5 | −1 | 0.5 |
| GADD45A | Growth arrest and DNA-damage-inducible 45 alpha a | 5.42 | 2.97 | 1.12 | 2.54 | 3 | 3 | 2 | 3 |
| H2-D1 | Histocompatibility 2, D region locus 1 | 0.37 | 1.48 | 0.70 | 1.41 | 0 | 0 | 0 | 2.5 |
| HRMT1/2 | Heterogeneous nuclear ribonucleoproteins methyltransferase-like 2 ( S. cerevisiae ) a | 0.49 | 7.28 | 4.57 | 0.70 | 0.5 | 1.5 | 1.5 | 0 |
| LCN2 | Lipocalin 2 | 1.32 | 0.72 | 0.92 | 0.86 | 1 | 3 | 3 | 3 |
| MUC1 | Mucin 1, transmembrane a | 0.54 | 2.18 | 3.73 | 7.20 | 0 | 0.5 | 3 | 3 |
| MX1 | Myxovirus (influenza virus) resistance 1 | 1.01 | 1.42 | 1.41 | 10.94 | 2 | 3 | 3 | 3 |
| NCL | Nucleolin a | 2.04 | 2.79 | 3.61 | 1.85 | 0 | 1 | 1 | 0 |
| PSMB2 | Proteasome (prosome, macropain) subunit, beta type 2 | 1.04 | 2.92 | 1.95 | 1.43 | 0.5 | 0.5 | 1 | 0 |
| PSMB3 | Proteasome (prosome, macropain) subunit, beta type 3 a | 0.74 | 2.58 | 2.15 | 1.27 | 0 | 1 | 1.5 | 0 |
| PSMB4 | Proteasome (prosome, macropain) subunit, beta type 4 | 0.95 | 1.27 | 0.70 | 1.26 | 1 | 2.5 | 1 | 0 |
| PSMB6 | Proteasome (prosome, macropain) subunit, beta type 6 | 0.99 | 2.10 | 1.14 | 1.25 | 0.5 | 2 | 2 | 0 |
| RAMP1 | Receptor (calcitonin) activity modifying protein 1 | 0.73 | 0.25 | 0.28 | 0.42 | −1 | −2 | −3 | 0 |
| RRM1 | Ribonucleotide reductase M1 | 1.16 | 3.58 | 2.90 | 3.22 | −0.5 | 0.5 | 0.5 | −2 |
| RRM2 | Ribonucleotide reductase M2 | 2.58 | 1.31 | 4.14 | 2.65 | 0.5 | 0.5 | 1 | −3 |
| SFRS10 | Splicing factor, arginine/serine-rich 10 | 1.91 | 1.56 | 1.34 | 2.24 | 3 | 3 | 3 | 0 |
| SMN | Survival motor neuron a | 1.68 | 2.39 | 2.28 | 0.85 | 0.5 | 0.5 | 1 | 0 |
| SNRK | SNF related kinase a | 2.01 | 0.61 | 0.73 | 0.44 | 3 | −1 | 0 | 1 |
| SOCS1 | Suppressor of cytokine signaling 1 a | 4.81 | 5.64 | 2.29 | 0.56 | 3 | 3 | 3 | 0 |
| SOCS3 | Suppressor of cytokine signaling 3 | 8.85 | 4.26 | 1.09 | 1.39 | 3 | 3 | 3 | 3 |
| SPRR2A | Small proline-rich protein 2A a | 0.37 | 1.22 | 32.23 | 31.19 | 0 | 3 | 3 | 3 |
| TAF10 | TAF10 RNA polymerase II, TATA box binding protein (TBP)-associated factor, 30 kDa | 0.96 | 1.04 | 0.66 | 1.00 | 0 | 0.5 | 1 | 0 |
| THBS1 | Thrombospondin 1 | 1.26 | 1.57 | 1.64 | 1.27 | 0.5 | 2 | 0 | 2 |
a Genes that show similar response profiles in both studies.
Estrogen regulation of gene expression in human endometrium
The exposure of the human endometrium to estrogen increases after ∼5–6 days after the onset of menstruation. At this point, the endometrial surface repair is already completed ( Ferenczy, 1976 ), and a major role has been indicated for the bone marrow-derived cells, which constitute about half the endometrial cell population ( Taylor, 2004 ). The major role of estrogen is supposedly to modulate the growth of the human endometrium by inducing proliferation. The proliferation index peaks between 8 and 10 days after the onset of menstruation in the upper one-third of the functionalis layer ( Ferenczy, 1976 ). At the same time, blood vessels have to develop to supply the growing tissue with nutrients and oxygen. This process appears to occur mostly as the result of vessel elongation rather than increased endothelial cell proliferation. The fact that endothelial cells only express ERβ and not ERα ( Critchley et al. , 2001 ) supports the contention that these cells are not primary targets of the proliferative effects of E 2 , which is mostly mediated by ERα and not ERβ. Following the increase in mitotic activity in the endometrium, stromal oedema increases ( Dubowy et al. , 2003 ), which is indicative of increased biological activity of VEGF-A leading to increased vascular permeability. However, we were not able to confirm that the expression of VEGF-A and its receptors show significant increases during this time ( Punyadeera et al. , 2006 ).
When searching the literature for microarray studies aimed at understanding the role of estrogen in the regulation of endometrial function, only a few studies are useful. Ethical restrictions limit the design of clinical studies, whereas in vitro models based on human endometrial cells have shown loss of steroid responsiveness. Only one study attempted to use a genomics approach to study the effects of estrogens on gene expression in cultured endometrial cells. Pole et al. (2005) sought to compare and characterize the transcript profile of tamoxifen, raloxifene and the agonist E 2 in human endometrial cells. Tissues ( n = 3) were collected in the proliferative phase of the menstrual cycle. The authors found 230 significant changes in gene expression for epithelial cells and 83 for stromal cultures, either specific to E 2 , tamoxifen or raloxifene, or changing across more than one treatment. Remarkable findings of this study are that (i) there were limited fold-changes observed, not exceeding 2.5-fold, (ii) there were a limited number of target genes shared by E 2 and tamoxifen (7/118) and E 2 and raloxifene (6/94), (iii) there were more genes comparably regulated between the SERMs tamoxifen and raloxifene than between E 2 and either tamoxifen or raloxifene and (iv) only three genes were also differentially expressed in our study in endometrium tissues ( Punyadeera et al. , 2005 ). A drawback of this study is that no validation experiments were performed to confirm the findings of the microarray analysis, which limits the reliability of the data.
In vitro tests offer several advantages including a low intra-assay variability; however, they do not reflect the sophisticated processes that occur in an intact tissue or animal, and therefore often show impaired steroid-responsiveness. In vitro studies based on whole tissue as we showed in an earlier study ( Punyadeera et al. , 2004 ), and in vivo studies have the added advantage that they may offer the opportunity to project the findings to the human situation.
Yanaihara et al. (2005) used laser capture microdissection (LCM) to study gene expression in epithelial and stromal cells of proliferative endometrium (CDs 6–9) of normal human endometrium from fertile women. This approach also allows the study of gene expression in individual cell populations at a given time point. Unfortunately, the investigators used BD Atlas Nylon cDNA Expression Arrays with a limited number of probes that resulted in the identification of only 14 and 12 genes that were strongly expressed in epithelial and stromal cells, respectively. Three of these genes are known cell cycle regulators, CDC28 protein kinase 2 ( CKS2 ), CCNA1 and CCNB1 . The objective of the study was to evaluate the gene expression profiles in epithelial and stromal cells, therefore no inferences could be made with regard to the actions of E 2 . However, one gene, decorin, was subsequently shown to be regulated by estrogen in stromal cells.
There is only one study which has focussed on elucidating the actions of estrogen in the human endometrium ( Punyadeera et al. , 2005 ). Gene expression profiles were compared between late proliferative (LP) and menstrual (M) phase endometrium. Genes expressed or suppressed in LP endometrium would reflect genes that are expressed at a late stage of endometrium development. We identified 282 gene transcripts that were up-regulated and 512 gene transcripts that were down-regulated in the LP phase compared with the M phase endometrium. As expected, some gene transcripts were elevated during menstruation (M phase endometrium) for example, inflammatory cytokines, enzymes involved in eicosanoid biosynthesis and immunomodulators and their receptors. Also angiogenic modulators, hypoxia-induced proteins (i.e. heamoxygenase-1, adrenomedullin, carbonic anhydrase II, VEGF , CYR61 and hypoxia-induced protein-1) and MMP's were highly expressed in M phase endometrium ( Punyadeera et al. , 2005 ). In turn, the expression of different cell cycle regulators was overexpressed in LP phase endometrium (Table 4 ).
Cell cycle regulators differentially expressed in late proliferative (LP) versus menstrual (M) phase endometrium ( Punyadeera et al. , 2005 )
| Gene | Fold-change |
|---|---|
| A. In vivo –LP phase versus M phase endometrium | |
| CCNA1 | 3.4 a |
| CCNB1 | 4.3 a |
| CCNB2 | 4.3 a |
| CCNL1 | −3.3 |
| CDC2 | 3.2 a |
| CDC20 | 6.8 a |
| CDC6 | 3.0 a |
| CDCA3 | 4.8 |
| CKS2 ( CDC28 kinase 2 ) | 2.3 |
| CDKN1A ( p21, CIP1 ) | −3.8 |
| CDKN2C | 3.4 a |
| CDKN3 | 2.4 a |
| GADD45B | −6.2 a |
| B. In vitro —M phase endometrium treated with 17β-E 2 | |
| CCNA1 | 3.5 a |
| CCNL2 | 2.2 |
| CDK10 | 4.4 |
| CDKN2B | 3.3 |
a Genes also found oppositely regulated in secretory when compared to proliferative endometrium.
We compared these profiles also with the profiles of explant cultures prepared from the same biopsies (M and LP phase endometrium) treated with E 2 for 24 h. This approach would theoretically distinguish genes that are directly regulated by estrogen from those that require extended exposure to estrogen. We found 148 and 45 gene transcripts to be up- and down-regulated, respectively, by E 2 in M phase endometrium. In LP phase endometrium only 12 transcripts were up-regulated and four transcripts were down-regulated by E 2 . This clearly demonstrates that the responsiveness of the human endometrium is reduced after prolonged exposure to E 2in vivo , probably because all relevant genes have already been activated at this time.
In contrast, when these tissues are treated with progesterone, LP phase endometrium responds much better (219 versus 117 genes in M phase endometrium; Dassen et al. , submitted), indicating that the responsiveness of the endometrium to progesterone increases after extended periods of exposure to estrogen.
Indirectly, potential estrogen regulated genes should also be extractable from studies investigating changes in gene expression throughout the menstrual cycle. Particularly from studies which have being performed on global gene profiling using endometrium collected in early and late the proliferative phase. Only one study meets this criterion ( Ponnampalam et al. , 2004 ), even though the attention of these authors was mostly focussed on the secretory phase. With regard to the proliferative phase endometrium, the authors stated that there is little evidence of major changes in gene expression that correlates with the rise in estrogen during the proliferative phase of the cycle. However close examination of the clusters defined by the investigators clearly show differences between the menstrual, early/mid-proliferative, mid-proliferative and LP/early secretory stages. Comparing the genes to those identified in our study ( Punyadeera et al. , 2005 ), we found 20 genes to be common to both studies (Table 5 ). In contrast to our expectations, none of these genes were cell cycle regulators.
Genes common to the studies of Ponnampalam et al. and Punydeera et al.
| Ponnampalam et al. (2004) | Punyadeera et al. (2005) |
|---|---|
| High menstrual, low proliferative (Clusters 2, 5, 6, 7) | LP versus menstrual |
| CENPF | +9.7 |
| NCR3 | −6.6 a |
| SOX4 | −4.58 a |
| TYMS | +5.2 |
| TAC1 | −5.9 a |
| DNAJB1 | −4.2 a |
| STC1 | −20.4 a |
| DTR | −12.6 a |
| CD59 | −2.5 a |
| EDN2 | −2.4 a |
| S100P | −6.8 a |
| TGFA | −3.0 a |
| IL7R | −4.9 a |
| RAI3 | −16.6 a |
| ITGA2 | −5.0 a |
| Low menstrual, up proliferative (Cluster 3) | |
| DCI | +3.5 a |
| TRIP13 | +2.0 a |
| Low early, high LP (Cluster 4) | |
| HMGB2 | +3.5 a |
| CSTF2 | −3.2 |
| PDEF | +5.4 a |
a Genes displaying similar changes in both studies.
Estrogen regulation of cell cycle regulators
Rodent uterus
Estrogen is the most important regulator of proliferation in endometrium. Yet, we know surprisingly little about the subcellular processes involved in estrogen regulation of proliferation. Even in the microarray studies mentioned above, little attention has been given to this aspect of endometrial development. Four studies have attempted to extract information from the array data to understand how estrogens affect the cell cycle: ( Fertuck et al. , 2003 ; Hewitt et al. , 2003 , 2005 ; Moggs et al. , 2004 ). Only a small subset of genes was frequently affected by E 2 in the murine or rat uterus. As indicated earlier, the expression of the cell cycle inhibitors GADD45 and CCNG2 is suppressed by E 2 treatment prior to the up-regulation of various cell cycle inducers. A direct involvement of E 2 -occupied ERα in the down-regulation of CCNG2 was recently shown by Stossi et al. (2006) . They observed that the suppression of CCNG2 is associated with the recruitment of the co-repressor N-CoR and histone deacetylases, leading to a hypoacetylated state of the chromatin ( Stossi et al. , 2006 ). Although GADD45 suppression by estrogen in the rodent uterus has not yet been shown, these observations point to the fact that the proliferative response induced by estrogen is initiated by the down-regulation of cell cycle inhibitors, rather than the induction or activation of cell cycle stimulators. This is further substantiated by the studies of Hewitt et al. (2003 , 2005 ), Watanabe et al. (2003) , Moggs et al. (2004) and Hong et al. (2004) . The common denominators in these studies next to CCNG2 , are p27 KIP1 ( CDKN1B ) and GAS1 . These cell cycle inhibitors are down-regulated during the first 1–8 h after estrogen administration. Other negative regulators of the cell cycle reported in more than one study are p21 CIP1 ( CDKN1A ) and MAD 2. Upon administration of E 2 , both p21 CIP1 ( CDKN1A ) and MAD 2 expression peak during the first 6 h, after which the expression decreases again. MAD 2 interacts with the anaphase-promoting complex (APC) which is required for anaphase initiation and exit of mitosis ( Fang et al. , 1999 ). Upon binding of MAD 2, activation of the APC is inhibited and the cells are arrested at the prometaphase. Upon the decrease in MAD 2 these cells will enter mitosis that may result in the first wave of cell divisions observed after about 16 h. Parallel to the decrease in MAD2 , levels of CCNE1 (which is involved in the G1 to S transition in the cell cycle) increase dramatically ( Hewitt et al. , 2003 , 2005 ). At this point levels of p21 CIP1 , which inhibits S-phase entry, are still elevated. The levels start decreasing 15 h post-E 2 , at the same time that CCNE1 and CCNG1 levels increase. This may allow cells to progress from the G1 to the S-phase and initiate the second wave of mitotic divisions. The increase in CCNE1 was also observed in response to IGF, indicating that this cyclin also mediates the growth factor induced proliferative response ( Hewitt et al. , 2005 ).
Human endometrium
When comparing the gene expression profiles of LP phase and M phase endometrium, we observed that the expression of a subset of cell cycle regulators was differentially expressed (Table 4 ) ( Punyadeera et al. , 2005 ). Particularly interesting is the down-regulation of the cell cycle inhibitors p21 CIP and GADD45 , which were also implicated in the regulation of murine uterine growth by E 2 . In addition, the expression of the cell cycle inducers CKS2 , CCNA1 and CCNB1 , also reported by Yanaihara et al. (2005) , was elevated in LP phase endometrium as compared with M phase endometrium.
An alternative way to deduce candidate genes involved in estrogen-regulation of proliferation, is to evaluate expression profiles after exposure to the natural antagonist of E 2 , progesterone. We generated gene expression profiles for two biopsies collected on cycle day 23 of the menstrual cycle, the end of the implantation window, and compared them with the profiles of two biopsies collected on cycle day 9 of the menstrual cycle, the mid-proliferative phase. We extracted the most common cell cycle regulators (more than 2-fold difference), and found a total of 43 genes differentially expressed: 11 genes were up-regulated and 32 genes were down-regulated in secretory phase endometrium (Table 6 ; unpublished data). These genes were compared with the genes which were found to be elevated in LP phase endometrium when compared with M phase endometrium ( Punyadeera et al. , 2005 ) and presumably induced by estrogen. Eight genes were down-regulated and one gene was up-regulated ( GADD45 ) in the secretory phase endometrium (Table 6 ). We also compared these findings with the results of the extensive study by Talbi et al. (2006) , who studied gene expression in histologically well-defined biopsies of human endometrium throughout the menstrual cycle. In the gene list resulting from the comparison between the secretory and proliferative endometrium, 13 cell cycle related genes corresponded to our findings: 11 genes were down-regulated and two genes were up-regulated in the secretory endometrium (Table 6 ). Interestingly, the expression of various cell cycle inhibitors, i.e. GADD45 , GAS1 , CDKN1C ( KIP2 ), is dramatically induced in secretory endometrium, supporting the findings from the mouse studies indicating that the role of cell cycle inhibitors in the regulation of proliferation may have been underestimated thus far.
Cell cycle regulators differentially expressed in secretory versus proliferative phase endometrium
| Gene symbol | Gene name | >2-fold Prol/Secr |
|---|---|---|
| CDC2 | Cell division cycle 2, G1 to S and G2 to M | 13.1 a |
| CDC45L | CDC45 cell division cycle 45-like ( S. cerevisiae ) | 11.77 |
| CCNA1 | Cyclin A1 | 10.79 a |
| CCNA2 | Cyclin A2 | 10.64 a |
| CCNB2 | Cyclin B2 | 8.6 a |
| CCNB1 | Cyclin B1 | 7.94 a |
| CCNE2 | Cyclin E2 | 6.84 |
| CDC25C | Cell division cycle 25C | 6.63 a |
| CDCA8 | Cell division cycle associated 8 | 6.56 |
| CKS2 | CDC28 protein kinase regulatory subunit 2 | 5.99 a |
| CDK5R2 | Cyclin-dependent kinase 5, regulatory subunit 2 (p39) | 5.81 |
| CDC6 | CDC6 cell division cycle 6 homolog ( S. cerevisiae ) | 5.44 a |
| CDKN3 | Cyclin-dependent kinase inhibitor 3 (CDK2-associated dual specificit) | 4.9 a |
| PCNA | Proliferating cell nuclear antigen | 4.13 a |
| CDKL2 | Cyclin-dependent kinase like 2 ( CDC2 -related kinase) | 4.09 |
| CDC20 | CDC20 cell division cycle 20 homolog ( S. cerevisiae ) | 3.88 a |
| GDF1 | Growth differentiation factor 1 | 3.77 |
| GDF3 | Growth differentiation factor 3 | 3.7 |
| GAS2 | Growth arrest-specific 2 | 3.65 |
| CKS1B | CDC28 protein kinase regulatory subunit 1B | 3.62 |
| CDKN2C | Cyclin-dependent kinase inhibitor 2C (p18, inhibits CDK4 ) | 3.27 a |
| CDCA3 | Cell division cycle associated 3 | 3.18 |
| GDF5 | Growth differentiation factor 5 (cartilage-derived morphogenetic prote) | 3.08 |
| GAS41 | Growth arrest-specific 41 | 2.82 |
| CDC25A | Cell division cycle 25A | 2.66 |
| CDK2 | Cyclin-dependent kinase 2 | 2.55 |
| CDK5R1 | Cyclin-dependent kinase 5, regulatory subunit 1 (p35) | 2.54 |
| CDC7 | CDC7 cell division cycle 7 ( S. cerevisiae ) | 2.53 |
| CCNF | Cyclin F | 2.39 |
| CDKL3 | Cyclin-dependent kinase-like 3 | 2.26 |
| GDF11 | Growth differentiation factor 11 | 2.09 |
| CDKN2D | Cyclin-Dependent kinase inhibitor 2D (p19, inhibits CDK4 ) | 2.03 |
| CDC42EP3 | CDC42 effecotr protein (Rho GTPase binding) 3 | 0.49 |
| CDC34 | Cell division cycle 34 | 0.48 |
| CDC42EP4 | CDC42 binding protein (Rho GTPase binding) 4 | 0.45 |
| CCNI | Cyclin I | 0.45 |
| CGR11 | Cell growth regulatory with EF-hand domain | 0.43 |
| CDC42BPA | CDC42 binding protein kinae alpha (DMPK-like) | 0.42 |
| GADD45B | Growth arrest and DNA-damage-inducible, beta | 0.31 a |
| GDF8 | Growth differentiation factor 8 | 0.23 |
| CDKN1C | Cyclin-dependent kinase inhibitor 1C (p57, Kip2 ) | 0.15 |
| GADD45A | Growth arrest and DNA-damage-inducible, alpha | 0.12 |
| GAS1 | Growth arrest-specific 1 | 0.11 a |
a Genes indicated are also reported in the study of Talbi et al. (2006) .
Estrogen regulation of the cell cycle has been extensively studied in breast cancer cell lines (reviewed by Doisneau-Sixou et al. , 2003 ), and central roles have been identified for CMYC , CCND1 and its binding partners CDK4 and CDK6 , CCNE and its binding partner CDK2 , and the CDK inhibitor p21 CIP . In brief, CMYC and CCND1 can independently mediate the effects of estrogen on cell cycle progression. These pathways converge at the CCNE – CDK2 complex that is activated by stimulating the dissociation of p21 CIP from this complex. This dissociation is mostly a result of the down-regulation of p21 CIP gene transcription. After up-regulation by estrogen, CCND1 complexes with CDK4 and CDK6 , which are potent kinases, which, in turn, phosphorylate pRb and, within 9 h, the cell enters in the S-phase. Even though MYC does not enhance the expression of CCND1 , suppression of MYC expression reduced CCND1 expression and prevents estrogen-stimulated cell cycle progression.
As a model to elucidate the mechanism of estrogen-stimulated cell proliferation, we have investigated the expression of a subset of these cell cycle regulators in endometrial and breast cancer cell lines treated with E 2 (1.0 nM). The endometrial cancer cell line ECC1 and the breast cancer cell line T47D respond nicely to E 2 treatment as illustrated by the induction of the transcription of the estrogen-responsive gene Tff1 in both cell lines (Fig. 1 A). Yet, T47D cells respond to estrogen stimulation with strong cell proliferation, whereas ECC1 cells do not. To explain this, we evaluated the expression of various cell cycle regulators in both cell lines. In both cell lines, the key gene in the regulation of proliferation, MYC is strongly induced in both cell lines with maximal expression 1 h after E 2 stimulation (Fig. 1 A). Subsequently, in T47D cells the expression of the cell cycle activators CCNA (∼2 h), CCNB (6 h) and CCND and CCNE (16 h) is also induced (Fig. 1 B). When evaluating the expression of cell cycle suppressors, it was apparent that in the T47D cells the expression of GADD45A and GADD45B was down-regulated after 2 h, whereas in the ECC-1 cells the expression of GADD45A was not inhibited, whereas the expression of GADD45B was highly induced (Fig. 1 C). These evidences support the aforementioned hypothesis that the down-regulation of cell-cycle inhibitors is one of the first actions in E 2 -induced cell proliferation.
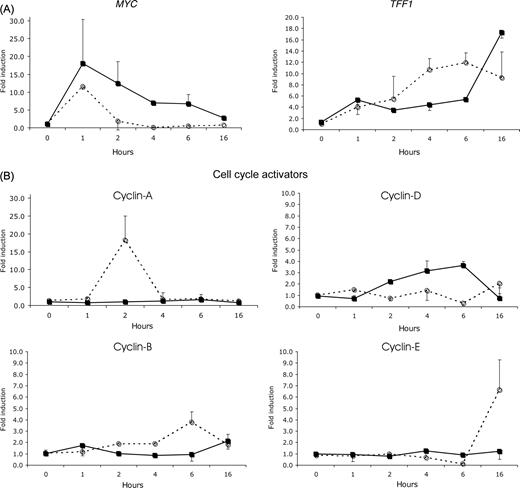
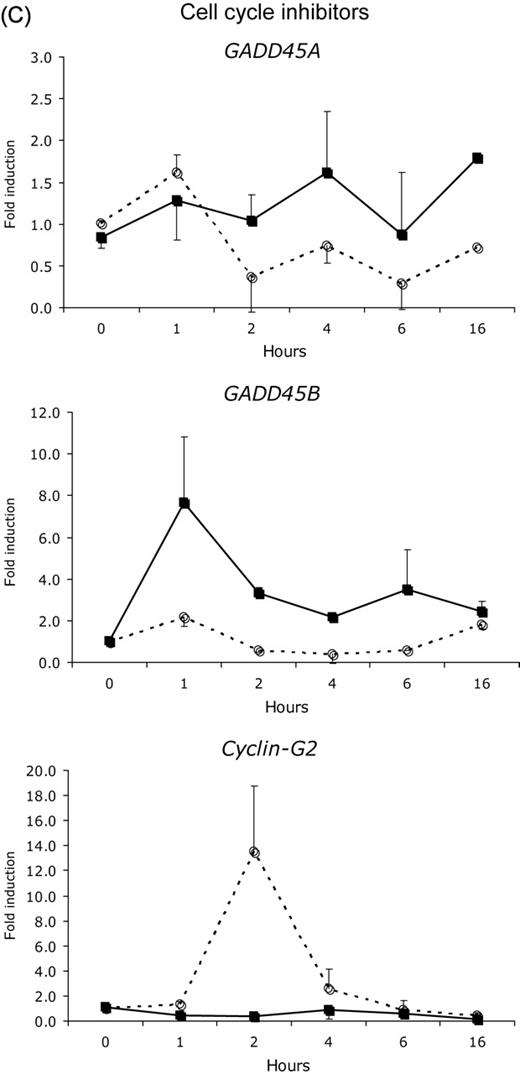
Estrogen regulation of the expression of cell cycle regulators in the endometrial carcinoma cells ECC1 (solid line) and breast carcinoma cells T47D (dotted line). Gene transcript levels were assessed by quantitative real-time PCR after 0, 1, 2, 4, 6 and 16 h incubation with E 2 . Presented are the results for ( A ) the estrogen-responsive genes TFF1 and MYC , ( B ) the cell-cycle activators CCNA , CCNB and CCNE ( C ) the cell cycle inhibitors GADD45A , GADD45B and CCNG2
Surprisingly, however, we observed that in T47D cells the expression of CCNG2 is induced after 6 h of E 2 treatment (1.0 nM). As this was not seen in the ECC-1 cells, we tend to believe that the CCNG2 is a cell cycle activator. This contradicts however, the finding of Stossi et al. (2006) in MCF-7 cells, which clearly indicated CCNG2 as a cell cycle suppressor. These observations show that mechanisms of estrogen control of proliferation as revealed in one breast cancer cell line cannot habitually be extrapolated to other breast cancer cell lines or any other model system, without extensive validation.
Variations in the expression of cell cycle regulators in tissues may very well be masked during genomic profiling by their cell-specific expression patterns. There are multiple cell types present in the human endometrium that contribute to the growth of the endometrium tissue and studying gene expression on a tissue provides no information about the individual cell types. Moreover, expression has also to be confirmed at the protein level in order to draw any conclusions. For instance, expression of CCNE implicated as a key regulator of estrogen induced cell cycle progression, is most prominent in the glandular epithelium, and migrates from the cytoplasm in the mid-proliferative phase to the nucleus in the secretory phase. This dramatic change in intracellular distribution may occur without alterations in mRNA levels. In addition, it is also strongly expressed in blood vessels, yet it is almost absent in the stromal cells. This would implicate a role for CCNE in endothelial and epithelial cells rather than the stromal cells.
It is apparent that the mechanism by which estrogen regulates endometrial cell proliferation and differentiation is far from elucidated. Close examination of the gene expression data and validation of cell cycle regulators may facilitate this.
Is extrapolation of rodent genomic profiling data to humans feasible?
The analogy between the role of estrogen in the rodent and human uterus is restricted to the major growth promoting effect. Besides this, there are major differences between the actions of estrogen in the rodent and human uterus. For example, in rodents estrogen is essential for both epithelial proliferation and embryo implantation ( Curtis Hewitt et al. , 2002 ), whereas in humans prolonged estrogen exposure is required for endometrial growth, but its presence is not required during embryo implantation. In addition, the first effects of estrogen in the rodent uterus are effects on the vasculature resulting in increased vascular permeability and leakage of fluids into the interstitial space, whereas in the human endometrium angiogenic activity is initially triggered by the post-menstrual hypoxic milieu which results in the up-regulation of angiogenic factors, including VEGF-A ( Punyadeera et al. , 2006 ; Sharkey et al. , 2000 ).
The differences with regard to the effects of estrogen on endometrial function in rodents and human also become apparent when comparing rodent and human gene expression profiling studies. Gene expression profiling is generally performed in preparations of the whole uterus rather than only the endometrium. Therefore, certain differences may be masked and also result in false positives due to the inclusion of the myometrial tissue.
In a first attempt to make such a comparison, we compared expression profiles reported in the rodent uterus and human endometrium in similar physiological conditions. We have compared the gene expression profiles of LP phase endometrium, during which estrogen exposure of the endometrium has reached its maximum, with M phase endometrium (cycle day 3 and 4), during which estrogen levels are at their lowest point during the menstrual cycle ( Punyadeera et al. , 2005 ). In analogy, these genes would have to be compared with genes which are modulated during the peak levels of pre-ovulatory estrogen, such as in ovariectomized mice treated with E 2 ( Moggs et al. , 2004 ). When comparing the results of Moggs et al. with our own data, we observed only 27 common genes, of which 14 were regulated similarly in both species. Some genes involved in DNA replication and cell division were also up-regulated in LP phase endometrium (i.e. PCNA , CDC6 , CCNB1 ; Table 7 ). Interestingly, the expression of the cell cycle inhibitors, CDKN1A (p21 CIP ) and GADD45 , was also down-regulated in the human endometrium during periods of high proliferative activity. None of the genes involved in the RNA and protein synthesis reported by Moggs et al. was common, whereas we did find various transcriptional regulators and signalling genes in our arrays (Table 7 ). Despite the fact that rodent models allow close investigation of the actions of ovarian steroid hormones with regard to the regulation of uterine function, the limited analogy with the actions of estrogen in the human endometrium hampers extrapolation of the findings to the human situation. The limited agreement between rodent and human findings may also be caused by differences in nomenclature of human and murine genes. Initiatives are ongoing to synchronize the naming of homologous genes (reviewed by Wright and Bruford, 2006 ).
Genes reported in both human endometrium ( Punyadeera et al. , 2005 ) and murine uterus ( Moggs et al. , 2004 )
| Gene symbol | Gene title | >2-fold Prol/Secr | Moggs et al. | |||
|---|---|---|---|---|---|---|
| 1 h | 4 h | 8 h | 24 h | |||
| AFT3 | Activating transcription factor 3 a | −17.4 | 3 | 2 | 0 | −0.5 |
| NR4A1 | Nuclear receptor subfamily 4, group A, member 1 a | −14.8 | 3 | 3 | 0.5 | −0.5 |
| ADM | Adrenomedullin a | −13.8 | 2 | 2.5 | 2 | 0 |
| LCN2 | Lipocalin 2 (oncogene 24p3) | −6.5 | 0 | 3 | 3 | 3 |
| GADD45B | Growth arrest and DNA-damage-inducible, beta | −6.2 | 3 | 3 | 3 | 2 |
| SUI1 | Putative translation initiation factor | −5.8 | 0 | 2.5 | 2 | 2 |
| VEGF | Vascular endothelial growth factor a | −4.9 | 3 | 3 | 0.5 | −0.5 |
| SOCS3 | Suppressor of cytokine signaling 3 | −4.8 | 3 | 3 | 3 | 3 |
| PDGFRA | Platelet-derived growth factor receptor, alpha polypeptide a | −3.9 | 0 | 3 | 0 | 0 |
| CDKN1A | Cyclin-dependent kinase inhibitor 1A (p21, Cip1) a | −3.8 | 3 | 3 | 3 | 0.5 |
| AMGPT2 | Angiopoietin 2 | −3.6 | 0 | 2.5 | 2 | 2 |
| CD68 | CD68 antigen | −3.1 | 0 | 0.5 | 0.5 | 0.5 |
| SNK | Serum-inducible kinase | −2.6 | 2.5 | 3 | 3 | 3 |
| CEBPB | CCAAT/enhancer binding protein (C/EBP), beta a | −2.6 | 3 | 0.5 | −1 | −0.5 |
| SPP1 | Secreted phosphoprotein 1 (osteopontin) | −2.6 | −1 | 1 | 2 | 3 |
| CD14 | CD14 antigen | −2.4 | −0.5 | 0 | −1 | 0.5 |
| C3 | Complement component 3 | −2.3 | 0 | 1.5 | 3 | 3 |
| MAP2K3 | Motogen-activated protein kinase kinase 3 | −2.1 | 0 | 2 | 0.5 | 0.5 |
| CTSS | Cathepsin S | −2.0 | 0 | 0 | 0 | 0.5 |
| FEN1 | Flap structure-specific endonuclease 1 | 2.2 | 1 | 0 | 0.5 | 3 |
| PC4 | Activated RNA polymerase II transcription cofactor 4 a | 2.2 | 0 | 3 | 2.5 | 0.5 |
| PCNA | Proliferating cell nuclear antigen a | 2.3 | 0 | 1 | 0.5 | 1 |
| MCM2 | MCM2 minichromosome maintenance deficient 2 a | 2.5 | 0 | 0 | 2 | 3 |
| CDC6 | CDC6 cell division cycle 6 homolog ( S. cerevisiae ) a | 3.0 | 0 | 0 | 2 | 3 |
| MCM4 | MCM4 minichromosome maintenance deficient 4 ( S. cerevisiae ) a | 3.2 | 0 | 0 | 2 | 3 |
| CCNB1 | Cyclin B1 a | 4.3 | 0 | 0 | −1 | 3 |
| RRM2 | Ribonucleotide reductase M2 polypeptide a | 4.9 | 0.5 | 0.5 | 1 | 3 |
a Some genes show similar response patterns: low ratio in proliferative/secretory phase endometrium and down-regulated by 17ß-E2 in ovariectomized mice, or vice versa.
Concluding remarks
We are far from understanding the mechanisms by which E 2 regulates endometrial growth and differentiation. Even though gene expression profiling can be beneficial in revealing the biological processes and cellular functions involved, they have not yet significantly contributed to better insights in the role of E 2 . Thus far, we have learned more from ‘hypothesis-driven’ research approaches, whereas the validity of the findings of the ‘hypothesis-generating’ genomics approaches have not yet improved our understanding of the regulation of endometrial function in humans.
The infrequent similarities between the responses of rodent and human uterus to estrogen, limits extrapolation of findings in rodent models. In addition, the large differences between studies performed in different laboratories and the biological variation that exists between samples is a major issue of concern and calls for large multicenter collaborations to increase numbers of samples and reduce variations with regard to the choice of platform, sample and probe preparation and hybridization. Also the use of ‘clean’ samples consisting of individual cell types, such as those collected with Laser capture microdissection, would provide more sensible information. However, technical restrictions have thus far prohibited such studies.
