


Abstract
To examine narrative feedback to understand surgical team perceptions about surgical safety checklists (SSCs) and their impact on the safety of surgical practice.
We reviewed free-text comments from surveys administered before and after SSC implementation between 2011 and 2013. We categorized feedback thematically and as positive, negative or neutral.
South Carolina hospitals participating in a statewide collaborative on checklist implementation.
Surgical teams from 11 hospitals offering free-text comments in both pre-and post-implementation surveys.
Implementation of the World Health Organization SSC.
Differences in comments made before and after implementation and by provider role; types of complications averted through checklist use.
Before SSC implementation, the proportion of positive comments among provider roles differed significantly (P = 0.04), with more clinicians offering negative comments (87.9%, (29/33)) compared to other surgical team members (58.3% (7/12) to 60.9% (14/23)), after SSC implementation, these proportions did not significantly differ (clinicians 77.8% (14/18)), other surgical team members (50% (2/4) to 76.9% (20/26)) (P = 0.52). Distribution of negative comments differed significantly before and after implementation (P = 0.01); for example, there were more negative comments made about checklist buy-in after implementation (51.3 % (20/39)) compared to before implementation (24.5% (13/53)). Surgical team members most frequently reported that checklist use averted complications involving antibiotic administration, equipment and side/site of surgery.
Narrative feedback suggested that SSC implementation can facilitate patient safety by averting complications; however, buy-in is a persistent challenge. Presenting information on the impact of the SSC on lives saved, teamwork and complications averted, adapting the SSC to fit the local context, demonstrating leadership support and engaging champions to promote checklist use and address concerns could improve checklist adoption and efficacy.
Introduction
The World Health Organization surgical safety checklist (SSC) was designed to reduce preventable surgical complications [1] by promoting well-coordinated teamwork and consistent practices [2, 3], but studies of the SSC have yielded mixed results. Some have found reduced complications, [4–6] reduced mortality [6, 7] and improved operating room (OR) personnel attitudes [6, 7], while others report no significant impact [8, 9]. These inconsistent findings may reflect variable checklist implementation [3, 10] stemming from different organizational cultures and philosophies about surgical practice [11–14].
Environments emphasizing safety have been linked to positive outcomes and effectiveness of initiatives like SSCs [15–18]. However, little is known about what increases the likelihood that interventions will improve safe practice and foster safe environments, and how administering safe practice assessments affects the willingness of OR personnel to use aides like SSCs [15]. Qualitative investigation of these and other elements of safety culture and patient safety innovations is needed [15, 16].
We exploited a valuable yet underutilized data source—narrative feedback via free-text comments [19–21]—to understand surgical team members’ perceptions. Studies have shown that open-ended survey responses can provide a nuanced understanding of respondent experience [22, 23] and illuminate respondent behavior and preferences [24]. Our objective was to gain insight into how surgical team members perceive safety in the OR, how to improve checklist implementation, and how the SSC impacts the safety of surgical practice.
Methods
Research design and sample
This study used data collected as part of the Safe Surgery 2015: South Carolina initiative [25]. The implementation of the SSC was the main initiative underway by the hospitals during this time. We analyzed surgical team members’ perceptions of perioperative safety using data from an open-ended question in an otherwise closed-ended assessment of the safety of surgical practice before and after SSC implementation.
The pre- and post-implementation surveys included Likert-scale items related to aspects of the safety of surgical practice, nine demographic questions and solicited open-ended feedback. The post-implementation survey also asked about complications that had been averted. These previously published surveys [26, 27] are available upon request.
Data collection
Surveys were administered before and after SSC implementation in 38 hospitals (38 at baseline, 13 following implementation). All OR personnel, including surgeons, anesthesiologists, certified registered nurse anesthetists (CRNAs), surgical nurses and surgical technicians were included. To preserve anonymity, we did not collect identifiers that would allow matching respondents pre- and post-implementation.
We administered surveys by mail and/or electronically between June 2011 and May 2013. Study procedures were developed in collaboration with the South Carolina Hospital Association and approved by the Human Subjects Committee at the Harvard T.H. Chan School of Public Health.
Data analysis
We analyzed narrative data using accepted methods for qualitative analysis [28]. We used inductive coding to identify key emergent themes from respondents’ free-text comments at baseline by developing a set of preliminary codes that were applied to all comments. We established coding reliability by having two authors independently code the comments and compare their coding. Differences were discussed and resolved, leading to a refinement of themes and their definitions. The final themes included: checklist buy-in, team communication and coordination, patient safety climate, checklist quality and effectiveness, turnover and time considerations, leadership support, OR logistics and equipment issues, freedom to speak up, perceived hierarchy and staffing issues (Table 1).
Key themes in the free-text comments and illustrative positive and negative comments (N = 21 hospitals)a
| Category | Positive illustrative quote | Negative illustrative quote |
|---|---|---|
| Checklist buy-in | ||
| Acceptance, interest and enthusiasm for the use of the SSC from one or more members of the OR team. | ‘We have improved in every way due to the checklist.’ | ‘Surgeons are flippant about the surgical checklist.’ |
| Team communication and coordination | ||
| Ways that information sharing and interactions among the members of an OR team or staff hospital-wide happen. | ‘I strongly believe that the checklist encourages conversation among members of the staff.’ | ‘Physicians need to be trained to understand the importance of Time Out and they need to learn how to discuss what they plan on doing with all team members and not just another MD.’ |
| Patient safety climate | ||
| Priority assigned to patient safety and quality improvement in the organization. | ‘Patient Safety is always at the forefront of our institution.’ | ‘… it is very difficult, if not impossible, for the checklist to result in positive changes in an OR when the culture is so poor…’ |
| Quality and effectiveness of the checklist | ||
| Quality, safety, efficiency, effectiveness or validity of an element of the checklist or the checklist as a whole, and its relevance/applicability to the specific needs of the local hospital. | ‘The brief - debrief process has been a dream come true for me! I appreciate the follow up that is done within our department and other areas of the hospital.’ | ‘I think the checklist is becoming such a habit that it is losing its impact.’ |
| Turnover and time considerations | ||
| Time-related issues in surgery and OR flow, such as pressure to turn over the OR quickly, and surgical protocols that extend OR times without perceived benefit or hospital support. | ‘Rushing to turn over room at times gets in the way of safety…’ | |
| Leadership support | ||
| Departmental and hospital-level leadership, management and administration activity that impacts surgical safety culture. | ‘…The upper management giving the directive that the time out is not an option…it is a requirement helped a great deal….’ | ‘Administration is more interested in case turnover and start times than patient safety.’ |
| OR logistics and equipment issues | ||
| Problems or concerns with equipment and logistical issues in the OR that may affect patient safety. | ‘I consistently find old blood on equipment in the OR rooms & surgical OR tables.’ | |
| Freedom to speak up | ||
| Feelings about psychological safety in voicing opinions or concerns about surgical safety without facing a hostile hospital environment. | ‘Our general surgeons and GYN surgeons are very approachable and open to comments or concerns about patient care and safety.’ | ‘Some errors are not reported due to fear of retaliation…’ |
| Perceived hierarchy | ||
| Impact of OR team members (e.g. surgeon) in setting the overall tone for patient safety in the OR. | ‘…surgeons still believing they are the captains of the ship.’ | |
| Staffing issues | ||
| OR personnel challenges that jeopardize surgical safety, e.g. high turnover of nursing staff and lack of sufficient numbers of personnel. | ‘…I have never seen such a turnover of OR staff as in the OR I work in. It is awful….’ | |
| Otherb | ||
aNine additional comments coded as neutral and not included in the analysis.
bIncludes Staff Awareness of Checklist and Education.
There were 11 hospitals where respondents provided free-text comments in both pre- and post-implementation surveys; we deductively assigned themes to these comments. Statements unrelated to patient safety or the SSC were excluded and multifaceted responses were deconstructed so that each comment was independently categorized by theme and classified as positive, negative or neutral. Three coders independently coded all comments, compared results and reached a consensus regarding discrepancies. The remaining authors reviewed themes and final classification of comments.
We used Fisher's exact test to analyze the differences in characteristics among respondents and then evaluated the difference in proportion of positive and negative comments by theme before and after SSC implementation. We stratified the comments in each category by professional role: physicians and advanced practice clinicians (including surgeons, anesthesiologists, physician assistants and CRNAs), surgical nurses, technicians (technicians and perfusionists) and ‘other’ (administrative staff, hospital management, preoperative nurses and recovery room nurses). We used Fisher's exact test to evaluate whether the proportion of positive and negative comments differed before and after SSC implementation for each professional role. Neutral responses were excluded. We also used Fisher's exact test to compare the distribution of positive and negative comments separately, by theme, before and after SSC implementation. All tests were two-sided with P-values < 0.05 considered significant. All statistical tests were performed using SAS 9.3 (SAS Institute Inc., Cary, NC).
Finally, we used thematic analysis [29] to explore differences within these themes before and after implementation. We also categorized the types of complications averted through checklist use after SSC implementation.
Results
Respondent characteristics
Among hospitals participating in the Safe Surgery 2015: South Carolina initiative, 38 administered the pre-implementation survey and 13 administered the post-implementation survey. The response rate was 41.3% (2038 respondents/4932 surveyed; 38 hospitals) [26] for the pre-implementation survey and 42.7% (815 respondents/1909 surveyed; 13 hospitals) [27] for the post-implementation survey. Twenty-one hospitals offered free-text comments at pre-implementation and 11 hospitals offered free-text comments in both pre- and post-implementation surveys. Among the 11 hospitals, pre-implementation surveys had a response rate of 43.4% (787/1812), of which 6.9% (54/787) offered free-text comments. The post-implementation surveys had a response rate of 39% (632/1622), of which 7.9% (50/632) offered free-text comments. There were no differences in the characteristics of hospitals that offered free-text comments and those that did not offer comments in terms of teaching status (P = 0.40), urban versus rural location (P = 0.13) and bed size (P = 0.32) (data not shown). Characteristics of respondents who offered comments are shown in Table 2. There were no statistically significant differences in respondent characteristics before and after implementation.
Respondents from Hospitals (N = 11) that Administered Pre- and Post-Intervention Culture Surveys
| Characteristics of respondents before implementation N = 54 | Characteristic of respondents after implementation N = 50 | P-valuea | |
|---|---|---|---|
| n (%) | n (%) | ||
| Primary role | 0.24 | ||
| Surgeon | 10 (18.5) | 9 (18.0) | |
| Anesthesiologist/CRNA | 13 (24.1) | 11 (22.0) | |
| Surgical nurse/Surgical Tech | 23 (42.6) | 28 (56.0) | |
| Otherb | 7 (13.0) | 1 (2.0) | |
| Missing | 1 (1.85) | 1 (2.0) | |
| Gender | 0.35 | ||
| Male | 33 (61.1) | 37 (74.0) | |
| Female | 18 (33.3) | 10 (20.0) | |
| Missing/not specified | 3 (5.55) | 3 (6.0) | |
| Age | 0.70 | ||
| 18–25 | 1 (1.85) | 2 (4.0) | |
| 26–35 | 3 (5.55) | 4 (8.0) | |
| 36–45 | 13 (24.1) | 17 (34.0) | |
| 46–55 | 24 (44.4) | 15 (30.0) | |
| >55 | 9 (16.7) | 8 (16.0) | |
| Missing/not specified | 4 (7.41) | 4 (8.0) | |
| Race | 0.40 | ||
| White | 42 (77.8) | 37 (74.0) | |
| Black/African American | 2 (3.7) | 1 (2.0) | |
| Other | 2 (3.7) | 0 (0.0) | |
| Missing/not specified/unknown | 8 (14.8) | 12 (24.0) | |
| Ethnicity | 0.30 | ||
| Hispanic | 0 (0.0) | 0 (0.0) | |
| Non-Hispanic | 47 (87.0) | 39 (78.0) | |
| Not specified/unknown | 7 (13.0) | 11 (22.0) | |
| Years worked at current role | 0.52 | ||
| <1 | 1 (1.9) | 0 (0.0) | |
| 1–5 | 8 (14.8) | 11 (22.0) | |
| 6–10 | 8 (14.8) | 9 (18.0) | |
| >10 | 37 (68.5) | 29 (58.0) | |
| Missing | 0 (0.0) | 1 (2.0) |
aP-values calculated using Fisher's exact test.
bPhysician's assistant, perfusionist, intern/resident/fellow.
Differences before and after SSC implementation
As shown in Table 3, there was no statistically significant difference in the proportion of positive and negative comments by theme made before and after SSC implementation. Figures 1 and 2 compare the distribution of all positive comments (n = 34) and negative comments (n = 92), respectively, by theme before and after SSC implementation. Post-implementation, there was a statistically significant difference in the distribution of negative comments by theme (P = 0.006); for example, there were more negative comments about checklist buy-in after implementation (51%) than before implementation (24%). While there were more positive comments about the checklist's quality and effectiveness after implementation (72%) than before (25%), the difference was not statistically significant (P = 0.17).
Positive and negative survey comments before and after implementation of the SSC by theme, N = 11 hospitals (all percentages are across rows)
| Before SSC implementation | After SSC implementation | ||||
|---|---|---|---|---|---|
| Positive | Negative | Positive | Negative | P-valuea | |
| N (%) | N (%) | N (%) | N (%) | ||
| Checklist buy-in | 3 (18.8%) | 13 (81.3%) | 1 (4.8%) | 20 (95.2%) | 0.30 |
| Team communication and coordination | 4 (40%) | 6 (60%) | 1 (20%) | 4 (80%) | 0.60 |
| Quality and effectiveness of the checklist | 5 (62.5%) | 3 (37.5%) | 10 (58.8%) | 7 (41.2%) | 0.99 |
| Patient safety climate | 5 (55.6%) | 4 (44.4%) | 1 (25%) | 3 (75%) | 0.56 |
| Freedom to speak up | 1 (16.7%) | 5 (83.3%) | 0 (0.0) | 0 (0.0) | b |
| Leadership support | 1 (14.3%) | 6 (85.7%) | 0 (0.0) | 0 (0.0) | b |
| OR logistics and equipment issues | 0 (0) | 5 (100%) | 0 (0.0) | 0 (0.0) | b |
| Turnover and time considerations | 0 (0) | 4 (100%) | 0 (0.0) | 0 (0.0) | b |
| Perceived hierarchy | 0 (0) | 3 (100%) | 0 (0.0) | 2 (100%) | b |
| Staffing issues | 0 (0) | 2 (100%) | 0 (0.0) | 1 (100%) | b |
| Otherc | 1 (33.3%) | 2 (66.7%) | 1 (33.3%) | 2 (66.7%) | 0.99 |
aP-values calculated using Fisher's exact test to evaluate if the distribution of positive versus negative comments differed in the post versus pre SSC implementation surveys for each theme.
bStatistical test could not be performed due to zero values.
cIncludes influence of an individual, staff awareness of checklist and education.
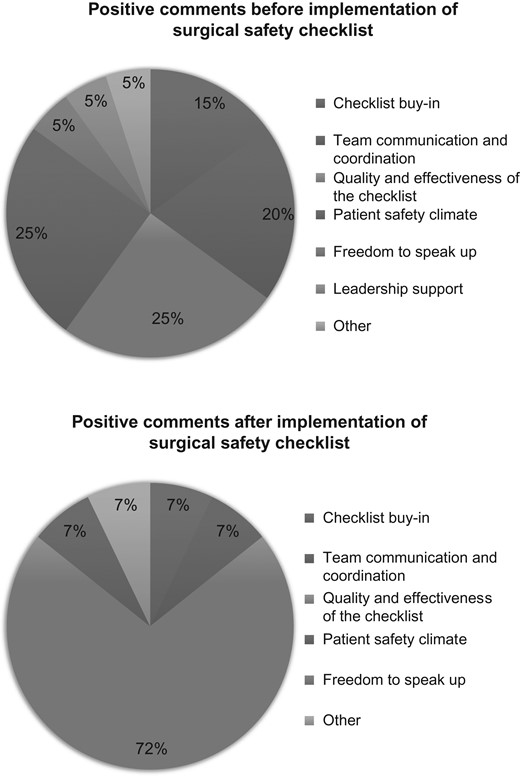
Distribution of all positive comments before and after implementation P = 0.1689. P-values were calculated using Fisher's exact tests to evaluate if the proportion of all positive comments and then all negative comments differed from pre-implementation to post-implementation.
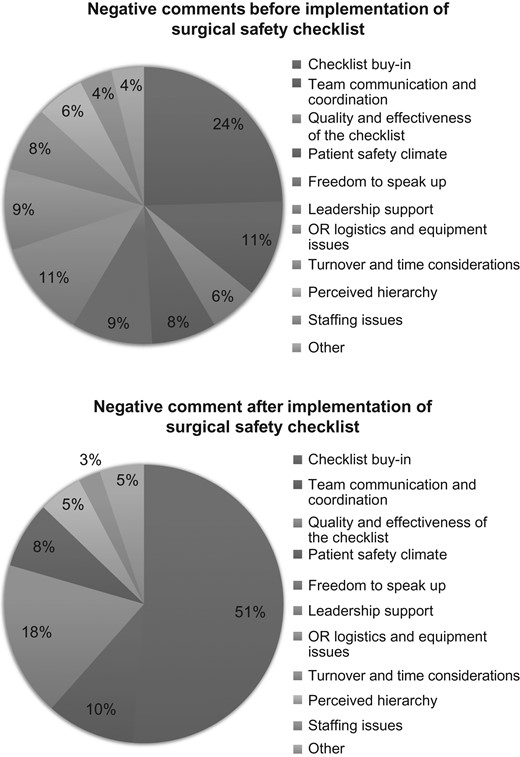
Distribution of all negative comments before and after implementation P = 0.0056. P-values were calculated using Fisher's exact tests to evaluate if the proportion of all positive comments and then all negative comments differed from pre-implementation to post-implementation.
Differences before and after SSC implementation by provider role
Table 4 shows the positive and negative comments both before and after SSC implementation by professional role. Before implementation, there was a statistically significant difference by role (P = 0.04), with a greater proportion of negative comments by physicians and advanced practice clinicians (87.9%) compared to other surgical team members (58.3–60.9%); however, after SSC implementation, the differences in positive versus negative comments by professional roles did not differ significantly (P = 0.52).
Positive and negative survey comments before and after implementation of the SSC by provider role, N = 11 (all percentages are across rows)
| Before SSC implementation | After SSC implementation | ||||||
|---|---|---|---|---|---|---|---|
| Positive N (%) | Negative N (%) | P-valuea | Positive N (%) | Negative N (%) | P-valueb | P-valuec | |
| All respondents | 20 (27.4%) | 53 (72.6%) | 14 (26.4%) | 39 (73.6%) | 0.99 | ||
| Specific provider role | 0.04 | 0.52 | |||||
| Physicians and advanced practice clinicians | 4 (12.1%) | 29 (87.9%) | 4 (22.2%) | 14 (77.8%) | 0.43 | ||
| Surgical nurses | 9 (39.1%) | 14 (60.9%) | 6 (23.1%) | 20 (76.9%) | 0.35 | ||
| Technicians | 2 (40.0%) | 3 (60.0%) | 2 (40.0%) | 3 (60.0%) | 0.99 | ||
| Other | 5 (41.7%) | 7 (58.3%) | 2 (50.0%) | 2 (50.0%) | 0.99 | ||
aP-values are calculated using Fisher's exact test to evaluate if the proportion of positive and negative comments significantly differed by professional role before SSC implementation survey.
bP-values are calculated using Fisher's exact test to evaluate if the proportion of positive and negative comments significantly differed by professional role after SSC implementation survey.
cP-values are calculated using Fisher's exact test to evaluate if the proportion of positive and negative comments differed after SSC implementation compared to the before SSC implementation survey by each of the professional roles.
Qualitative analysis of free-text comments before and after SSC implementation
Checklist buy-in
Buy-in of the checklist refers to the surgical team supporting the checklist process and committing to the difficult work of implementing the checklist. An example of a positive comment on checklist buy-in was ‘We have improved in every way due to the checklist’ while a negative comment was ‘The OR staff and surgeons have been very resistant to implementing a SSC. Surgeons leaving the room to scrub say, “Make sure the checklist is done when I get back”’. Comments made before implementation addressed the lack of buy-in by OR team members, particularly by surgeons. Reasons included an overly long checklist, a belief that providers were already doing a good job, and a view that the checklist did not apply to their particular context.
Concerns about buy-in persisted after SSC implementation. There were no comments about the checklist being too long and cumbersome, but other reasons remained the same.
Team communication and coordination
Before implementation, respondents indicated the need for more surgical teamwork, and some respondents felt the checklist would promote communication and coordination. The most common negative comment was that teams were siloed, which affected communication and coordination. Teamwork training was frequently suggested.
After implementation, respondents still cited the need for better communication and coordination, but remarked less on siloed communication. The nature of the positive comments remained—that the SSC promoted communication and coordination among OR personnel.
Patient safety climate
Before implementation, about half the respondents indicated that their surgical departments placed an emphasis on patient safety. The rest indicated that their organizations had a weak safety climate, identifying issues with OR efficiency, late start times, staff turnover, laziness and workplace apathy. They also discussed the consequences of a negative safety climate, including a tendency to deflect rather than address problems.
After implementation, respondents still discussed negative climates, making statements about the low prioritization of SSC implementation and the focus on pleasing providers rather than patients. There was one positive comment about how the institutional climate promoted SSC implementation, although debriefing was often missed.
Quality and effectiveness of the checklist
Before SSC implementation, there were equal numbers of negative and positive comments on checklist quality and effectiveness. Related comments were often tied to other themes, with some respondents expressing concerns about not being given a rationale for the SSC and the lack of training to implement it effectively. The majority of negative comments, however, referred to the checklist's quality, specifically its length.
After implementation, there were many more positive comments about the potential of the SSC to improve safety by ensuring one final check and focusing on the patient rather than the procedure. One respondent commented, ‘Time out I feel is the most significant change we have seen in the OR in recent years. It is a great time to discuss risks, possible complications, and expected outcomes. It is a time for everyone to focus on the plan and to bring to light issues that not everyone is aware of.’
Turnover and time considerations
Before implementation, all time-related comments were negative. Respondents remarked on the pressure to quickly turnover the OR and on the protocols that extended OR times without perceived benefit or hospital support, both of which they felt came at the expense of patient safety and a reasonable work environment. One respondent commented, ‘We are constantly pushed to hurry. I believe we are now surpassing a safe operating speed for patient safety’. There were no comments related to turnover after implementation.
Leadership support
Most pre-implementation comments about departmental and hospital-level leadership on surgical practice safety were negative. Respondents identified the need for greater leadership support in implementing the checklist through improved communication, a formal rollout of the timeout policy, and more OR observation by nursing management. There were no comments about leadership support after implementation.
OR logistics and equipment
All pre-implementation comments related to OR equipment and logistics were negative, with most being about physical disorganization, time wasted looking for equipment, and the lack of a sterile environment. One respondent stated that this created a safety hazard: ‘Rooms set up backwards, always tripping over equipment and cords, dangerous to all’. Respondents also discussed management and personnel disorganization, including problems with the timing and scheduling of surgeries, incomplete charts and OR team members having to be paged to complete their assessments and paperwork. There were no comments about equipment and logistics after implementation.
Freedom to speak up
Before implementation, surgical staff members expressed mostly negative opinions about their ability to voice opinions about surgical safety without facing a hostile environment. One respondent commented, ‘If it [a protocol lapse] is reported, the person gets designated on the ‘hit list’ as we call it; they try to get rid of you. The hospital promises there will be no repercussions, but there are’. There were no such comments after SSC implementation.
Perceived hierarchy
All pre-implementation comments about hierarchies were negative. Comments reflected a perceived hierarchy, where an individual, such as the surgeon, might influence other team members. Concerns included the lack of inter-professional teamwork, senior members tolerating disruptive behavior and a lack of respect for nursing input. Responses highlighted a poor work culture characterized by stress and medical errors as consequences of perceived hierarchies.
After implementation, all related comments were again negative, with ongoing comments about the lack of respect for nursing input, particularly with respect to SSC implementation.
Staffing issues
All pre-implementation OR staffing comments were negative. Concerns included understaffing and high turnover, which compromised patient safety. There was only one comment related to staffing after implementation, and it concerned high OR personnel turnover.
Complications averted
There were 132 post-implementation comments about how the SSC helped avert problems or complications (Fig. 3). These comments comprised 10 themes: antibiotics, equipment, wrong side/wrong site, medication errors, medication allergies, blood products, consent, other, wrong patient/procedure and no improvements. The three most frequent comments were about how the SSC helped ensure correct administration (availability, proper timing and dosing) of antibiotics prior to skin incision, the proper use and availability of surgical equipment, and the prevention of wrong site or wrong side procedures.
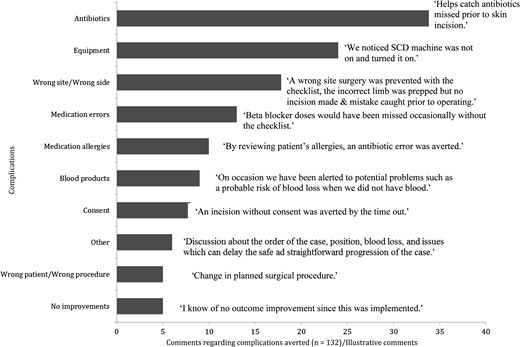
Complication averted by the SSC.
Discussion
We studied narrative feedback from a surgical safety climate survey completed by South Carolina hospitals before and after SSC implementation. Previous analysis of the survey's quantitative items found respondents generally had better attitudes toward teamwork post- implementation [27]. A majority of OR personnel also agreed that checklist use improved safe surgical practice, helped cases run more smoothly, and averted problems or complications [27]. Analysis of the narrative feedback affirmed that checklist use can avert complications and thus facilitate patient safety. While we also found more positive comments about the quality and effectiveness of the checklist after implementation, the difference did not reach statistical significance, possibly because of the small number of respondents providing narrative feedback. Ultimately, the SSC should improve patient outcomes. A study examining the relationship between implementation of the SSC and mortality is currently underway [25].
Although the quantitative results suggested improvement across most survey domains, [27] qualitative responses highlighted persistent concerns with buy-in after SSC implementation. One explanation for the high number of buy-in concerns after implementation may be an increased awareness of the importance of buy-in to successful checklist implementation and about problems with current practice and safety culture. Other studies have also showed the challenges of provider buy-in when implementing strategies to improve quality [30]. More work needs to be done to mitigate negative perceptions about the SSC and promote buy-in. The literature and our experience with SSC implementation in various contexts suggest strategies: building a receptive implementation climate by recruiting a multidisciplinary team; adapting the SSC to fit the local context [31]; promoting dry runs through simulation and providing opportunities for reflection [17]; enlisting clinical champions to compellingly explain the rationale for using a checklist and show how to use it [10]; monitoring checklist use and providing feedback [32] and demonstrating leadership support for the checklist [33].
Qualitative analysis of free-text comments showed that concerns about checklist buy-in, team communication and coordination, patient safety climate, checklist quality and effectiveness of the checklist, perceived hierarchy, and staffing persisted after implementation, suggesting that more work is needed to improve perceptions of surgical safety in these areas. Conversely, there were no comments about turnover and timing, leadership support, OR logistics and equipment or freedom to speak up after implementation. SSC implementation may have led to improvements in these areas or these issues may not have been the foremost concerns after implementation. These findings highlight that, although SSC implementation may have led to improvements during the limited time of this study, additional improvements may need more time to accrue.
An organization's awareness of its OR safety practices can be valuable to those seeking to implement a SSC. For example, application of a patient safety framework facilitated an understanding of the most common incidents by clinicians in the surgical care of abdominal organ transplantation of patients [34]. Administering a safety climate survey prior to SSC initiation may help in planning effective implementation. For example, there were a number of comments about the lack of sufficient turnover time. Leaders can enhance checklist use by considering more turnover time and relaxing performance expectations while providers are learning how to implement the SSC [35].
Surveys that request open-ended comments provide a unique opportunity to learn about unforeseen issues that may not have been addressed by close-ended items. Most comments in this study were negative, consistent with the literature on open-ended survey questions [23]. By strategically designing open-ended questions that solicit positive and neutral as well as negative comments, researchers could capture broader feedback in the future.
Our study has limitations. First, although there was a reasonable survey response rate, there were relatively few free-text responses. Some results showed large differences but were not statistically significant. Second, the self-selected respondents who provided free-text comments may bias results and not fully represent the views of the survey population, since individuals with strong opinions may be more likely to respond. However, such motivated individuals are often either champions for or strong opponents to quality improvement initiatives. Their comments may be informative for understanding the perspectives of OR personnel who play key roles in implementation, or in convincing others of the value of initiatives. Third, the study involved only South Carolina hospitals; the results may not generalize to hospitals in other states. Finally, because comments were anonymous, we were unable to measure within-person change over time.
Despite these limitations, our analysis of >100 open-ended responses reflects a belief that comments by OR personnel who have made the effort to convey their thoughts and concerns are worthy of consideration. As demonstrated by the identification of recurrent themes, such comments can provide valuable insight into the mindset of surgical team members, whose powerful words can be used to motivate change or adherence. Developing strategies that address free-text responses in surveys administered before and after SSC implementation may improve the adoption and efficacy of safety measures, including the SSC.
Acknowledgements
We would like to thank survey respondents for their feedback, Christina Smiraglia for her editing assistance and Blake Barr for his assistance with coding the data.
Funding
This work was supported by a grant from the Agency for Healthcare Research and Quality (AHRQ) (Grant number: R18:HS019631).
References
Safe Surgery Checklist Implementation Guide. Boston: Ariadne Labs, 2015. Available on www.SafeSurgery2015.org.
Appendix
Characteristics of hospitals that provided free response data compared to the remaining hospitals in South Carolina that did not
| Characteristics | Hospitals that provided free response data (N = 7)a | All other hospitals (N = 27) | P-valueb |
|---|---|---|---|
| (N, %) | (N, %) | ||
| Location | 0.40 | ||
| Rural | 2 (28.6) | 15 (55.6) | |
| Urban | 5 (71.4) | 12 (44.4) | |
| Teaching status | 0.13 | ||
| No | 4 (57.1) | 23 (85.2) | |
| Yes | 3 (42.9) | 4 (14.8) | |
| Number of bedsc | 0.32 | ||
| 0–269 | 3 (42.9) | 19 (70.4) | |
| 270–453 | 2 (28.6) | 4(18.5) | |
| ≥454 | 2 (28.6) | 3 (11.1) |
aThree hospitals that provided observation data fell within the same health system, and were counted as one hospital for the outcomes analysis. There were two hospitals that provided free responses for which we did not have any hospital-level data.
bFisher's exact test used to compare categorical groups.
cNumber of licensed hospital beds based on data from 2012.
| Characteristics | Hospitals that provided free response data (N = 7)a | All other hospitals (N = 27) | P-valueb |
|---|---|---|---|
| (N, %) | (N, %) | ||
| Location | 0.40 | ||
| Rural | 2 (28.6) | 15 (55.6) | |
| Urban | 5 (71.4) | 12 (44.4) | |
| Teaching status | 0.13 | ||
| No | 4 (57.1) | 23 (85.2) | |
| Yes | 3 (42.9) | 4 (14.8) | |
| Number of bedsc | 0.32 | ||
| 0–269 | 3 (42.9) | 19 (70.4) | |
| 270–453 | 2 (28.6) | 4(18.5) | |
| ≥454 | 2 (28.6) | 3 (11.1) |
aThree hospitals that provided observation data fell within the same health system, and were counted as one hospital for the outcomes analysis. There were two hospitals that provided free responses for which we did not have any hospital-level data.
bFisher's exact test used to compare categorical groups.
cNumber of licensed hospital beds based on data from 2012.
Author notes
Shared first authorship.
