


Abstract
Objective: Our aim was to study the correlation between plasma transforming growth factor (TGF)-β1 level and radiation-induced mucositis and dermatitis in nasopharyngeal carcinoma (NPC) patients.
Methods: Blood samples obtained from patients treated with concurrent chemo-radiotherapy (CCRT) were divided into two groups according to the pre-treatment plasma TGF-β1 level (≥7.5 ng/ml as group 1 and <7.5 ng/ml as group 2). Enzyme-linked immunosorbent assay (ELISA) was used for the measurement of the TGF-β1 level. Radiation toxicity was evaluated according to Radiation Treatment Oncology Group criteria. Data were analyzed by the generalized estimation equation method.
Results: TGF-β1 levels of group 1 patients were decreased significantly (P = 0.002) at the end of the treatment. The rate of decrease was 0.12 ng/ml per fraction (P = 0.02). The average TGF-β1 level in patients who suffered acute radiation morbidity (grade ≥2) was significantly higher (P = 0.0057) than that of those who suffered less (grade <2).
Conclusion: A lower pre-treatment plasma TGF-β1 level and the grade of radiation toxicity both appeared to contribute to the elevated plasma TGF-β1 after CCRT.
INTRODUCTION
Nasopharyngeal carcinoma (NPC) is a malignant tumor of the nasopharyngeal epithelium which is ranked 8th and 11th in cancer mortality among males and females, respectively, in Taiwan (1). Since surgical resection of NPC with an acceptable margin is very difficult, radiotherapy (RT) with or without chemotherapy remains the treatment of choice (2). The main goal of anticancer treatment is to obtain maximal curability and minimal toxicity, but the normal tissue tolerance to the treatment usually limits the intensity of treatment (3). Optimal irradiation for NPC involves large fields and high doses. Therefore, significant sequelae and side effects including radiation dermatitis and mucositis are to be expected, which may lead to discontinuation of treatment and the resultant poor outcome. Many studies have been performed to determine the probability of normal tissue injury related to radiation dose and volume irradiated (4). However, the dosage estimation of normal tissue tolerance for both chemotherapy and radiotherapy was based on the risk factors for the population as a whole, and not individualized. In addition, some important biological factors, transforming growth factor-1β (TGF-β1) in particular, also need to be taken into consideration, which has been implicated in the development of normal tissue injury after cancer therapy.
TGF-β1 plays an important role in regulating repair and regeneration following normal tissue injury. Recent evidence suggests that TGF-β1 mediates the fibrogenic response of normal tissue injury to therapy, and the molecular events involved in this process begin at the time of treatment (5). The plasma level of TGF-β1 has been reported as a useful predictor to identify lung cancer patients at risk for normal tissue injury after therapy (6,7). Thus, monitoring changes in the plasma TGF-β1 level during cancer treatment may allow physicians to adjust the therapy strategy to enhance tumor cure while minimizing the risk of normal tissue toxicity (7). Many malignant tumors secrete TGF-β1, such as lung cancer, hepatoma, breast cancer (8) and Epstein–Barr virus (EBV)-associated NPC (9). In this study, we suggest that the damaged normal tissues other than tumor itself also contribute to higher levels of plasma TGF-β1. The plasma TGF-β1 level may thus be useful as a biomarker for the follow-up of NPC treatment.
PATIENTS AND METHODS
Patients
During 2001–2002, 18 NPC patients treated at Mackay Memorial Hospital, Taipei, Taiwan, were enrolled in the prospective study to determine the role of TGF-β1 in radiation-induced dermatitis and/or mucositis. The present analysis includes only patients who had provided written informed consent before the enrollment and were treated with a curative intent. The patients were classified into different tumor stages based on tumor size (T), lymph node involvement (N) and presence of distant metastasis (M), following the cancer staging manual of the American Joint Committee on Cancer (AJCC) version 5.0 in 1997. All of these patients had received chemo-radiotherapy (CCRT). The administration of CCRT was as follows: radiotherapy was administered five times a week with 1.8 Gy/fraction of photon beam using a 6 MV linear accelerator. Using the bilateral opposing portal irradiation method, 40–45 Gy was initially irradiated to the nasopharynx and the middle cervical lymph nodes, whereas another 50–65 Gy was irradiated to the lower cervical lymphatics and the supraclavicular fossa using the anterior single irradiation port. The field size was then decreased to spare the spinal cord and further irradiated with the three-dimensional conformal RT technique to a total irradiated dose ranging from 60 to 70 Gy. Cisplatin was administered at 30 mg/m2/day once per week for 6–7 cycles during RT or at 20 mg/m2/day combined with 5-fluorouracil at 1000 mg/m2/day for 5 days every 4 weeks for two cycles during RT.
Blood samples were collected by venopuncture from patients immediately before the first fraction of RT and at the end of the RT course. Plasma TGF-β1 levels during the period of RT were also measured several times as needed.
TGF-β1 Analysis
All blood samples were collected in 5 ml vacuum tubes containing EDTA and centrifuged at 3000 g at 4°C for 30 min to insure that platelets are removed from the plasma. Only the top 1 ml of platelet-free plasma was used to assay for TGF-β1 concentration. All the centrifuged platelet-free plasma samples were kept frozen at −80°C until assayed. The samples were first acid treated and neutralized for determination of the total TGF-β1. The plasma TGF-β1 level was measured with enzyme-linked immunosorbent assay (ELISA) kits (R&D Systems, Minneapolis, MN) of antibody sandwich format as described previously (10). The first antibody used to coat the plates (capture antibody) is a monoclonal antibody 12H5 that binds to TGF-β1. Another monoclonal antibody 4A11 was used as the detection antibody. Streptavidin-conjugated horseradish peroxidase (HRP) was used as the secondary antibody; H2O2 mixed with tetramethylbenzidine was the substrate.
The 96-well microtiter plates were applied to an automatic plate reader to measure the absorbance at 450 nm using 540 nm as wavelength correction. The TGF-β1 level was assayed by comparing the peroxidase activity in wells containing known amounts of purified TGF-β1 (R&D Systems, Minneapolis, MN) with the activity in the wells containing the patient's plasma. Known amounts of purified TGF-β1 were used as a standard for ELISA (R&D Systems, Minneapolis, MN). Samples were run in triplicate. Each assay was repeated to insure the absorbance values were within range of the detectable standard curve. Since the procedure could not distinguish between the active and latent forms of TGF-β1, the measured TGF-β1 level was referred to as the total TGF-β1. The lower detection limit of this assay was 2 ng/ml.
Evaluation of Treatment Response and Normal Tissue Toxicity
The remission range of the primary lesion in nasopharynx and the metastasis of cervical lymph nodes were evaluated by physical examination, pharyngeal fiberoptic endoscopy and computed tomography (CT) scan. CT scan was performed routinely after the cumulative radiation dose was >40 Gy for the purpose of conformal RT planning and initial assessment.
All patients were assessed weekly during the course of RT. Acute reactions and white blood cell (WBC) counts were also recorded. Acute radiation toxicities were graded according to the 1995 acute radiation morbidity scoring criteria of the Radiation Treatment Oncology Group (RTOG). Faint erythema or dry desquamation was recorded as grade 1. Moderate erythema or moist desquamation confined to skin folds and creases, moist desquamation other than skin folds and creases, skin necrosis or ulceration, and death related to the toxicity were recorded as grades 2, 3, 4 and 5, respectively. The tumor response definitions were based on the World Health Organization criteria: complete response (CR), the disappearance of all lesions; partial response (PR), at least a 50% decrease in the sum of the lesions.
Statistical Analysis
Patients were divided into two groups according to their pre-treatment TGF-β1 levels: ≥7.5 ng/ml as group 1; and <7.5 ng/ml as group 2. A value of 7.5 ng/ml of TGF-β1 is used as a cut-off point, which is 2 SDs above the mean level for normal controls (6,8). Paired t-test was used to compare the pre-treatment and the post-treatment TGF-β1 levels for both groups. To take into account the dependency of repeated measurements and to analyze the contribution of pre-treatment TGF-β1 level, grade of radiation toxicity, fraction number of irradiation and platelets to the changes of TGF-β1 level in NPC patients during CCRT, a generalized linear model for longitudinal data analysis, called the generalized estimation equation (GEE) method, was used (11,12).
RESULTS
From July 2000 to March 2002, 142 plasma samples from 18 NPC patients were collected, except for one patient who dropped out from the treatment after three fractions and another who died of hepatic failure after 30 fractions of irradiation. The rest completed CCRT and either partial or complete remission was obtained. Table 1 shows the stages, TGF-β1 level, toxicity and treatment response of patients. Most patients (12 out of 18) suffered from various degrees of radiation dermatitis and mucositis during the treatment.
Stages, TGF-β1 level, toxicity and treatment response of NPC patients
| Patients | Stage | Pre-treatment TGF-β1 level (ng/ml) | Post-treatment TGF-β1 level (ng/ml) | Toxicity before Tx | Toxicity after Tx | |||||
|---|---|---|---|---|---|---|---|---|---|---|
| Group 1 | ||||||||||
| 1 | T1N2bM0 | 26.252 | 4.013 | 0 | 0 | |||||
| 2 | T4N0M0 | 25.548 | 14.196 | 0 | 4 | |||||
| 3 | T3N2bM0 | 10.84 | 1.617 | 0 | 2 | |||||
| 6 | T2N1M0 | 8.246 | 1.76 | 0 | 0 | |||||
| 7 | T1N3M0 | 17.649 | 16.5 | 0 | 1 | |||||
| 10 | T2N2bM0 | 15.125 | 8.569 | 0 | 0 | |||||
| 12 | T1N0M1 | 11.994 | 3.527 | 0 | 0 | |||||
| 13 | T3N2bM0 | 10.959 | 3.296 | 0 | 1 | |||||
| 15 | T2N2bM0 | 15.046 | 3.295 | 0 | 1 | |||||
| 16 | T3N0M1 | 30.44 | 6.599 | 0 | 1 | |||||
| 17 | T4N2bM1 | 12.316 | 6.602 | 0 | 1 | |||||
| 18 | T2N2bM0 | 14.313 | 5.552 | 0 | 0 | |||||
| Average ± SE | 16.561 ± 7.071 | 6.299 ± 4.734 | ||||||||
| Group 2 | ||||||||||
| 4 | T4N0M0 | 2.293 | 6.636 | 0 | 2 | |||||
| 5 | T3N2cM0 | 6.119 | 8.722 | 0 | 1 | |||||
| 8 | T2N2bM1 | 6.586 | 9.519 | 4 | 4 | |||||
| 9 | T1N0M0 | 6.288 | 15.438 | 0 | 2 | |||||
| 11 | T4N1M0 | 5.558 | 8.749 | 0 | 2 | |||||
| 14 | Recurrent | 2.561 | 3.657 | 0 | 0 | |||||
| Average ± SE | 4.901 ± 1.947 | 6.154 ± 1.633 | ||||||||
NPC patients were divided into two groups: those whose pre-treatment TGF-β1 level was ≥7.5 ng/ml were assigned as group 1 (n = 12), while those with a pre-treatment TGF-β1 level of <7.5 ng/ml were assigned as group 2 (n = 6). Figure 1 shows the data of plasma TGF-β1 levels of all fractions from 18 patients except the one dropped out and the other who died during the treatment. About eight samples were examined for each patient. The plasma TGF-β1 levels of group 1 patients decreased significantly during the treatment as seen by the solid regression line running downwards steeply. On the contrary, the plasma TGF-β1 levels of the group 2 patients were elevated at the end of the treatment as shown by the broken regression line running upwards gradually. The results of the corresponding quantitative comparisons are shown in Table 2, where the means ± SE of TGF-β1 levels in the two groups of NPC patients are presented.
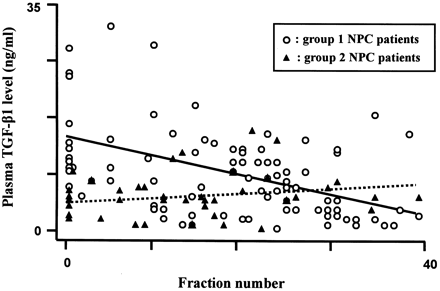
Plasma TGF-β1 level as a function of fraction number. The regression line of group 1 NPC patients, shown as the solid line, indicates that the plasma TGF-β1 level was decreased significantly throughout the treatment, but was only gradually increased for group 2 NPC patients (dashed line).
TGF-β1 levels of groups 1 and 2 NPC patients before and after CCRT
| Patients | No. of patients | Pre-treatment TGF-β1 level (mean ± SE) | Post-treatment TGF-β1 level (mean ± SE) | Paired t-test (P-value) |
|---|---|---|---|---|
| Group 1 | 12 | 16.561 ± 7.071 | 6.299 ± 4.734 | 5.309 (<0.001) |
| Group 2 | 6 | 4.901 ± 1.947 | 6.154 ± 1.633 | −1.605 (0.169) |
| Patients | No. of patients | Pre-treatment TGF-β1 level (mean ± SE) | Post-treatment TGF-β1 level (mean ± SE) | Paired t-test (P-value) |
|---|---|---|---|---|
| Group 1 | 12 | 16.561 ± 7.071 | 6.299 ± 4.734 | 5.309 (<0.001) |
| Group 2 | 6 | 4.901 ± 1.947 | 6.154 ± 1.633 | −1.605 (0.169) |
To determine whether the plasma TGF-β1 levels were influenced more either by tumor or by normal tissue injury, the GEE method was used to fit a generalized linear model for longitudinal data to establish a relationship among several parameters. As shown in Table 3, the pre-treatment TGF-β1 level, radiation toxicity, fraction numbers and platelet numbers exhibited statistically significant contributions to the increase of the plasma TGF-β1 level. In addition, the plasma TGF-β1 level was decreased significantly during RT by ∼0.12 ng/ml per fraction (P = 0.0212).
Effects of TGF-β1 level, grade of radiation toxicity and fraction number on the change of TGF-β1 level in NPC patients
| Parameter | Estimate ± SE | 95% Confidence limits | Z | P-values |
|---|---|---|---|---|
| Group 2 versus group 1 | −4.6118 ± 1.2221 | −7.0070 to –2.2166 | −3.77 | 0.0002 |
| Grade ≥2 versus grade <2 | 2.2444 ± 0.8125 | 0.6521 to 3.8368 | 2.76 | 0.0057 |
| WBC | −0.0061 ± 0.1124 | −0.2263 to 0.2141 | −0.05 | 0.9569 |
| Fraction number | −0.1217 ± 0.0528 | −0.2252 to –0.0182 | −2.30 | 0.0212 |
| Platelet | 0.0248 ± 0.0055 | 0.0140 to 0.0356 | 4.50 | <0.0001 |
Data were statistically evaluated with a generalized estimation equation (GEE) method.
DISCUSSION
TGF-β1 orchestrates cell type-specific regulation of cell cycle, growth, differentiation and death via ubiquitous cell surface receptors in autocrine, paracrine and endocrine manners (8). It is secreted as an inactive latent complex, but is bound to the latency-associated protein (LAP) and the latent TGF-β-binding protein (LTBP), and circulates in an inactive form in plasma. After latent TGF-β1 is activated, it binds to α2 macroglobulin. Thus, α2 macroglobulin acts as a scavenger of active TGF-β. In plasma, TGF-β may be present as complexes with LAP and LTBP as well as α2 macroglobulin (13). The activation of TGF-β1 is facilitated by the bindng of the TGF-β1 latent complex to the growth factor receptors in cell membranes followed by a specific signal transduction pathway in the cell (14). The biological responses of TGF-β1 are mediated through its binding to three distinct types of receptors. Since TGF-β1 is produced by almost every cell in the body and can also be secreted by many tumor cells, most TGF-β1 shows both local and systemic effects (15).
In normal cells, TGF-β1 is bifunctional as it plays a central role in repair of tissue damage as well as fibrogenesis formation (5). On the other hand, the autocrine and paracrine effects of TGF-β1 on tumor cells and the tumor micro-environment exert both positive and negative influences on cancer development. Accordingly, the TGF-β1 signaling pathway has been considered as both a suppressor and promoter pathway for development, progression and invasion of tumors (16–18). It acts early in carcinogenesis as a tumor suppressor, but later it plays the role of stimulator for tumor invasion by promoting extracellular matrix production and angiogenesis, stimulating tumor proliferation and inhibiting host immune functions (19).
On the other hand, TGF-β1 in vivo seems to play a key role in orchestrating the response to tissue injury, particularly in the epidermis and other epithelial tissues. Conversely, disruptions of the TGF-β signaling pathway seem to play an important role in cancer development. For example, the fact that most malignant cell lines are refractory to TGF-β-dependent growth inhibition suggests that a key step in malignant transformation for a cell is to escape from the cell cycle control mediated by TGF-β. The biological effects of TGF-β are mediated primarily by two independent and interacting serine/threonine kinase receptors (TGF-β type I and II receptors). TGF-β type I receptor (TbR-I) binds to specific ligands only in the presence of the TGF-β type II receptor (TbR-II), and the latter requires the former in order to transmit the signal (20). When and how the TGF-β signaling is disrupted in tumors, however, remains unclear.
In addition, TGF-β1 is often overexpressed locally in many tumors, and its plasma level is also increased in cancer patients, for example breast cancer, Hodgkin's lymphoma, cervical cancer, hepatocellular carcinoma and prostate carcinoma (21–24). In breast cancer patients, the elevated TGF-β1 will return to normal levels after tumor debulking, but will be persistently elevated if any residual disease persists (25).
TGF-β1 in EBV-associated NPC patients appears to be secreted and activated more rapidly compared with that of healthy EBV-seropositive individuals (9). Many studies showed that the higher TGF-β1 levels might occur due both to its secretion from tumor cells and to EBV infection, which is known to enhance TGF-β1 secretion (26,27). Though TGF-β1 inhibits the growth of epithelial cells and several other cell types, it is thought to play a role in tumor transformation, progression and metastases (28). Several tumors can escape from the growth-inhibitory effects of TGF-β1 due to mutated and non-functional TbR-IIs, or due to a mutated component of the TGF-β1 signaling pathway (29–31). It is not clear how NPC escapes from the mitotic inhibitory effects of TGF-β1. Elevated serum TGF-β1 levels in EBV-associated NPC patients have a correlation with different tumor stages and clinical conditions (9).
The biological activity of TGF-β is restrained by its secretion as a latent complex such that activation determines the extent of TGF-β activity during physiological and pathological events. TGF-β action has been implicated in a variety of reactive oxygen-mediated tissue processes, particularly inflammation, and in pathological processses such as reperfusion injury, rheumatoid arthritis and atherosclerosis. It was reported to be rapidly activated after radiation exposure in vivo, which also generates reactive oxygen species, as a 26% induced activation of latent TGF-β after irradiation of 100 Gy compared with that elicited by standard thermal activation, which was caused by oxidation of specific amino acids in the latency-conferring peptide leading to a conformation change in the latent complex that allows release of TGF-β (32–34). In addition to irradiation, latent TGF-β1 activation can occur via free radical generation by other sources. DNA-damaging agents can induce TGF-β1 activation, including PALA (27), cisplatin (35) and alkylating agents (36).
In this study, we found that some NPC patients did show a higher plasma TGF-β1 concentration, which was decreased significantly during treatment. The higher pre-treatment TGF-β1 concentration in group 1 patients suggests that those tumor cells appear to secrete TGF-β1 in plasma, and the decreased concentration of TGF-β1 during treatment may be a reflection of tumor cell killing. Though the pre-treatment TGF-β1 level and platelets had the greater impact on the change of the plasma TGF-β1 level, both the radiation toxicity and fraction numbers also contributed significantly to the elevated plasma TGF-β1 level (Table 3). The result explains why patients in group 1 still suffered from radiation dermatitis and mucositis, even though their TGF-β1 level decreased at the end of treatment.
TGF-β1 is also involved in many intracellular events which take place in tissue repair after injury. Platelets contain high concentrations of TGF-β1 and release this cytokine into the surrounding tissue at the site of injury through degranulation. This explains the reason why the platelet numbers correlated significantly with the plasma TGF-β1 levels in this study. TGF-β1 then initiates a complex sequence of events that promotes healing, including: chemoattraction of monocytes and leukocytes; induction of angiogenesis; and control of the production of cytokines and other inflammatory mediators (37). The response of TGF-β1 to injury involves autoinduction of TGF-β1 production followed by the increased deposition of extracellular matrix. As a result, the plasma TGF-β1 level will be elevated after tissue injury. The implication of TGF-β1 in the prognosis of normal tissue injury after irradiation has been reported (4,38). Pre-treatment plasma TGF-β1 levels can be used to predict the propensity to develop normal tissue injury following anti-cancer treatment in some cancer patients, such as those with lung and breast cancers. In lung cancers, the plasma TGF-β1 level is a useful biomarker to identify which patient is at risk for the development of pneumonitis from thoracic irradiation (2). Our result showed that the plasma TGF-β1 level was significantly elevated if the radiation toxicity (i.e. radiation morbidity score ≥2) was severe. TGF-β1 levels in patients with lower values tended to be elevated at the end of treatment when normal tissue damage was severe, as shown in Table 3. The result suggests that the damaged normal tissues other than the tumor itself also contribute to the higher plasma TGF-β1 level. The plasma TGF-β1 level may be useful as a biomarker for the follow-up of NPC treatment.
This study was supported by a grant NSC 91-2623-7-010-005-NU from the National Science Council, Taipei, Taiwan.
References
Perez CA, Brady LW. Nasopharynx. Principles and Practice of Radiation Oncology. Vol. XXXV, 3rd edn. Philadelphia Lippincott-Raven;
Emami B, Lyman J, Brown A, Coia L, Goitein M, Munzenrider JE, et al. Tolerance of normal tissue to therapeutic irradiation.
Lyman JT, Wolbarst AB. Optimization of radiation therapy III: a method of assessing complication probabilities from dose–volume histograms.
Finkelstein JN, Johnston CJ, Baggs R, Rubin P. Early alterations in extracellular matrix and transforming growth factor β gene expression in mouse lung indicative of late radiation fibrosis.
Anscher MS, Kong FM, Andrews K, Clough R, Marks LB, Bentel G, et al. Plasma transforming growth factor beta1 as a predictor of radiation pneumonitis.
Anscher MS, Marks LB, Shafman TD, Clough R, Huang H, Tisch A, et al. Risk of long-term complications after TFG-beta1-guided very-high-dose thoracic radiotherapy.
Xu J, Menezes J, Prasad U, Ali A. Elevated serum levels of transforming growth factor β1 in Epstein–Barr virus-associated nasopharyngeal carcinoma patients.
Danielpour D. Improved sandwich enzyme-linked immunosorbent assays for transforming growth factor beta 1.
Liang KY, Zeger SL. Longitudinal data analysis using generalized linear models.
Zeger SL, Liang KY. Longitudinal data analysis for discrete and continuous outcomes.
Rifkin DB. Latent transforming growth factor-β binding proteins: orchestrators of TGF-β availability.
Shi Y, Massague J. Mechanisms of TGF-beta signaling from cell membrane to the nucleus.
Derynck R, Akhurst RJ, Balmain A. TGF-beta signaling in tumor suppression and cancer progression.
Massague J, Blain SW, Lo RS. TGF-β signaling in growth control, cancer, and heritable disorders.
Wakefield L, Roberts AB. TGF-β signaling: positive and negative effects on tumorigenesis.
Reiss M. Transforming growth factor-beta and cancer: a love–hate relationship?
Ebner R, Chen RH, Lawler S, Zioncheck T, Derynck R. Determination of type I receptor specificity by the type II receptors for TGF-beta or activin.
Ivanovic V, Todorovic-Rakovic N, Demajo M, Neskovic-Konstantinovic Z, Subota V, Ivanisevic-Milovanovic O, et al. Elevated plasma levels of transforming growth factor-beta 1 (TGF-beta 1) in patients with advanced breast cancer: association with disease progression.
Murase T, Jirtle RL, McDonald GB. Transforming growth factor-beta plasma concentrations in patients with leukemia and lymphoma receiving chemoradiotherapy and marrow transplantation.
Shariat SF, Shalev M, Menesses-Diaz A, Kim IY, Kattan MW, Wheeler TM, et al. Preoperative plasma levels of transforming growth factor beta1 strongly predict progression in patients undergoing radical prostatectomy.
Shirai Y, Kawata S, Tamura S, Ito N, Tsushima H, Takaishi K, et al. Plasma transforming growth factor-β1 in patients with hepatocellular carcinoma: comparison with chronic liver disease.
Kong FM, Anscher MS, Murase T, Abbott BD, Iglehart JD, Jirtle RL. Elevated plasma transforming growth factor-beta 1 levels in breast cancer patients decrease after surgical removal of the tumor.
Ahmad A, Menezes J. Binding of the Epstein–Barr virus to human platelets causes the release of transforming growth factor-beta.
Cayrol C, Flemington EK. Identification of cellular target genes of the Epstein–Barr virus transactivator Zta: activation of transforming growth factor beta igh3 (TGF-beta igh3) and TGF-beta 1.
Stavnezer J. Regulation of antibody production and class switching by TGF-beta.
De Souza AT, Hankins GR, Washington MK, Fine RL, Orton TC, Jirtle RL. Frequent loss of heterozygosity on 6q at the mannose 6-phosphate/insulin-like growth factor II receptor locus in human hepatocellular tumors.
Kadin ME, Cavaille-Coll MW, Gertz R, Massague J, Cheifetz S, George D. Loss of receptors for transforming growth factor beta in human T-cell malignancies.
Markowitz S, Wang J, Myeroff L, Parsons R, Sun L, Lutterbaugh J, et al. Inactivation of the type II TGF-beta receptor in colon cancer cells with microsatellite instability.
Barcellos-Hoff MH, Dix TA. Redox-mediated activation of latent transforming growth factor-β1.
Ehrhart EJ, Carroll A, Segarini P, Tsang M LS, Barcellos-Hoff MH. Latent transforming growth factor-β activation in situ: quantitative and functional evidence following low dose irradiation.
Ewan KB, Henshall-Powell RL, Ravani SA, Pajares MJ, Arteaga C, Warters R, et al. Transforming growth factor-beta1 mediates cellular response to DNA damage in situ.
Ohmori T, Yang JL, Price JO and Arteaga CL. Blockade of tumor cell transforming growth factor-βs enhances cell cycle progression and sensitizes human breast carcinoma cells to cytotoxic chemotherapy.
Yamada H, Vijayachandra K, Penner C, Glick A. Increased sensitivity of transforming growth factor (TGF) β1 null cells to alkylating agents reveals a novel link between TGFβ signaling and O6-methylguanine methyltransferase promoter hypermethylation.
Clark DA, Coker R. Transforming growth factor-beta (TGF-beta).
Author notes
1Institute of Radiological Sciences, National Yang-Ming University and Mackay Junior College of Nursing, 2Department of Radiation Oncology & Hospice Center, 4Department of Medical Oncology and 5Department of Otorhinolaryngology, Mackay Memorial Hospital, 3Department of Mathematics, Tamkang University, Tamsui, 6Institute of Nuclear Energy Research, Taoyuan and 7Department of Radiation Oncology, Taipei Veterans General Hospital, Taipei, Taiwan
