


Abstract
Background: A recent phase III trial showed that the addition of bevacizumab, a monoclonal antibody to vascular endothelial growth factor-A, to first-line irinotecan, 5-fluorouracil, and leucovorin (IFL) prolonged median survival in patients with metastatic colorectal cancer. We carried out a retrospective analysis of patients in the trial to evaluate whether mutation status of k-ras, b-raf, or p53 or P53 expression could predict which patients were more likely to respond to bevacizumab. Methods: Microdissected tumors from 295 patients (274 primary tumors, 21 metastases) were subject to DNA sequence analysis to identify mutations in k-ras, b-raf, and p53. Nuclear P53 expression was determined by immunohistochemistry. Hazard ratios and 95% confidence intervals (CI) for overall survival were estimated using Cox regression analysis. Results: In all biomarker subgroups, estimated hazard ratios for risk of death were less than 1 for bevacizumab-treated patients as compared with those for placebo-treated patients. Mutations in k-ras and/or b-raf were observed in 88 of 213 patients (41%). Hazard ratios for death among patients with tumors with wild-type k-ras/b-raf status, as compared with those of patients with mutations in one or both genes, were 0.51 (95% CI = 0.28 to 0.95) among those treated with IFL plus bevacizumab and 0.66 (95% CI = 0.37 to 1.18) among those treated with IFL plus placebo. Mutations in p53 were found in 139 of 205 patients (68%), and P53 was overexpressed in 191 of 266 patients (72%); neither p53 mutation nor P53 overexpression was statistically significantly associated with survival. Conclusions: We did not find a statistically significant relationship between mutations of k-ras, b-raf, or p53 and the increase in median survival associated with the addition of bevacizumab to IFL in metastatic colorectal cancer.
Vascular endothelial growth factor-A (VEGF) is a secreted ligand that binds to specific receptors expressed by angioblasts and endothelial cells ( 1 ) . VEGF is an important regulator of physiologic and pathologic angiogenesis and is overexpressed in a wide range of human malignancies ( 2 ) . Preclinical studies of a murine anti-human monoclonal antibody directed against VEGF have shown that this antibody inhibits the growth of human tumor xenografts ( 3 ) . Subsequently, the efficacy of a humanized variant of this antibody, bevacizumab (Avastin; Genentech, Inc., South San Francisco, CA), has been evaluated in clinical trials as a treatment for various cancers.
Recently, the addition of bevacizumab to a combination regimen of irinotecan, 5-fluorouracil, and leucovorin (IFL) was shown to meaningfully prolong the median survival in patients with metastatic colorectal cancer compared with that of patients who received the combination IFL regimen alone ( 4 ) . The findings from this phase III bevacizumab trial were considered pivotal for the treatment of metastatic colorectal cancer. Although this result demonstrates the general potential efficacy of antiangiogenic therapy, the identification of biomarkers that may predict which patients are most likely to respond to such treatment is of considerable interest.
Potential biomarkers include mutations in k-ras and b-raf, which result in constitutive signaling through the oncogenic Ras/Raf/Mek/Erk pathway ( 5 , 6 ) . Patients carrying tumors with k-ras mutations have been reported to have a poorer prognosis and a diminished response to adjuvant chemotherapy ( 7 – 14 ) . Ras/Raf/Mek/Erk pathway signaling has also been reported to increase expression of VEGF ( 15 – 17 ) and repress negative regulators of angiogenesis ( 18 ), suggesting that aberrations in k-ras and/or b-raf may influence the response to antiangiogenic therapy.
The p53 tumor suppressor gene is also frequently altered in colorectal cancer. Between 30% and 70% of colorectal malignancies have been reported to carry either a mutation in p53 and/or loss of heterozygosity at chromosome 17p, where p53 is located ( 5 , 19 , 20 ) . p53-null animal models have been shown to be resistant to cytotoxic chemotherapy ( 21 , 22 ) and less responsive than wild-type p53 models to antiangiogenic therapy ( 23 ) . Moreover, P53 dysfunction has also been associated with increased expression of VEGF ( 24 , 25 ) and decreased expression of negative regulators of angiogenesis ( 26 ) . In addition, p53 mutations and/or nuclear P53 expression have been found to have prognostic significance, both independently and in conjunction with assessments of k-ras status ( 7 , 10 , 11 , 27 ) .
These preclinical and clinical data indicate that mutations in the Ras/Raf/Mek/Erk pathway or inactivation of P53 may modify the efficacy of anti-VEGF therapies. Therefore, we investigated whether mutations in k-ras, b-raf, or p53 or P53 overexpression could identify patients with metastatic colorectal cancer who are more likely to respond to bevacizumab in terms of overall survival. A secondary aim was to explore the reported prognostic impact of these biomarkers, defined in terms of overall survival, irrespective of treatment received. For this study, we analyzed data on patients who had participated in the phase III trial of bevacizumab plus IFL for metastatic colorectal cancer ( 4 ) .
S UBJECTS AND M ETHODS
Patients and Study Design
Patient recruitment and trial design have been described elsewhere ( 4 ) . Briefly, previously untreated patients with metastatic colorectal cancer were randomly assigned to three arms: IFL with placebo, IFL with bevacizumab, or 5-fluorouracil and leucovorin with bevacizumab. At the time of enrollment, written informed consent was obtained from trial participants to permit research on their archived tissue. Survival analyses were restricted to tumor samples from patients in the treatment arms that received placebo plus IFL ( n = 411) or bevacizumab plus IFL ( n = 402).
Tissue Samples and Tissue Microarray Construction
Formalin-fixed, paraffin-embedded colorectal cancer tissue blocks and corresponding pathology reports were obtained for 295 of the 813 patients who participated in the bevacizumab trial from multiple centers. These samples included 21 metastases (one peritoneal, three omental, three lymph node, three lung, nine liver, and two ovarian) and 274 primary tumors. Tissue microarrays (TMAs) were assembled as described previously ( 28 ) . Core sampling was completed in triplicate to ensure that representative data were captured from the parent block ( 29 ) . Verification of histology was carried out on the first section cut from each array by hematoxylin and eosin (HE) staining. Sequencing and immunohistochemistry were performed as described below on TMAs for 240 patients and on whole sections for an additional 55 patients for whom tissue blocks were not available from the primary treatment centers.
Laser Capture Microdissection and Direct Sequencing of PCR Products
TMAs and whole tissue sections were deparaffinized and stained with HE. Between 100 and 1000 neoplastic cells were microdissected (PixCell II; Arcturus, Mountain View, CA) from each of the 295 tumor samples. Genomic DNA from the microdissected cells was extracted into a 20 μL volume using the Picopure DNA kit (Arcturus) according to the manufacturer's instructions. Exon 2 (coding exon 1) of k-ras (GenBank accession number L00045 ), exon 15 of b-raf (AC006344), and exons 5, 6, 7, and 8 of p53 (X54156) were amplified using external primers specific for intronic sequences flanking each exon ( Table 1 ). Internal nested primers contained 5′ M13 forward and reverse sequences to facilitate direct sequencing of polymerase chain reaction (PCR) products ( Table 1 ). PCR products were amplified by adding 1 μL of digested DNA to a 50 μL reaction containing 0.5 μ M concentrations of each external primer, 0.2 μ M concentrations of each dNTP, 1.5 m M MgCl 2, and 1.5 U of a taq/pwo blend (Expand High Fidelity PCR system; Roche Molecular Biochemicals, Indianapolis, IN). Thermocycling was conducted as follows: hot-start at 94 °C for 5 minutes; 35 cycles of 94 °C for 30 seconds, 55 °C for 30 seconds, and 72 °C for 1 minute; and a final extension at 72 °C for 8 minutes. One microliter of the first-round PCR reaction was then added to a second-round reaction containing internal primers, which was then cycled 30 times under the same conditions. The presence of an appropriate PCR product was confirmed by agarose gel electrophoresis. Amplicons were purified using the QIAquick PCR Purification kit (Qiagen, Valencia, CA) and sequenced bidirectionally using fluorescent dye-terminator chemistry (Applied Biosystems, Foster City, CA). Sequencing reaction products were resolved with an ABI 3700 DNA analyzer (Applied Biosystems). Mutations were identified by visual analysis of the sequencing chromatograms using Sequencher 4.1.4 (GeneCodes, Ann Arbor, MI). Missense mutations were defined as the presence of two overlapping peaks, both 50% greater than background. All mutations were confirmed in both forward and reverse strands. p53 was classified as wild-type only if the absence of mutations could be verified in all four exons examined.
Forward and reverse primer sequences used to sequence p53, k-ras, and b-raf
| Gene exon | External/internal | Forward (For) and reverse (Rev) primer sequences (5′→3′) |
|---|---|---|
| p53 exon 5 | External | For: TGTTCACTTGTGCCCTGAC |
| Rev: AGCAATCAGTGAGGAATCAG | ||
| Internal | For * : TGTAAAACGACGGCCAGT TTCAACTCTGTCTCCTTC | |
| Rev: CAGGAAACAGCTATGACC AGCCCTGTCGTCTCTCCAG | ||
| p53 exon 6 | External | For: AGAGACGACAGGGCTGGTTG |
| Rev: CACTGACAACCACCCTTAACC | ||
| Internal | For: TGTAAAACGACGGCCAGT GCCTCTGATTCCTCACTGAT | |
| Rev: CAGGAAACAGCTATGACC TTAACCCCTCCTCCCAGAGA | ||
| p53 exon 7 | External | For: TTGCCACAGGTCTCCCCAAG |
| Rev: ACAGCAGGCCAGTGTGCAG | ||
| Internal | For: TGTAAAACGACGGCCAGT AGGCGCACTGGCCTCATCTT | |
| Rev: CAGGAAACAGCTATGACC TGTGCAGGGTGGCAAGTGGC | ||
| p53 exon 8 | External | For: AGGTAGGACCTGATTTCCTTAC |
| Rev: AGTGAAGTCTGAGGCATAACTG | ||
| Internal | For: TGTAAAACGACGGCCAGT CCTTACTGCCTCTTGCTTCTC | |
| Rev: CAGGAAACAGCTATGACC AGGCATAACTGCACCCTTGG | ||
| k-ras exon 2 | External | For: AGGCCTGCTGAAAATGACTG |
| Rev: CTGTATCAAAGAATGGTCCTG | ||
| Internal | For: TGTAAAACGACGGCCAGT ATGACTGAATATAAACTTGTGG | |
| Rev: CAGGAAACAGCTATGACC TCTATTGTTGGATCATATTCG | ||
| b-raf exon 15 | External | For: ACTCTTCATAATGCTTGCTCT |
| Rev: AGTAACTCAGCAGCATCTCAG | ||
| Internal | For: TGTAAAACGACGGCCAGT CTGTTTTCCTTTACTTACTACACC | |
| Rev: CAGGAAACAGCTATGACC ATAGCCTCAATTCTTACCATC |
M13 forward and M13 reverse sequences are underlined.
Immunohistochemistry for P53
Immunohistochemistry was performed on tissue sections as previously described ( 25 ) . In brief, antigen retrieval was carried out on formalin-fixed paraffin-embedded tissue sections for 20 minutes at 95 °C using Target retrieval solution (pH 6.0; DakoCytomation, Carpinteria, CA), according to the manufacturer's instructions. Immunolabeling was performed with a mouse monoclonal antibody (clone DO-7; DakoCytomation) that recognizes both mutant and wild-type forms of the protein ( 30 ) or with naive mouse immunoglobulins, both at 2.5 μg/mL. Immunocomplexes were labeled with a biotinylated anti-mouse secondary antibody, an avidin–biotin–horseradish peroxidase complex (Vector Laboratories, Burlingame, CA), and the 3,3′-diaminobenzidine chromogen. Tumors were scored as being positive for overexpression if nuclear staining was evident in at least 10% of neoplastic cells, consistent with other published analyses ( 31 ) .
Statistical Analysis
Mutation screening and scoring of immunohistochemistry were performed by investigators who were blinded to clinical outcome. Median survival times within each biomarker subgroup were estimated from Kaplan–Meier curves. Corresponding hazard ratios for overall survival were estimated using Cox regression analysis. Differences between subgroups were assessed by the unadjusted log-rank test. The proportional hazards assumption for the Cox model was assessed by time-dependent covariate analysis. The time-dependent covariate was not statistically significant in these models, suggesting that the proportional hazards assumption is reasonable. Statistical associations between categorical variables were assessed using the chi-square test, and absolute agreement was measured by the κ statistic. P values less than .05 were considered to be statistically significant. All statistical tests were two-sided.
R ESULTS
Study Group Characteristics
Patients included in these subset analyses had demographic and pathologic characteristics that were representative of the total patient population in the bevacizumab trial ( Table 2 ). At the time of this analysis, outcome data were available for 267 of the 295 patients for whom tumor samples were examined (33% of the original trial participants). The remaining 28 patients had been treated with 5-fluorouracil, leucovorin, and bevacizumab (arm three of the phase III trial) and were excluded from analyses of survival. Hazard ratios for death for patients in the bevacizumab arm versus the placebo arm were not statistically significantly different in the subset of 267 patients compared with those for the overall trial population (0.57 versus 0.66, P = .34).
Demographic and clinical characteristics of study patients in subset and overall phase III trial population *
| Subset population | Overall phase III study ( 4 ) | |||||
|---|---|---|---|---|---|---|
| Variable | IFL plus placebo | IFL plus bevacizumab | IFL plus placebo | IFL plus bevacizumab | ||
| N | 120 | 147 | 411 | 402 | ||
| Sex (%) | ||||||
| Male | 54 | 58 | 60 | 59 | ||
| Female | 46 | 42 | 40 | 41 | ||
| Mean age (y) | 58.5 | 60.5 | 59.2 | 59.5 | ||
| Tumor location (%) | ||||||
| Colon | 83 | 78 | 81 | 77 | ||
| Rectum | 17 | 22 | 19 | 23 | ||
| Median survival (months) | 17.5 | 26.4 | 15.6 | 20.3 | ||
| HR for death in bevacizumab versus placebo groups (95% CI) † | 0.57 (0.43 to 0.76) | 0.66 (0.54 to 0.81) | ||||
The subset population represents the 33% of patients from the overall phase III trial, assessing the benefit of the addition of bevacizumab to IFL, who submitted tissue samples for biomarker research and were assessed in this study. IFL = irinotecan, 5-fluorouracil, and leucovorin; HR = hazard ratio; CI = confidence interval.
Not statistically significantly different. P = .34.
Sequencing and Immunohistochemistry Frequency Data
We obtained informative sequence data on k-ras, b-raf, and p53 mutation status for 255, 250, and 227 of the 295 tumor samples, respectively. Results were not available for the remaining tumors owing to technical problems with DNA extraction, PCR amplification, or sequencing. Mutations in k-ras were identified in 88 of 255 tumor samples (35%), and mutations in b-raf were identified in 14 of 250 tumor samples (5.6%). Frequencies for specific k-ras and b-raf mutations are detailed in Table 3 . One tumor exhibited both a G595V substitution in b-raf and a G13C substitution in k-ras; the 13 other b-raf mutation–positive tumors did not harbor a mutation in k-ras.
Mutation frequencies of k-ras and b-raf in colorectal tumors
| Gene | Codon | Wild-type → mutant amino acid | Number | % of mutations |
|---|---|---|---|---|
| k-ras | 12 | Gly → Ala | 5 | 5 |
| k-ras | 12 | Gly → Cys | 7 | 7 |
| k-ras | 12 | Gly → Asp | 35 | 34 |
| k-ras | 12 | Gly → Phe | 1 | 1 |
| k-ras | 12 | Gly → Ser | 6 | 6 |
| k-ras | 12 | Gly → Val | 15 | 15 |
| k-ras | 13 | Gly → Cys | 1 | 1 |
| k-ras | 13 | Gly → Asp | 18 | 18 |
| b-raf | 593 | Asp → Gly | 1 | 1 |
| b-raf | 595 | Gly → Val | 1 | 1 |
| b-raf | 599 | Val → Glu | 11 | 11 |
| b-raf | 602 | Arg → Gln | 1 | 1 |
| Total | 102 | 100 |
Mutations in p53 were observed in 154 of 227 tumors (68%), and the majority of these mutations (119, or 77%) were missense changes. Nonsynonymous mutations were identified in 59 codons within the 181-codon region examined, which encodes most of the DNA binding domain ( Fig. 1 ). Point mutations at five “hot-spot” codons within conserved regions of the DNA binding domain (175, 245, 248, 273, and 282) ( 32 , 33 ) accounted for 63 (41%) of the observed point mutations ( Fig. 1 ). Nonsense point mutations and frameshift deletions that introduced premature stop codons were identified in 33 tumors (21%). The majority of nonsense point mutations (21 of 28, or 75%) were located outside conserved regions ( Fig. 1 ). In addition, one patient exhibited a two-codon repeat insertion 3′ to codon 242, and another patient exhibited an 18-base pair deletion starting at codon 176.
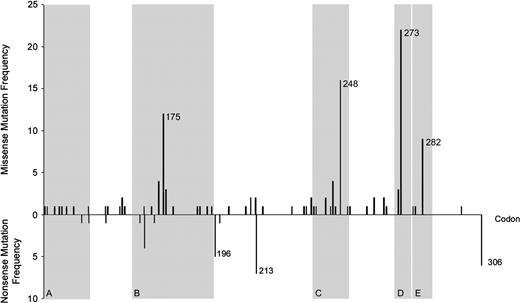
Bar chart of the distribution of missense and nonsense p53 mutations by codon. Regions shaded gray indicate structural domains of P53 ( 33 ) : region A is a sheet of loop–sheet–helix; region B is a loop–helix; region C is a loop; region D is a sheet of loop–sheet–helix; and region E is a helix of loop–sheet–helix.
Informative immunohistochemical results were obtained for 294 of the 295 tumor samples, of which 211 (72%) exhibited P53 overexpression. The relationship between P53 overexpression and the type of p53 mutation is illustrated in Table 4 . P53 overexpression was statistically significantly associated with the presence of a p53 mutation ( P = .003), but absolute agreement between sequence and immunohistochemical results was low (κ = 0.21). The positive and negative predictive values ( 34 ) of immunohistochemistry for sequencing data were 0.74 and 0.47, respectively. Thirty-one tumors did not overexpress P53 as measured by immunohistochemistry but did contain a mutation in the p53 gene. Of these, 23 contained nonsense mutations or frameshifts that reduced protein expression. Three of 10 tumors that exhibited P53 overexpression and nonsense/frameshift mutations also exhibited concomitant missense mutations.
Frequencies of p53 mutations and P53 expression in colorectal tumors from 226 patients who participated in the trial
| P53 expression | |||||
|---|---|---|---|---|---|
| p53 mutation status | Positive (% of total positive) | Negative (% of total negative) | Total (%) | ||
| Point mutations | |||||
| Nonsense | 9 (4) * | 18 (31) | 27 (12) | ||
| Missense | 111 (67) | 8 (14) | 119 (53) | ||
| Insertions/deletions | |||||
| Frameshift | 1 (<1) † | 5 (8) | 6 (3) | ||
| Deletions (in-frame) | 1 (<1) | 0 | 1 (<1) | ||
| Insertions (In-frame) | 1 (<1) | 0 | 1 (<1) | ||
| Wild-type | 44 (26) | 28 (47) | 72 (32) | ||
| Total (%) | 167 (74) | 59 (26) | 226 | ||
Two of the nine had concomitant missense mutations.
One tumor overexpressed P53 and had a concomitant missense mutation.
Mutations in p53 were less frequent in mucinous tumors than in nonmucinous tumors (46% versus 71%, P <.02) and more frequent in tumors distal to the splenic flexure than in tumors proximal to the splenic flexure (72% versus 58%, P = .05). There were no other statistically significant associations between clinicopathologic variables and molecular characteristics (data not shown). Mutations in k-ras or b-raf were not associated with p53 mutation or P53 overexpression (data not shown).
Overall Survival by Treatment Arm and Biomarker Status
In all four biomarker subgroups (k-ras, b-raf, and p53 sequencing and P53 expression), estimated hazard ratios for death were less than 1 for patients treated with bevacizumab plus IFL as compared with those for patients treated with placebo plus IFL ( Fig. 2 ). No differential benefit from exposure to bevacizumab ( Fig. 2 ) was observed by biomarker. Similar results were found for progression-free survival and objective response rate when assessed by biomarker subgroup (data not shown).
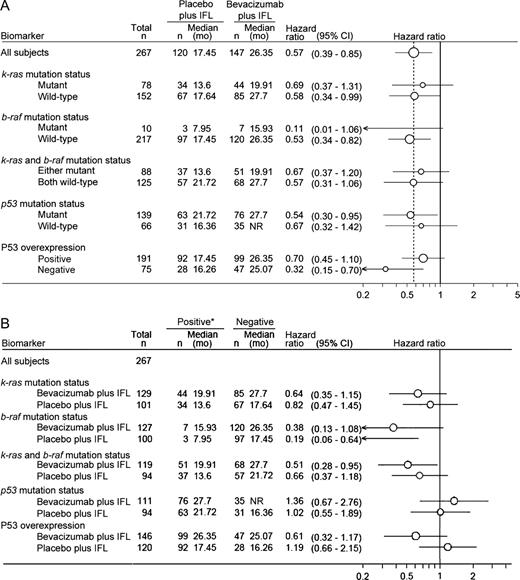
Forest plots illustrating hazard ratios for risk of death according to biomarker status and treatment subgroup. Median survival times in each biomarker subgroup were estimated from Kaplan–Meier curves, and hazard ratios ( circles ) and 95% confidence intervals (CI) ( horizontal lines ) were estimated using Cox regression analysis. Differences between subgroups were assessed using the log-rank test without adjustment. Relative size of the circles indicates number of patients. A ) Hazard ratios indicate the change in median survival associated with the addition of bevacizumab to IFL relative to treatment with placebo plus IFL. Dashed vertical line indicates the hazard ratio for all subjects (0.57). B ) Hazard ratios represent the median survivals in those with no mutation (or, for P53, no overexpression) (i.e., negative) relative to those with a mutation (or P53 overexpression) (i.e., positive) in each treatment arm. Hazard ratios less than 1 (indicated by solid vertical line ) represent a longer median survival. IFL = irinotecan, 5-fluorouracil, and leucovorin; NR = not reached.
When k-ras and b-raf mutation status were included in the Cox model of overall survival, patients whose tumors had wild-type k-ras and b-raf had better prognoses than those with mutations in one or both genes irrespective of the treatment group assessed. In patients treated with IFL and bevacizumab, the hazard ratio for death among patients with tumors containing wild-type k-ras and b-raf relative to patients with tumors containing mutations in k-ras and/or b-raf was 0.51 (95% confidence intervals [CI] = 0.28 to 0.95), whereas in patients treated with IFL and placebo it was 0.66 (95% CI = 0.37 to 1.18) ( Fig. 2 ). In a Cox model that adjusted for treatment, patients whose tumors contained wild-type k-ras and wild-type b-raf had a statistically significantly longer median survival (HR = 0.59, 95% CI = 0.39 to 0.89, P = .01) than patients whose tumors contained mutations in one or both genes. The hazard ratio for death among patients with tumors containing wild-type b-raf relative to patients with tumors containing mutations in b-raf was considerably lower than the hazard ratio for death among patients with tumors containing wild-type k-ras relative to patients with tumors containing mutations in k-ras. However, the low frequency of b-raf mutations limits the interpretation of these findings. Neither mutation status of p53 nor P53 overexpression was observed to be a prognostic factor ( Fig. 2 ). Again, results from progression-free survival and objective response rate analyses were similar to those for overall survival (data not shown).
D ISCUSSION
Data from clinical and preclinical research had indicated that alterations in the Ras/Raf/Mek/Erk pathway or inactivation of the p53 tumor suppressor gene may have clinical relevance to the efficacy of anti-VEGF therapies ( 15 – 18 , 23 , 24 , 26 ) , such as bevacizumab. However, in this retrospective series we did not identify any subgroup of metastatic colorectal cancer patients who were more likely to respond to bevacizumab therapy. That is, all subgroups benefited from the addition of bevacizumab to IFL, regardless of the status of markers of Ras/Raf/Mek/Erk pathway activity or of p53. Although patients without mutations in the k-ras and b-raf genes demonstrated statistically significant better overall survival than those with a mutation in one or both genes, this difference was observed irrespective of the treatment received.
Before this study, no clinical data existed, to our knowledge, to support or refute an effect of k-ras or b-raf mutation on the efficacy of antiangiogenic therapy, although the associations have been studied in several preclinical models. Indeed, the tumorigenic phenotype observed after the introduction of oncogenic ras into murine embryonic stem cells has been suggested to be critically dependent on VEGF expression ( 35 ) . However, a preliminary in situ hybridization analysis of VEGF expression in our tumor series (Jubb AM, Hurwitz HI, Bai W, Holmgren EB, Tobin P, Guerrero S, Kabbinavar F, Holden SN, Novotny WF, Frantz GD, Hillan KJ, Koeppen H: unpublished data) could not confirm an association between VEGF expression and k-ras mutations reported by Ikeda et al. ( 36 ) . Indeed, in vivo growth of both ras-transformed and untransformed embryonic stem cells is reduced in vegf-knockout mice ( 35 , 37 ) , suggesting that VEGF-targeting strategies are effective in limiting tumor growth, regardless of k-ras status. The results from these preclinical studies are consistent with our clinical data—that is, antiangiogenic therapies that target VEGF are effective irrespective of alterations in the Ras/Raf/Mek/Erk pathway.
In contrast, our findings for the p53 subgroup are not entirely consistent with those reported in preclinical models. Yu et al. ( 23 ) found that xenografts established from matched p53-null and p53 wild-type cell lines both exhibited a substantial reduction in tumor volume when treated with combination antiangiogenic and cytotoxic (vinblastine) therapies compared with placebo. Although these results are broadly consistent with our findings, the p53-null xenografts also showed a smaller reduction in tumor volume with vinblastine plus antiangiogenic therapy than p53 wild-type xenografts ( 23 ) ; by contrast, we did not observe a statistically significant difference in the survival benefit conferred by the addition of bevacizumab for patients with p53 mutant tumors compared with patients with p53 wild-type tumors. The discrepant findings between the two studies may reflect the fact that the simpler mouse model does not completely capture the complexity of human colorectal cancer.
We also assessed whether mutations in k-ras and/or b-raf could predict overall survival. Mutations in k-ras and b-raf are frequently mutually exclusive and are considered to be biologically equivalent for our analyses ( 6 , 38 – 42 ) . In both treatment groups, colorectal cancer patients whose tumors had wild-type versions of both k-ras and b-raf had a statistically significantly lower risk of death than patients who had mutations in either gene ( Fig. 2 ). This finding is consistent with the RASCAL II meta-analysis, which reported that k-ras mutations, specifically G12V, were associated with an adverse outcome ( 14 ) . It is also consistent with the finding from a prospective randomized, controlled trial of adjuvant chemotherapy for colorectal cancer ( 7 ) that patients with stage III disease and wild-type k-ras responded better to therapy than patients with mutant k-ras, although the difference was not statistically significant.
Similarly, our investigation did not find an association between p53 mutation or P53 overexpression and the overall survival of patients with metastatic colorectal cancer. Our finding is consistent with the report by Samowitz et al. ( 43 ) , who examined the prognostic significance of p53 mutations in 1464 cases of colorectal cancer. In univariate analyses, patients with mutant p53 had a statistically significantly poorer 5-year survival than patients with wild-type p53, although the magnitude of this difference was small. In addition, it did not reach statistical significance in multivariable analyses. Five randomized, controlled trials have investigated the association of P53 expression as measured by immunohistochemistry with outcomes of patients with colorectal cancer ( 7 , 31 , 44 – 46 ) , but there is no consensus on the prognostic impact or predictive value of nuclear P53 overexpression. Furthermore, results of studies that have specifically examined late-stage colorectal cancer tumors and p53 status have been inconsistent ( 47 – 51 ) .
Further biomarker analyses, including a comprehensive examination of VEGF expression, are planned for our study population. To date, few studies have assessed the potential utility of biomarkers in predicting which patients are more likely to respond to antiangiogenic therapy in the clinic. Biomarkers of interest may include those involved in activation of VEGF signaling pathways [e.g., phosphorylation of VEGF receptor 2 ( 52 ) or activation of SRC ( 53 ) ] or those effectors that are expressed downstream of VEGF [e.g., carcinoembryonic antigen–related cell adhesion molecule 1 ( 54 ) or plasmalemmal vesicle associated protein ( 55 ) ]. Other biomarkers of interest include neuropilin-1 (a novel VEGF receptor) ( 56 ) and placental growth factor (an alternate ligand for VEGF receptor 1) ( 57 , 58 ) . Late-stage tumors have been shown to activate additional angiogenic regulatory factors, which function independent of or in concert with VEGF receptor 2 signaling, reducing their VEGF dependence ( 59 ) . Examples include transforming growth factor-β, basic fibroblast growth factor, and interleukin-8 ( 60 , 61 ) , which have been reported to have clinical significance ( 62 – 64 ) and could potentially predict response to VEGF inhibition. Further investigations are needed to determine whether these biomarkers provide better surrogate measures of VEGF dependence and susceptibility to VEGF inhibition.
Alternatively, biomarkers that summarize the effects of all angiogenic regulators may better predict patient outcome than the analysis of a single growth factor or signal transduction pathway. For example, Willett et al. ( 65 ) have shown that the preoperative administration of bevacizumab plus radiotherapy to rectal cancer patients reduces tumor perfusion, vascular volume, numbers of circulating endothelial and bone marrow progenitor cells, and microvascular density but increases the fraction of mature vessels (reflecting a loss of immature endothelium). In addition, clinical data ( 66 ) indicate that acute or short-term changes in tumor permeability and vascularity after administration of another antiangiogenic agent, assessed by dynamic contrast–enhanced magnetic resonance imaging, might represent biomarkers inmetastatic colorectal cancer. These clinical observations are bolstered by preclinical research related to bevacizumab ( 67 ) , which suggest that magnetic resonance imaging assessing vessel permeability and surface area may be useful to monitor patient response. However, more powerful studies are needed to determine whether such biomarkers predict response to treatment in terms of overall survival.
This study has several limitations. First, consent to use archival tissue and the provision of adequate tissue by the primary treatment centers was optional, raising the possibility that these analyses may be subject to selection bias. However, because the demographic characteristics of the substudy were representative of the overall phase III trial population, any selection bias probably had a minimal impact on the findings. Second, the log-rank test was unadjusted to accommodate the small sample sizes of the subgroups. Consequently the hazard ratios may be influenced by imbalances in important prognostic characteristics in the subsets. Finally, these analyses were performed retrospectively on relatively small subsets of predominantly primary tumors, and inferences were then made regarding the treatment of metastatic disease. Nevertheless, the frequency, type, and distribution of k-ras and b-raf mutations in this case series were similar to those seen in other published studies ( 20 , 38 , 39 , 41 , 68 ) ( Table 5 ), and the associations of wild-type p53 with a proximal tumor site and mucinous-type cancers are consistent with previous reports ( 43 , 69 , 70 ) . The frequency of tumors overexpressing P53 was also similar to published observations ( 10 , 71 – 75 ) , and the poor agreement between P53 protein overexpression and sequencing results in this series is a common finding ( 71 , 74 , 76 – 80 ) . Mutations in b-raf, k-ras, and p53 are commonly acquired before metastasis and are heritable. Therefore, it is highly likely that the detection of these lesions in the primary cancer is representative of the metastatic disease. Nevertheless, the data must be considered exploratory in nature, and all findings warrant independent, prospective confirmation in a larger series.
Comparison of mutation frequencies from subset population with published data
| Mutation | Subset population | Published data * |
|---|---|---|
| k-ras | ||
| Total number of tumors | 255 | 6777 |
| Mutant (% total) | 35 | 35 |
| Codon 12 (% total mutations) | 78 | 83 |
| Codon 13 (% total mutations) | 22 | 17 |
| G12D (% total mutations) | 39 | 35 |
| G12V (% total mutations) | 17 | 22 |
| G13D (% total mutations) | 22 | 15 |
| b-raf | ||
| Total number of tumors | 250 | 493 |
| Mutant (% total) | 5.6 | 10 |
| Codon 599 (% total mutations) | 79 | 84 |
| p53 | ||
| Total number of tumors | 277 | 8749 |
| Mutant (% total) | 68 | 44 |
| Missense (% total mutations) | 77 | 80 |
| Nonsense/frameshift (% total mutations) | 21 | 15 |
| Hotspot (% total mutations) | 42 | 42 |
Published data for k-ras are from ( 68 ) and from COSMIC, Catalogue of Somatic Mutations in Cancer, http://www.sanger.ac.uk/genetics/CGP/cosmic/ . [Last accessed: September 13, 2004.] Published data for b-raf are from ( 38 , 39 , 41 ) . Published data for p53 are from ( 20 ) and from IARC, International Agency for Research on Cancer, http://www.iarc.fr/index.html . [Last accessed: September 13, 2004.]
In summary, these retrospective subset analyses on primary tumors and metastases suggest that the survival benefit from the addition of bevacizumab to first-line IFL, in the treatment of metastatic colorectal cancer, is independent of k-ras, b-raf, or p53 mutation status or P53 expression. Patients with wild-type k-ras and b-raf appear to have a better prognosis than those mutant for either gene, regardless of treatment received. These findings should be confirmed prospectively in a larger population.
W. L. Ince and A. M. Jubb contributed equally to this manuscript.
We thank all patients and investigators who participated in the pivotal trial of bevacizumab in metastatic colorectal cancer. Members of Genentech's anatomical pathology, DNA sequencing, and oligonucleotide synthesis groups were instrumental in the implementation of the study. The authors gratefully acknowledge archival support by Colleen Corey and Michelle Gossage (Department of Pathology, Genentech Inc.).
References
Ferrara N, Davis-Smyth T. The biology of vascular endothelial growth factor.
Jubb AM, Pham TQ, Hanby AM, Frantz GD, Peale FV, Wu TD, et al. Expression of vascular endothelial growth factor, hypoxia inducible factor 1α, and carbonic anhydrase IX in human tumours.
Kim KJ, Li B, Winer J, Armanini M, Gillett N, Phillips HS, et al. Inhibition of vascular endothelial growth factor-induced angiogenesis suppresses tumour growth in vivo.
Hurwitz H, Fehrenbacher L, Novotny W, Cartwright T, Hainsworth J, Heim W, et al. Bevacizumab plus irinotecan, fluorouracil, and leucovorin for metastatic colorectal cancer.
Kinzler KW, Vogelstein B. Colorectal tumors. In Kinzler KW, Vogelstein B, editors. The genetic basis of human cancer. London (U.K.): McGraw-Hill;
Wan PT, Garnett MJ, Roe SM, Lee S, Niculescu-Duvaz D, Good VM, et al. Mechanism of activation of the RAF-ERK signaling pathway by oncogenic mutations of B-RAF.
Ahnen DJ, Feigl P, Quan G, Fenoglio-Preiser C, Lovato LC, Bunn PA Jr, et al. Ki-ras mutation and p53 overexpression predict the clinical behavior of colorectal cancer: a Southwest Oncology Group study.
Andreyev HJ, Norman AR, Cunningham D, Oates JR, Clarke PA. Kirsten ras mutations in patients with colorectal cancer: the multicenter “RASCAL” study.
Bazan V, Migliavacca M, Zanna I, Tubiolo C, Grassi N, Latteri MA, et al. Specific codon 13 K-ras mutations are predictive of clinical outcome in colorectal cancer patients, whereas codon 12 K-ras mutations are associated with mucinous histotype.
Bell SM, Scott N, Cross D, Sagar P, Lewis FA, Blair GE, et al. Prognostic value of p53 overexpression and c-Ki-ras gene mutations in colorectal cancer.
Esteller M, Gonzalez S, Risques RA, Marcuello E, Mangues R, Germa JR, et al. K-ras and p16 aberrations confer poor prognosis in human colorectal cancer.
Nemunaitis J, Cox J, Hays S, Meyer W, Kebart R, Ognoskie N, et al. Prognostic role of K-ras in patients with progressive colon cancer who received treatment with Marimastat (BB2516).
Tortola S, Marcuello E, Gonzalez I, Reyes G, Arribas R, Aiza G, et al. p53 and K-ras gene mutations correlate with tumor aggressiveness but are not of routine prognostic value in colorectal cancer.
Andreyev HJ, Norman AR, Cunningham D, Oates J, Dix BR, Iacopetta BJ, et al. Kirsten ras mutations in patients with colorectal cancer: the ‘RASCAL II’ study.
Chin L, Tam A, Pomerantz J, Wong M, Holash J, Bardeesy N, et al. Essential role for oncogenic Ras in tumour maintenance.
Rak J, Mitsuhashi Y, Sheehan C, Tamir A, Viloria-Petit A, Filmus J, et al. Oncogenes and tumor angiogenesis: differential modes of vascular endothelial growth factor up-regulation in ras-transformed epithelial cells and fibroblasts.
Rak J, Mitsuhashi Y, Bayko L, Filmus J, Shirasawa S, Sasazuki T, et al. Mutant ras oncogenes upregulate VEGF/VPF expression: implications for induction and inhibition of tumor angiogenesis.
Watnick RS, Cheng YN, Rangarajan A, Ince TA, Weinberg RA. Ras modulates Myc activity to repress thrombospondin-1 expression and increase tumor angiogenesis.
Barratt PL, Seymour MT, Stenning SP, Georgiades I, Walker C, Birbeck K, et al. DNA markers predicting benefit from adjuvant fluorouracil in patients with colon cancer: a molecular study.
Olivier M, Eeles R, Hollstein M, Khan MA, Harris CC, Hainaut P. The IARC TP53 database: new online mutation analysis and recommendations to users.
Bras-Goncalves RA, Rosty C, Laurent-Puig P, Soulie P, Dutrillaux B, Poupon MF. Sensitivity to CPT-11 of xenografted human colorectal cancers as a function of microsatellite instability and p53 status.
Bunz F, Hwang PM, Torrance C, Waldman T, Zhang Y, Dillehay L, et al. Disruption of p53 in human cancer cells alters the responses to therapeutic agents.
Yu JL, Rak JW, Coomber BL, Hicklin DJ, Kerbel RS. Effect of p53 status on tumor response to antiangiogenic therapy.
Bouvet M, Ellis LM, Nishizaki M, Fujiwara T, Liu W, Bucana CD, et al. Adenovirus-mediated wild-type p53 gene transfer down-regulates vascular endothelial growth factor expression and inhibits angiogenesis in human colon cancer.
Jubb AM, Landon TH, Burwick J, Pham TQ, Frantz GD, Cairns B, et al. Quantitative analysis of colorectal tissue microarrays by immunofluorescence and in situ hybridization.
Dameron KM, Volpert OV, Tainsky MA, Bouck N. Control of angiogenesis in fibroblasts by p53 regulation of thrombospondin-1.
Munro AJ, Lain S, Lane DP. P53 abnormalities and outcomes in colorectal cancer: a systematic review.
Kononen J, Bubendorf L, Kallioniemi A, Barlund M, Schraml P, Leighton S, et al. Tissue microarrays for high-throughput molecular profiling of tumor specimens.
Hoos A, Urist MJ, Stojadinovic A, Mastorides S, Dudas ME, Leung DH, et al. Validation of tissue microarrays for immunohistochemical profiling of cancer specimens using the example of human fibroblastic tumors.
Turpeinen M, Serpi R, Rahkolin M, Vahakangas K. Comparison of anti-p53 antibodies in immunoblotting.
Allegra CJ, Paik S, Colangelo LH, Parr AL, Kirsch I, Kim G, et al. Prognostic value of thymidylate synthase, Ki-67, and p53 in patients with Dukes' B and C colon cancer: a National Cancer Institute-National Surgical Adjuvant Breast and Bowel Project collaborative study.
Greenblatt MS, Bennett WP, Hollstein M, Harris CC. Mutations in the p53 tumor suppressor gene: clues to cancer etiology and molecular pathogenesis.
Walker DR, Bond JP, Tarone RE, Harris CC, Makalowski W, Boguski MS, et al. Evolutionary conservation and somatic mutation hotspot maps of p53: correlation with p53 protein structural and functional features.
Greenhalgh T. How to read a paper. Papers that report diagnostic or screening tests.
Shi YP, Ferrara N. Oncogenic ras fails to restore an in vivo tumorigenic phenotype in embryonic stem cells lacking vascular endothelial growth factor (VEGF).
Ikeda N, Nakajima Y, Sho M, Adachi M, Huang CL, Iki K, et al. The association of K-ras gene mutation and vascular endothelial growth factor gene expression in pancreatic carcinoma.
Ferrara N, Carver-Moore K, Chen H, Dowd M, Lu L, O'Shea KS, et al. Heterozygous embryonic lethality induced by targeted inactivation of the VEGF gene.
Davies H, Bignell GR, Cox C, Stephens P, Edkins S, Clegg S, et al. Mutations of the BRAF gene in human cancer.
Fransen K, Klintenas M, Osterstrom A, Dimberg J, Monstein HJ, Soderkvist P. Mutation analysis of the BRAF, ARAF and RAF-1 genes in human colorectal adenocarcinomas.
Ikenoue T, Hikiba Y, Kanai F, Tanaka Y, Imamura J, Imamura T, et al. Functional analysis of mutations within the kinase activation segment of B-Raf in human colorectal tumors.
Rajagopalan H, Bardelli A, Lengauer C, Kinzler KW, Vogelstein B, Velculescu VE. Tumorigenesis: RAF/RAS oncogenes and mismatch-repair status.
Yuen ST, Davies H, Chan TL, Ho JW, Bignell GR, Cox C, et al. Similarity of the phenotypic patterns associated with BRAF and KRAS mutations in colorectal neoplasia.
Samowitz WS, Curtin K, Ma KN, Edwards S, Schaffer D, Leppert MF, et al. Prognostic significance of p53 mutations in colon cancer at the population level.
Adell G, Sun XF, Stal O, Klintenberg C, Sjodahl R, Nordenskjold B. p53 status: an indicator for the effect of preoperative radiotherapy of rectal cancer.
Edler D, Hallstrom M, Johnston PG, Magnusson I, Ragnhammar P, Blomgren H. Thymidylate synthase expression: an independent prognostic factor for local recurrence, distant metastasis, disease-free and overall survival in rectal cancer.
Watanabe T, Wu TT, Catalano PJ, Ueki T, Satriano R, Haller DG, et al. Molecular predictors of survival after adjuvant chemotherapy for colon cancer.
Belluco C, Guillem JG, Kemeny N, Huang Y, Klimstra D, Berger MF, et al. p53 nuclear protein overexpression in colorectal cancer: a dominant predictor of survival in patients with advanced hepatic metastases.
Costa A, Doci R, Mochen C, Bignami P, Faranda A, Gennari L, et al. Cell proliferation-related markers in colorectal liver metastases: correlation with patient prognosis.
Khan ZA, Jonas SK, Feldmann KA, Patel H, Wharton RQ, Tarragona A, et al. P53 mutation and response to hepatic arterial floxuridine in patients with colorectal liver metastases.
Nitti D, Belluco C, Montesco MC, Bertorelle R, Da Pian PP, Fassina A, et al. Nuclear p53 protein expression in resected hepatic metastases from colorectal cancer: an independent prognostic factor of survival.
Rosty C, Chazal M, Etienne MC, Letoublon C, Bourgeon A, Delpero JR, et al. Determination of microsatellite instability, p53 and K-RAS mutations in hepatic metastases from patients with colorectal cancer: relationship with response to 5-fluorouracil and survival.
Fiedler W, Serve H, Dohner H, Schwittay M, Ottmann OG, O'Farrell AM, et al. A phase I study of SU11248 in the treatment of patients with refractory or resistant acute myeloid leukemia (AML) or not amenable to conventional therapy for the disease.
Eliceiri BP, Paul R, Schwartzberg PL, Hood JD, Leng J, Cheresh DA. Selective requirement for Src kinases during VEGF-induced angiogenesis and vascular permeability.
Ergun S, Kilik N, Ziegeler G, Hansen A, Nollau P, Gotze J, et al. CEA-related cell adhesion molecule 1: a potent angiogenic factor and a major effector of vascular endothelial growth factor.
Strickland LA, Jubb AM, Hongo J, Zhong F, Burwick J, Fu L, et al. Plasmalemmal vesicle associated protein (PLVAP) is expressed by tumor endothelium and is upregulated by vascular endothelial growth factor-A (VEGF). J Pathol. In press
Soker S, Takashima S, Miao HQ, Neufeld G, Klagsbrun M. Neuropilin-1 is expressed by endothelial and tumor cells as an isoform-specific receptor for vascular endothelial growth factor.
Autiero M, Waltenberger J, Communi D, Kranz A, Moons L, Lambrechts D, et al. Role of PlGF in the intra- and intermolecular cross talk between the VEGF receptors Flt1 and Flk1.
Carmeliet P, Moons L, Luttun A, Vincenti V, Compernolle V, De Mol M, et al. Synergism between vascular endothelial growth factor and placental growth factor contributes to angiogenesis and plasma extravasation in pathological conditions.
Inoue M, Hager JH, Ferrara N, Gerber HP, Hanahan D. VEGF-A has a critical, nonredundant role in angiogenic switching and pancreatic beta cell carcinogenesis.
Belperio JA, Keane MP, Arenberg DA, Addison CL, Ehlert JE, Burdick MD, et al. CXC chemokines in angiogenesis.
Relf M, LeJeune S, Scott PA, Fox S, Smith K, Leek R, et al. Expression of the angiogenic factors vascular endothelial cell growth factor, acidic and basic fibroblast growth factor, tumor growth factor β-1, platelet-derived endothelial cell growth factor, placenta growth factor, and pleiotrophin in human primary breast cancer and its relation to angiogenesis.
Dirix LY, Vermeulen PB, Hubens G, Benoy I, Martin M, De Pooter C, et al. Serum basic fibroblast growth factor and vascular endothelial growth factor and tumour growth kinetics in advanced colorectal cancer.
Haraguchi M, Komuta K, Akashi A, Matsuzaki S, Furui J, Kanematsu T. Elevated IL-8 levels in the drainage vein of resectable Dukes' C colorectal cancer indicate high risk for developing hepatic metastasis.
Picon A, Gold LI, Wang J, Cohen A, Friedman E. A subset of metastatic human colon cancers expresses elevated levels of transforming growth factor beta1.
Willett CG, Boucher Y, di Tomaso E, Duda DG, Munn LL, Tong RT, et al. Direct evidence that the VEGF-specific antibody bevacizumab has antivascular effects in human rectal cancer.
Morgan B, Thomas AL, Drevs J, Hennig J, Buchert M, Jivan A, et al. Dynamic contrast-enhanced magnetic resonance imaging as a biomarker for the pharmacological response of PTK787/ZK 222584, an inhibitor of the vascular endothelial growth factor receptor tyrosine kinases, in patients with advanced colorectal cancer and liver metastases: results from two phase I studies.
Daldrup-Link HE, Okuhata Y, Wolfe A, Srivastav S, Oie S, Ferrara N, et al. Decrease in tumor apparent permeability-surface area product to a MRI macromolecular contrast medium following angiogenesis inhibition with correlations to cytotoxic drug accumulation.
Bamford S, Dawson E, Forbes S, Clements J, Pettett R, Dogan A, et al. The COSMIC (Catalogue of Somatic Mutations in Cancer) database and website.
Gervaz P, Bouzourene H, Cerottini JP, Chaubert P, Benhattar J, Secic M, et al. Dukes B colorectal cancer: distinct genetic categories and clinical outcome based on proximal or distal tumor location.
Hanski C, Tiecke F, Hummel M, Hanski ML, Ogorek D, Rolfs A, et al. Low frequency of p53 gene mutation and protein expression in mucinous colorectal carcinomas.
Kaserer K, Schmaus J, Bethge U, Migschitz B, Fasching S, Walch A, et al. Staining patterns of p53 immunohistochemistry and their biological significance in colorectal cancer.
Lanza G Jr, Maestri I, Dubini A, Gafa R, Santini A, Ferretti S, et al. p53 expression in colorectal cancer: relation to tumor type, DNA ploidy pattern and short-term survival.
Soong R, Grieu F, Robbins P, Dix B, Chen D, Parsons R, et al. p53 alterations are associated with improved prognosis in distal colonic carcinomas.
Soong R, Robbins PD, Dix BR, Grieu F, Lim B, Knowles S, et al. Concordance between p53 protein overexpression and gene mutation in a large series of common human carcinomas.
Tollenaar RA, van Krieken JH, van Slooten HJ, Bruinvels DJ, Nelemans KM, van den Broek LJ, et al. Immunohistochemical detection of p53 and Bcl-2 in colorectal carcinoma: no evidence for prognostic significance.
Kandioler D, Zwrtek R, Ludwig C, Janschek E, Ploner M, Hofbauer F, et al. TP53 genotype but not p53 immunohistochemical result predicts response to preoperative short-term radiotherapy in rectal cancer.
Bazan V, Migliavacca M, Tubiolo C, Macaluso M, Zanna I, Corsale S, et al. Have p53 gene mutations and protein expression a different biological significance in colorectal cancer?
Colomer A, Erill N, Verdu M, Roman R, Vidal A, Cordon-Cardo C, et al. Lack of p53 nuclear immunostaining is not indicative of absence of TP53 gene mutations in colorectal adenocarcinomas.
Caldes T, Iniesta P, Vega FJ, de Juan C, Lopez JA, Diaz-Rubio E, et al. Comparative survival analysis of p53 gene mutations and protein accumulation in colorectal cancer.

