


Abstract
An estimated 10% of all cutaneous malignant melanoma (CMM) cases are inherited, but the genetics of familial CMM are largely unknown. Ocular malignant melanoma (OMM), which is rare, may be associated with familial CMM. We performed a genome-wide scan of two Danish pedigrees with multiple cases of OMM (N = 10) and CMM (N = 3) and other malignancies (with no germline mutations in CDKN2A, CDK4, BRCA1, and BRCA2) to identify melanoma susceptibility genes. Results of parametric linkage analysis are presented as logarithm of the odds (LOD) scores, and all P values are two-sided. Peak two-point parametric LOD score of 2.2 ( P = .0007) at D9S167 on chromosome 9q21 was observed. Targeted analysis of a third Danish family with OMM and CMM patients confirmed 9q21 linkage, providing a combined four-point parametric LOD score of 3.02 (nominal P = .00003 and genome-wide P = .086). Two families shared a common haplotype comprising three adjacent and highly polymorphic markers, limiting the region to less than 5 cM and 3 Mbp at 9q21.32. Expression of RASEF, a known gene in this region, was examined in tumor tissue from 10 sporadic CMM lesions and was found to be decreased in 70% of these tumors compared with RASEF expression in a human reference RNA pool from 10 different cell types and in 10 breast tumors.
The etiology of cutaneous malignant melanoma (CMM) is complex, involving genetic, phenotypic, and environmental factors. Phenotypic factors associated with melanoma include hair color, skin type, eye color, extent of freckling, and number of melanocytic nevi. The strongest risk factor for CMM is a positive family history of the disease, and familial melanomas account for approximately 10% of all CMM cases. Linkage studies of melanoma-prone families have implicated chromosome 9p21 as a major melanoma susceptibility locus, a result that has subsequently been confirmed by the finding of mutations in the CDKN2A gene, which is located at 9p21 ( 1 ) . Germline mutations in the CDK4 gene (at 12q14) have also been reported in CMM families, but in only a few such families ( 2 ) . In all, mutations in CDKN2A and CDK4 account for only 20%–25% of all familial CMM, suggesting that other melanoma susceptibility genes have yet to be identified. Linkage of melanoma susceptibility to chromosomal regions 6p, 1p36, and 1p22 has been reported ( 3 – 5 ) , with the evidence of linkage strongest for 1p22 (logarithm of the odds [LOD] score = 6.4) in a subset of early-onset CMM families from Australia ( 3 ) . Deletion mapping in CMM tumors suggests that the putative 1p22 locus encodes a tumor suppressor gene ( 6 ) , but mutations in candidate genes have not been observed.
Unlike CMM, ocular malignant melanoma (OMM) is rare, with an annual incidence of 4.3 per million population in North America ( 7 ) . Even rarer are families with members affected with CMM and members affected with OMM; however, such families may aid efforts in identifying new melanoma susceptibility genes and contribute in understanding the underlying cause of malignant melanoma. Studies using comparative genomic hybridization (CGH) and loss of heterozygosity (LOH) analysis of OMM tumors have reported frequent deletions on chromosomes 3, 6q, 8p, 11q, and 1p ( 8 , 9 ) ; these regions may, therefore, harbor OMM tumor suppressor genes. BRCA2 ( 10 ) and BRCA1 germline mutations (unpublished data) in breast cancer–prone families with members also affected with OMM have been observed infrequently. Moreover, germline CDKN2A mutations have been reported only once in a family prone to both CMM and OMM ( 11 ) , suggesting the existence of yet unidentified genes.
During our enrollment of CMM families in Scandinavia, we encountered two unusual families with multiple cases of OMM and CMM that were large enough for a genome-wide scan and linkage analysis ( Fig. 1 ). The study was approved by the ethical committee at Lund University, and the participants gave written informed consent to be studied. Both kindreds originated from Jylland in Western Denmark, potentially minimizing the problem of genetic heterogeneity, which can hinder the identification of novel cancer susceptibility genes. In total, we analyzed 21 samples, most of which were from affected patients, from these two families, using a linkage mapping set (ABI PRISM; Applied Biosystems, Foster City, CA) that contains 382 microsatellite markers with an average spacing of 10 cM. The genotypes were obtained using an ABI3100 sequencer and GeneScan and GeneMapper software (Applied Biosystems). Linkage between disease and marker inheritance was initially evaluated at each marker separately, using the FASTLINK software for parametric two-point analysis and LINKMAP software for parametric three- and four-point analysis ( 12 ) . A dominant disease model was used that assumed 100% penetrance for disease allele carriers and 0% penetrance for noncarriers (i.e., no phenocopies), assuming a rare disease allele (population frequency of 0.0001) and equal allele frequencies for each marker. The allele frequency for a marker with k different alleles observed in the two pedigrees was thus set to 1/ k . Individuals who had developed either OMM or CMM were treated as affected, and all other individuals were considered as unknown. P values were calculated as described previously ( 13 , 14 ) , using a method that adjusts for nonnormality and assumes complete marker data—a method that will usually lead to conservative genome-wide P values.
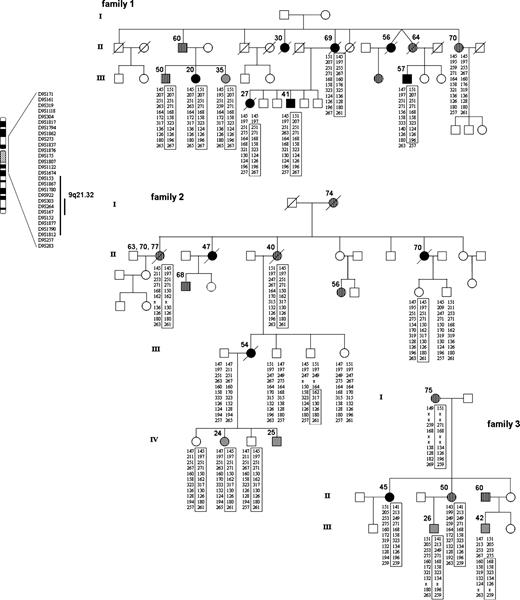
Pedigrees of families 1, 2, and 3. Solid black circles and squares indicate individuals with ocular malignant melanoma (OMM), gray symbols indicate individuals with cutaneous malignant melanoma (CMM), and hatched symbols indicate those with other cancers. Age at onset for each family member affected with cancer is shown. Family 1 had seven patients with OMM, one patient with CMM, and other malignancies, including lung cancer, OMM and breast cancer, gastric cancer, nonmelanoma skin cancer, penile cancer, and breast cancer. Family 2 had three patients with OMM, two patients with CMM, and other tumors, including ovarian cancer, nonmelanoma skin cancer and ovarian cancer, multiple nonmelanoma skin cancers, prostate cancer, and breast cancer. Family 3 included one patient with OMM, two patients with CMM, and other tumors, including breast and colon cancer, breast cancer, and cancer of unknown type. All diagnoses (except for one breast cancer case in family 2) were pathologically verified. Family 3 had additional cancers of unknown type in generation I (not shown). All OMM cases that were histologically verified were of choroidal type, and all CMM tumors were invasive. In all three families, CMM appeared exclusively in the youngest generation, affecting both males and females at an early age (range: 24–42 years, mean = 30.4 years). Alleles for markers in the 9q21.31–q21.33 region (which spans 8–10 Mbp) are shown. Haplotypes were determined by visual examination so as to minimize number of recombination events. Boxes indicate the shared haplotype and recombination events in each family. All OMM and CMM cases analyzed are haplotype carriers. Other types of cancer are also seen in haplotype carriers. One nonmelanoma skin cancer patient in family 1 did not carry the shared haplotype. Early-onset (<30 years) CMM cases are exclusively seen in the younger generation. OMM and CMM cases in family 1 and family 3 share a common haplotype over markers D9S303, D9S264, and D9S167 (as indicated). The participants gave written informed consent for a genome-wide scan and linkage analysis. The study was approved by the ethical committee of Lund University.
Genes previously known or suggested to be associated with melanoma predisposition, including CDKN2A, CDK4, BRCA1, and BRCA2, were excluded by mutation and linkage analysis in both families. Results of two-point parametric linkage analysis for melanoma susceptibility genes ( Fig. 2 ) show that of the 382 markers included in the 10 cM marker set, 17 had a LOD score greater than 1.0 that corresponded to 15 chromosomal regions. Strongest evidence for melanoma linkage was found at 1p34, 4p14, 9q21, and 14q12, including the 1p region, which has previously been associated with hereditary CMM and dysplastic nevus ( 4 ) . To narrow the regions of interest, more markers were added to fine-map and strengthen these 15 suggestive loci. However, with the exception of one region, the additional mapping reduced the two-point and multipoint LOD scores and/or resulted in nonsegregating haplotypes, excluding linkage.
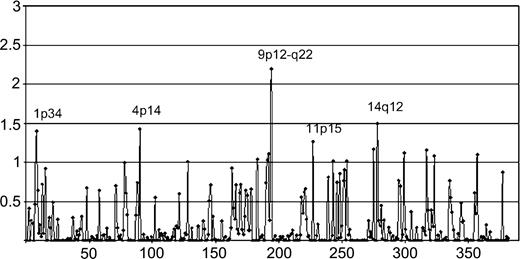
Results of maximum two-point parametric LOD scores from a genome-wide linkage analysis of families 1 and 2 for melanoma susceptibility genes are plotted (chromosomes 1–22, left to right). Analysis using an alternative approach, with 80% penetrance for disease allele carriers and 0% penetrance for noncarriers, was also conducted, resulting in very similar LOD scores.
The only region for which additional genotyping increased the evidence for melanoma linkage was at 9q21, which coincided with the region with the highest LOD score (2.2 at D9S167, P = .0007) in the genome-wide scan. Although that LOD score does not meet statistically significant evidence for linkage, simulation studies had shown that the observed peak LOD score was close to the maximum possible for these two families under the assumed genetic model (data not shown). Although both families showed linkage of melanoma to 9q21, family 1 was clearly more influential (LOD score of 1.8 at D9S167). Moreover, all affected (OMM or CMM) individuals in family 1 were found to share a common haplotype over a region between markers D9S153 and D9S1812 at 9q21.31–q21.33 ( Fig. 1 ). This region corresponds to a genetic distance of approximately 11 cM based on the Marshfield map ( http://research.marshfieldclinic.org/genetics ) and to a physical distance of approximately 7.7 Mbp (78.8–86.5 Mbp in the May UCSC 2004 assembly; http://www.genome.ucsc.edu ). Haplotype sharing was also seen for affected members of family 2 over a region defined by D9S161 and D9S283 (27.7–89.5 Mbp), but, intriguingly, none of the segregating alleles at any marker were the same in the two families, arguing against a rare genetic isolate or a local founder effect.
After the genome-wide scan conducted on families 1 and 2, we obtained a third family (family 3) for analysis. This family expresses a similar disease phenotype and also originated from the same geographic region in Western Denmark as the other two families ( Fig. 1 ). Genetic screening of family 3 also excluded mutations in CDKN2A, CDK4, BRCA1, and BRCA2. Five individuals from this family (including three members with OMM or CMM) were included for targeted linkage analysis using 9q21 markers from the region identified in families 1 and 2. Adding these five individuals to the analysis provided further evidence for linkage, increasing the maximum three-point parametric LOD score from 2.06 (D9S1817; nominal P = .00024 and genome-wide P = .385) to 2.95 (D9S167; nominal P = .00003 and genome-wide P = .086). Three adjacent markers had three-point LOD scores greater than 2.4 for the three families combined, and by using the information at these three loci in a four-point analysis, the maximum LOD score increased to 3.02 (D9S167). This four-point parametric LOD score corresponds to a nominal P value of .00003 and a genome-wide P value of .086, a value that is generally interpreted as suggestive of linkage ( 15 ) .
More importantly, family 3 was found to share a haplotype with family 1 for four central and highly polymorphic markers in the region; a recombination event in one affected member of family 3 reduced this haplotype to three markers, D9S303, D9S264, and D9S167 ( Fig. 1 ). The estimated relative frequencies for the segregating alleles were 26.5%, 38.0%, and 31.1%, respectively, indicating a rare haplotype. This common haplotype reduced the linked region to approximately 5 cM between boundary markers D9S922 and D9S152 at 9q21.32, which corresponds to a physical region of approximately 3 Mbp (80.2–83.3 Mbp). It also reduced the number of associated genes considerably, because only seven known or predicted genes are located within the region defined by the haplotype shared in families 1 and 3, compared with 21 known or predicted genes in the previously defined region. Four of the seven genes correspond to predicted transcripts with limited functional annotations, but three of the genes have a known or predicted cellular function of which two may be important in carcinogenesis. One gene, transducin-like enhancer of split 1 (TLE1), a homolog of the Drosophila Groucho protein, encodes a transcriptional corepressor that binds and inhibits several transcription factors such as FOXA2 and the NF-κB subunit RELA. TLE1 also interacts with TCF/LEF1, inhibiting transcriptional activation via Wnt–CTNNB1 ( 16 ) , a signaling pathway that has been implicated in melanoma progression ( 17 ) .
The second gene, RASEF (also known as RAB45 or FLJ31614) encodes a novel protein with calcium-binding EF-hand and Ras GTPase (Rab family) motifs ( http://www.genome.ucsc.edu ). Protein–protein BLAST ( http://www.ncbi.nlm.nih.gov/BLAST ) against the Swiss-Prot database reveals homology between RASEF and a melanoma transforming oncogene, c-MEL (also known as RAB8A, a member of the RAB8 family) ( 18 ) . Increased expression of Rab8 by pigment-stimulating agents like melanocyte-stimulating hormone and ultraviolet B radiation have been reported, and Rab8 has been observed to interact with Rab27 in regulating actin-dependent movement of melanosome organelles ( 19 , 20 ) . Although this finding suggests that disturbances in Rab8 affect melanocyte pigmentation and consequently, melanoma development, it remains to be demonstrated that RASEF has a similar function. Similarly, a link between RASEF and Ras oncogene function has been hypothesized. However, whether the Ras–Raf–MAP kinase signaling pathway that is constitutively activated in CMM but rare in OMM is related to RASEF is unknown ( 21 ) .
Moreover, a role of calcium-binding proteins in ocular cancers has been suggested. The expression of penta-EF hand protein ALG-2 (apoptosis-linked gene 2), which is required for programmed cell death in response to apoptotic agents, was found to be decreased in ocular melanoma cells compared with normal melanocytes ( 22 ) . Loss of apoptosis function is another hallmark of melanoma cells, making them notoriously resistant to chemotoxic drugs. Thus, the localization of a gene whose product encode a calcium-binding EF-hand and Rab-like Ras GTPase within a region linked to familial OMM and CMM is intriguing, making RASEF a candidate melanoma susceptibility gene.
Further evidence for 9q21 as a candidate susceptibility locus comes from the observation that OMM tumors from two affected members of family 1 exhibited loss of heterozygosity (LOH) for alleles on the nonsegregating chromosome between D9S1843 and D9S1812 and between D9S1817 and D9S1812, respectively, indicating that the putative susceptibility gene may encode a tumor suppressor. Because only formalin-fixed tumor tissue was available from the three families, we used frozen tissues from nonfamilial CMM metastatic lesions as well as from primary breast tumors (obtained from the tumor bank of the Department of Oncology, Lund University) for RNA isolation and quantified expression levels of RASEF by real-time quantitative polymerase chain reaction (PCR), in relation to the RASEF expression level in a pool of RNA from 10 different cell types ( Fig. 3 ). While similar levels of RASEF expression were observed across breast tumor samples, 70% of nonfamilial metastatic CMM tumors had reduced RASEF levels compared with those in the other melanoma and all breast tumor samples ( Fig. 3 ), suggesting that inactivation of this gene plays a role in CMM development. However, it is unclear whether these findings in nonfamilial melanoma tissue would extend to familial CMM tissue. Another limitation is that the RASEF expression levels were not compared with expression in tissue from normal skin but from pooled RNA from different cell types.
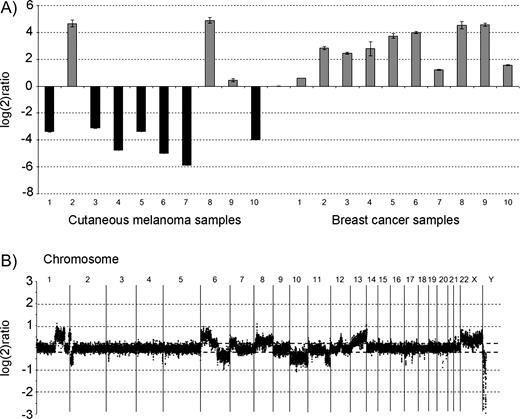
RASEF expression levels in sporadic cutaneous malignant melanomas (CMMs) and breast cancer tissue, and genomic profile of a sporadic CMM patient by comparative genomic hybridization (CGH). A ) RASEF expression levels in sporadic CMM tissue (n = 10) and breast cancer tissue (n = 10) samples (obtained from the tissue bank of Department of Oncology, Lund University) as measured by quantitative real-time polymerase chain reaction (PCR). Expression of RASEF was normalized to ribosomal RNA subunit 18S in each sample according to the ΔCt method ( 24 ) and compared with the normalized RASEF expression in Stratagene Universal Reference RNA (consisting of a pool of RNA from 10 different cell lines, including breast cancer, hepatoblastoma, cervical cancer, testicular embryonal carcinoma, glioblastoma, melanoma, liposarcoma, histiocytic lymphoma, lymphoblastic leukemia, and plasmacytoma, for broad gene coverage; Stratagene Corporation, La Jolla, CA) resulting in log 2 ratios ( y axis). The following protocols were used: Total RNA was extracted with Trizol (Invitrogen, Paisley, UK) reagent followed by RNeasy Midi purification kit (Qiagen, Crawley UK), quantified in spectrophotometer at 260 nm and tested for integrity in an Agilent Bioanalyzer (Agilent Technologies, Palo Alto, CA). Reverse transcription was carried out in a 20-μL volume using Superscript II with 2 μg of total RNA. Real-time PCR was performed in a Rotorgene (Corbett Research, Sydney, Australia) apparatus using Quantitect SYBR Green (Qiagen, Crawley, UK) master mix and the following primers: RASEF_F GAGGAAGCCCTCAGTGACCT; RASEF_R ATGCAGCCACATCTTCCTTT; 18S_F CGGCTACCACATCCAAGGAA; and 18S_R GCTGGAATTACC GCGGCT, designed using Primer3 software ( http://frodo.wi.mit.edu/cgi-bin/primer3/primer3_www.cgi ). B ) The genomic profile of a sporadic CMM patient, as determined by CGH analysis on a 32K BAC array. Gains were observed on chromosomes 1q, 6p, 8, 12, 13, and losses were noted on 2p, 6q, 10, 11q, and on other chromosomes. However, no copy number changes were seen on chromosome 9. High-resolution microarrays were produced from the 32K BAC clone library (CHORI BACPAC Resources; http://bacpac.chori.org/genomicRearrays.php ), which included a total of 32 433 clones (∼1240 clones from chromosome 9), providing a tiling coverage at an average 45-kb resolution over the genome. DOP–PCR products from the BAC DNA template were purified using 96-well filter plates, dried, and resuspended in 50% dimethyl sulfoxide to a concentration of 500–1000 ng/μL. Arrays were printed on UltraGAPS slides (Corning, NY) using a MicroGrid II spotter (Biorobotics, Cambridge, UK) as described in detail elsewhere (Jönsson et al., submitted 2005). One microgram of genomic DNA was labeled using random labeling (Invitrogen, Paisley, UK). Test DNA and male reference DNA were differentially labeled, pooled, mixed with human COT-1 DNA, dried down, and resuspended in a formamide-based buffer. Slides were hybridized under cover slips for 48–72 hours at 37 °C, washed ( 25 ) , and scanned (Agilent Technologies). Image analysis was done with Gene Pix Pro 4.0 software (Axon Instruments; Molecular Devices Corporation, Union City, CA) and data further analyzed with Bio Array Software Environment BASE (developed at Lund University) ( 26 ) . Background correction of Cy3 and Cy5 intensities was calculated using the median-feature and median-local background intensities provided in the quantified data matrix. Within arrays, intensity ratios for individual probes were calculated as background-corrected intensity of tumor sample divided by background-corrected intensity of reference sample. Signal-to-noise filters of at least 10 for the sample channel and at least 10 for the reference channel were applied to the data, and spots that failed to meet these criteria were excluded from further analysis and regarded as missing values. The filtered data were, for each array separately, centralized to a median ratio of unity. All filtering, normalization, and analysis was performed in BASE ( 26 ) . A moving median sliding window of three clones was used, and each clone was designated a new ratio value. Cutoff ratios for gains and losses were set to log 2 ratio of ±0.2.
To investigate whether 9q21 deletions can explain the reduced RASEF expression observed in sporadic CMM, we performed array comparative genomic hybridization (CGH) experiments using a high-resolution (<50 kb) BAC microarray. Surprisingly, although deletions were found at many genomic regions, including 9p, no evidence of 9q deletion was found in tumors with low RASEF expression. This result indicates that mechanisms other than physical deletion may be instrumental for gene inactivation ( Fig. 3 ).
Both RASEF and TLE1 encode several mRNAs using alternative promoters and exons ( http://www.ncbi.nih.gov/IEB/Research/Acembly ). In searching for germline mutations, we screened DNA from haplotype carriers in families 1 and 2 for sequence variants in the currently known coding exons of RASEF, TLE1, and other genes (FRMD3, UBQLN1 and GKAP) in the region linked to 9q21.32. This approach did not result in any segregating germline missense or protein truncating sequence variants (data not shown). The linked chromosomal region also overlaps with one of the recently discovered copy number polymorphisms, which include duplications or deletions of large genomic regions that would be missed by PCR-based analysis ( 23 ) . Consequently, we used array-CGH to examine germline DNA from the three families for such polymorphisms. Although we found evidence of a large deletion on chromosome 9, this deletion was centromeric to 9q21 and did not segregate with the disease-associated haplotype (data not shown). However, these results do not exclude either the possibility of mutations in unknown coding or intronic regions of the candidate genes or the presence of genomic deletions too small (<50 kb) to be detected by the current array-CGH platform.
In summary, three unique families with multiple cases of OMM (N = 11) and CMM (N = 5) showed linkage to 9q21.This study demonstrates the strength in genetic analysis of specific cancer syndromes, which may unravel a novel mechanism of carcinogenesis. However, these findings are based on a few families, and analysis of more families will be crucial to confirm the presence of a melanoma susceptibility gene on 9q21.32 Further steps will include functional studies of candidate genes.
Supported by the Swedish Cancer Society, the American Cancer Society, the Mrs. Berta Kamprad Foundation, the Gunnar Nilsson Cancer Foundation, the Franke and Margareta Bergqvist Foundation, the Lund University Hospital Foundations, the King Gustav V's Jubilee Foundation, the Harry J. Lloyd Charitable Trust, the Ingabritt and Arne Lundberg Foundation, the Swedish Foundation for Strategic Research, and the Knut and Alice Wallenberg Foundation via the SWEGENE program.
BAC clone DNA aliquots were obtained from Kazutoyo Osoegawa and Pieter de Jong, BACPAC Resources, Children's Hospital Oakland Research Institute, Oakland, CA.
References
Cannon-Albright LA, Goldgar DE, Meyer LJ, Lewis CM, Anderson DE, Fountain JW, et al. Assignment of a locus for familial melanoma, MLM, to chromosome 9p13-p22.
Zuo L, Weger J, Yang Q, Goldstein AM, Tucker MA, Walker GJ, et al. Germline mutations in the p16INK4a binding domain of CDK4 in familial melanoma.
Gillanders E, Juo SH, Holland EA, Jones M, Nancarrow D, Freas-Lutz D, et al. Localization of a novel melanoma susceptibility locus to 1p22.
Bale SJ, Dracopoli NC, Tucker MA, Clark WH Jr, Fraser MC, Stanger BZ, et al. Mapping the gene for hereditary cutaneous malignant melanoma-dysplastic nevus to chromosome 1p.
Holland EA, Beaton SC, Kefford RF, Mann GJ. Linkage analysis of familial melanoma and chromosome 6 in 14 Australian kindreds.
Walker GJ, Indsto JO, Sood R, Faruque MU, Hu P, Pollock PM, et al. Deletion mapping suggests that the 1p22 melanoma susceptibility gene is a tumor suppressor localized to a 9-Mb interval.
Singh AD, Topham A. Incidence of uveal melanoma in the United States: 1973–1997.
Vajdic CM, Hutchins AM, Kricker A, Aitken JF, Armstrong BK, Hayward NK, et al. Chromosomal gains and losses in ocular melanoma detected by comparative genomic hybridization in an Australian population-based study.
Parrella P, Fazio VM, Gallo AP, Sidransky D, Merbs SL. Fine mapping of chromosome 3 in uveal melanoma: identification of a minimal region of deletion on chromosomal arm 3p25.1-p25.2.
Easton DF, Steele L, Fields P, Ormiston W, Averill D, Daly PA, et al. Cancer risks in two large breast cancer families linked to BRCA2 on chromosome 13q12–13.
Kannengiesser C, Avril MF, Spatz A, Laud K, Lenoir GM, Bressac-de-Paillerets B. CDKN2A as a uveal and cutaneous melanoma susceptibility gene.
Terwilliger JD, Ott J. Handbook of human genetic linkage. Baltimore (MD) and London (UK): The Johns Hopkins University Press;
Kurbasic A, Hossjer O. On Computation of p-Values in Parametric Linkage Analysis.
Angquist L, Hossjer O. Improving the calculation of statistical significance in genome-wide scans. Biostatistics Advance Access, published on April 14,
Kruglyak L, Daly MJ, Reeve-Daly MP, Lander ES. Parametric and nonparametric linkage analysis: a unified multipoint approach.
Levanon D, Goldstein RE, Bernstein Y, Tang H, Goldenberg D, Stifani S, et al. Transcriptional repression by AML1 and LEF-1 is mediated by the TLE/Groucho corepressors.
Weeraratna AT, Jiang Y, Hostetter G, Rosenblatt K, Duray P, Bittner M, et al. Wnt5a signaling directly affects cell motility and invasion of metastatic melanoma.
Padua RA, Barrass N, Currie GA. A novel transforming gene in a human malignant melanoma cell line.
Chakraborty AK, Funasaka Y, Araki K, Horikawa T, Ichihashi M. Evidence that the small GTPase Rab8 is involved in melanosome traffic and dendrite extension in B16 melanoma cells.
Chabrillat ML, Wilhelm C, Wasmeier C, Sviderskaya EV, Louvard D, Coudrier E. Rab8 regulates the actin-based movement of melanosomes.
Rimoldi D, Salvi S, Lienard D, Lejeune FJ, Speiser D, Zografos L, et al. Lack of BRAF mutations in uveal melanoma.
Subramanian L, Polans AS. Cancer-related diseases of the eye: the role of calcium and calcium-binding proteins.
Sebat J, Lakshmi B, Troge J, Alexander J, Young J, Lundin P, et al. Large-scale copy number polymorphism in the human genome.
Favy DA, Lafarge S, Rio P, Vissac C, Bignon YJ, Bernard-Gallon D. Real-time PCR quantification of full-length and exon 11 spliced BRCA1 transcripts in human breast cancer cell lines.
Snijders AM, Nowak N, Segraves R, Blackwood S, Brown N, Conroy J, et al. Assembly of microarrays for genome-wide measurement of DNA copy number.

