


Abstract
Background: Microscopic human cancers can remain dormant for life. Tumor progression depends on sequential events, including a switch to the angiogenic phenotype, i.e., initial recruitment of new vessels. We previously demonstrated that human tumors contain tumor cell populations that are heterogeneous in angiogenic activity. Here, we separated angiogenic from nonangiogenic human tumor cell populations and compared their growth. Methods: Severe combined immunodeficient (SCID) mice were inoculated with nonangiogenic human MDA-MB-436 breast adenocarcinoma, KHOS-24OS osteosarcoma, or T98G glioblastoma cells. Most of the resulting tumors remained microscopic (<1 mm diameter), but some eventually became angiogenic and enlarged and were used to isolate angiogenic tumor cells. Angiogenic and nonangiogenic tumor cells were inoculated into SCID mice, and time to the development of palpable tumors was determined. Cell proliferation was assayed in vitro by growth curves and in vivo by staining for proliferating cell nuclear antigen or Ki67. Microscopic tumors from both tumor cell populations were examined for histologic evidence of vascular development 14 days after inoculation in mice. Expression of the angiogenesis inhibitor thrombospondin-1 was examined by immunoblotting. Results: Nonangiogenic tumors of each tumor type developed palpable tumors after means of 119 days (range: 53–185 days) for breast cancer, 238 days (184–291 days) for osteosarcoma, and 226 days (150–301 days) for glioblastoma. Angiogenic cells developed palpable tumors within 20 days after inoculation. However, nonangiogenic and angiogenic cells of each tumor type had similar proliferation rates. Fourteen days after tumor cell inoculation, tumors from angiogenic cells showed evidence of functional vasculature. In contrast, nonangiogenic tumors remained microscopic in size with absent or nonfunctional vasculature. Thrombospondin-1 expression was statistically significantly lower (by five- to 23-fold, depending on tumor type) in angiogenic than nonangiogenic cells. Conclusions: This model provides a conceptual framework and a reproducible in vivo system to study unresolved central questions in cancer biology regarding the initiation, reversibility, and molecular regulation of the timing of the angiogenic switch.
The online version of this article has been published under an Open Access model. Users are entitled to use, reproduce, disseminate, or display the Open Access version of this article for non-commercial purposes provided that: the original authorship is properly and fully attributed; the Journal and Oxford University Press are attributed as the original place of publication with the correct citation details given; if an article is subsequently reproduced or disseminated not in its entirety but only in part or as a derivative work this must be clearly indicated. For commercial re-use, please contact: journals.permissions@oxfordjournals.org .
Multiple events are involved in cancer progression. One such event is angiogenesis; it is well established that tumor growth beyond the size of 1–2 mm is angiogenesis dependent ( 1 – 4 ) . Autopsy studies in individuals who died of trauma without having had cancer diagnosed in their lifetime have shown a high frequency of microscopic cancers in various organs, e.g., breast, prostate, and thyroid ( 5 , 6 ) . Only a small proportion (<0.5%) of such lesions will eventually present as clinical cancers ( 2 , 6 , 7 ) . One possible explanation for these observations is that most human tumors arise in the absence of angiogenic activity and exist in a microscopic dormant state for months to years without neovascularization. We have proposed ( 2 , 4 ) that diagnosed tumors are those that have switched to the angiogenic phenotype, i.e., that have initiated recruitment of new vessels. Once a tumor has undergone surgical treatment or other forms of therapy, local or metastatic recurrences may also be attributed to the switch to the angiogenic phenotype in otherwise microscopic dormant tumors ( 8 – 13 ) . Despite the clinical importance of this phenomenon, the biology of tumor dormancy is poorly understood.
Several animal models have been developed to study tumor dormancy. Hanahan et al. ( 14 ) described a spontaneous tumor model (RIP1-Tag2) in transgenic mice, in which autochthonous tumors arise in the pancreatic islets as a result of the expression of the simian virus 40 T antigen (Tag) oncogene. In this model, only 4% of tumors are angiogenic, i.e., contain evidence of neovascularization, after 13 weeks, whereas the remaining 96% remain microscopic and nonangiogenic ( 15 , 16 ) . The spontaneous progression of nonangiogenic lesions to the angiogenic phenotype in these tumor-bearing mice was termed the “angiogenic switch.”
The angiogenic switch has also been documented in human tumors. For example, we have shown that human cancers contain subpopulations of tumor cells that differ in their angiogenic potential ( 17 ) . Transfection of nonangiogenic human tumor cells with an activated Ras oncogene resulted in their switch to the angiogenic phenotype in a mouse model of human osteosarcoma dormancy ( 18 ) . In these previous animal models of human tumor dormancy, the angiogenic and nonangiogenic tumor cell populations were derived from either single-cell clones or from genetically modified tumor cells [i.e., Ras-transfected dormant cells ( 17 – 19 ) ].
To better understand the pathogenesis and timing of the angiogenic switch in human tumors, we developed a novel approach in which we created separate populations of nonangiogenic and angiogenic tumor cells in vivo without using molecular alterations. We used this approach to study three different human cancer types in severe combined immunodeficient (SCID) mice: breast cancer, osteosarcoma, and glioblastoma. For angiogenic and nonangiogenic populations of each tumor type, we compared proliferation rates in vitro and in vivo and determined ratios of proliferation to apoptosis. The angiogenic switch in vivo was characterized by examining changes in the vasculature.
M ETHODS
Establishment of Nonangiogenic and Angiogenic Human Cancer Cell Lines
Human breast adenocarcinoma (MDA-MB-436), osteosarcoma (KHOS-24OS), glioblastoma (T98G), and human embryonic kidney (293T) cell lines were obtained from the American Type Culture Collection (ATCC, Manassas,VA) and confirmed to be free of mycoplasma. The breast carcinoma, osteosarcoma, and glioblastoma cell lines were defined as nonangiogenic based on: 1) the absence of angiogenic activity, as evidenced by repulsion of existing blood vessels and/or absence of microvessels within the tumor; 2) their growth to only approximately 1 mm in diameter or less in vivo, at which time further expansion stopped; 3) the apparent absence of “tumor take” for at least 130–238 days, until the emergence of the angiogenic phenotype; and 4) the fact that the tumors remained harmless to the host until they switched to the angiogenic phenotype.
In mice injected with nonangiogenic human tumor cells (i.e., the cell lines as originally obtained from ATCC), occasional tumors grew for each of the three cancer types following a prolonged dormancy period. These vascularized tumors were removed under sterile conditions, and tumor cell lines were established from them using standard tissue culture techniques. The cell lines derived from the nonangiogenic (i.e., dormant) tumors that had switched to the angiogenic phenotype were called “angiogenic” because they produced large angiogenic tumors (up to 2000 mm 3 ) within 1 month of their subsequent inoculation into mice. For breast cancer, a single cell–derived clone, designated clone A1, was also isolated from the angiogenic subpopulation. This clone formed occasional angiogenic tumors following a prolonged dormancy period.
All cell lines were maintained in tissue culture (37 °C, 5% CO 2 , humidified atmosphere). Breast cancer MDA-MB-436 cells were maintained in Dulbecco's modified Eagle medium (DMEM; Invitrogen, Carlsbad, CA) supplemented with 10% fetal bovine serum (FBS; Invitrogen). Osteosarcoma KHOS-24OS cells were maintained in Minimum Essential Medium (MEM; Invitrogen) supplemented with 10% FBS and 0.1 mM nonessential amino acids. Brain tumor T98G cells were maintained in MEM supplemented with 10% FBS, 0.1 mM nonessential amino acids, and 1 mM sodium pyruvate. For in vivo experiments, subconfluent monolayers of tumor cells were harvested by trypsinization and resuspended in DMEM to a final concentration of 2.5 × 10 7 cells/mL.
In Vitro Tumor Cell Proliferation
In vitro growth curves were generated by plating 5 × 10 4 cells in 60-mm dishes in triplicate. The cells were counted daily over a 7-day period. In an additional experiment, cells were collected during the exponential growth phase for subsequent histologic characterization (staining for Ki67).
Anchorage-Independent Growth In Vitro
For all three cancer types, the ability of nonangiogenic and angiogenic cells to undergo anchorage-independent growth was compared. In brief, 10 4 cells were suspended in 5 mL of 0.4% agar and plated in triplicate on 10-cm plates that had been precoated with 4 mL of 0.6% agar. An immortalized and transformed human kidney cell line (293T) was used as a positive control. Plates were monitored every other day, and when colonies became evident (after 3 weeks), plates were incubated for 8 hours with 2 mL of thiazolyl blue tetrazolium bromide (MTT) (Sigma, St. Louis, MO) to visualize viable cell colonies. The number of colonies was then counted from 10 digital images of random high-power fields for each plate.
Subcutaneous Tumor Growth
SCID male mice aged 6–8 weeks (Massachusetts General Hospital, Boston) were used for in vivo studies and were cared for in accordance with the standards of the Institutional Animal Care and Use Committee (IACUC) under a protocol approved by the Animal Care and Use Committee of the Children's Hospital Boston. Mice were anesthetized using a 2% isoflurane (Baxter, Deerfield, IL) inhalation oxygen mixture. Suspensions of 5 × 10 6 human breast cancer (MDA-MB-436), osteosarcoma (KHOS-24OS), or glioblastoma (T98G) cells in 0.2 mL of DMEM were then inoculated subcutaneously into the lower-right quadrant of the flank of each mouse. For in vivo characterization of the dormancy period, we inoculated mice as follows: 21 mice were inoculated with nonangiogenic breast cancer cells, 11 mice with angiogenic breast cancer cells, and 12 mice with nonangiogenic clone A1 tumor cells; 18 mice with nonangiogenic osteosarcoma cells and 11 mice with angiogenic osteosarcoma cells; five mice with nonangiogenic glioblastoma cells and five mice with angiogenic glioblastoma cells. Mice were monitored every other day for palpable tumors at the site of tumor cell inoculation. Tumors could be detected by palpation in these shaved SCID mice once the tumors reached approximately 50 mm 3 . Once tumors became palpable, tumor size was measured twice a week. Mice were killed by cervical dislocation when the tumor size reached approximately 1200 mm 3 . To assess tumor growth kinetics, tumors were measured from the time that they were first palpable until they reached 500 mm 3 . Mice that did not form palpable tumors were monitored for tumor growth for up to 350 days after tumor cell inoculation. The number and proportion of angiogenic tumors that had switched from dormancy was compared between all three cancer types at day 160 after tumor cell inoculation. Representative mice were killed at various time points for histology of microscopic and macroscopic tumors (for example, at 14, 47, and 77 days after tumor cell inoculation).
Additional mice were inoculated with 5 × 10 6 MDA-MB-436 breast cancer cells for morphologic and histologic analysis as follows: 25 mice were inoculated with angiogenic, 30 mice with nonangiogenic, and 30 mice with nonangiogenic clone A1 breast cancer cells. Tumor cell proliferation and apoptosis were analyzed at the following intervals: 4–7 days (10 mice) and 29–40 days (10 mice) after inoculation with angiogenic tumor cells; 4–14 days (15 mice) and 40–70 days (10 mice) after inoculation with nonangiogenic tumor cells, and 4–15 days (15 mice) and 40–70 days (10 mice) after inoculation with nonangiogenic clone A1 breast cancer cells.
Histology and Immunohistochemistry
Tumor tissue was excised from mice killed by cervical dislocation, rinsed in ice-cold phosphate-buffered saline (PBS), fixed in 4% paraformaldehyde, and embedded in paraffin. Representative 4-μm tumor cross-sections were cut from paraffin-embedded tissue, and sets of four adjacent sections were stained as follows: 1) To identify proliferating cells, section 1 was stained with a 1 : 150 dilution of PC10 monoclonal antibody (DAKO, Carpinteria, CA) against proliferating cell nuclear antigen or with a 1 : 50 dilution of the monoclonal antibody against Ki-67 (M7240, clone MIB-1; DakoCytomation, Copenhagen, Denmark) after antigen retrieval for 20 minutes in citrate buffer in a microwave at 500 W; 2) To evaluate tissue quality and tumor morphology, section 2 was stained with hematoxylin and eosin; 3) To assess fragmented DNA, section 3 was labeled by the terminal deoxynucleotidyl transferase biotin–dUTP nick-end labeling (TUNEL) technique (ApopTag kit, Intergen, Purchase, NY) according to the method of Gavrielli et al. ( 20 ) ; 4) To identify endothelial cells, section 4 was stained with a 1 : 250 dilution of anti-CD31 antibody (Pecam; BD Biosciences, San Diego, CA) after antigen retrieval by Proteinase K treatment. Necrotic areas were avoided for all histologic analyses.
In Vivo Permeability Assay
A modified Miles assay ( 21 ) was performed to investigate differences in vascular permeability in size-matched nonangiogenic and angiogenic tumors. Five mice per group were inoculated with 5 × 10 6 angiogenic, nonangiogenic, or nonangiogenic clone A1 human breast cancer cells. The modified Miles assay was performed at day 14 after tumor cell inoculation. Mice were anesthetized by intraperitoneal injection of Avertin (150 mg/kg of body weight) and were then inoculated intravenously with filtered Evans blue solution (100 μL of 1% in PBS per mouse), which was allowed to circulate systemically for 30 minutes while the mice were maintained at 30 °C. All mice were then perfused systemically with PBS (pH 7.4) for 3 minutes at a pressure of 120 mm Hg from an 18-gauge cannula that was inserted into the aorta via an incision in the left ventricle. The right atrium was then incised to create a route for the saline to escape. Patches of the dorsal skin of each mouse were harvested to permit visualization of dye leakage from blood vessels to subcutaneous tumor tissues, to the skin overlying the tumor, and to control skin from the contralateral flank (this perfusion ensured that no dye remained in the vascular lumen). For each mouse, three types of tissues (tumor, overlying and control skin) were excised, weighed, and placed in 1 mL of formamide (Sigma) for 5 days at room temperature to extract all dye from the tissues. The extracted dye was quantified by measuring optical density at 620 nm of the formamide at the end of the 5-day incubation. All optical densitometry values were normalized to tumor (or skin) tissue weight.
ELISA Quantification of Secreted VEGF 165 , bFGF, and Thrombospondin-1
Nonangiogenic and angiogenic tumor cells from each of the three cancer types were plated in triplicate (5 × 10 6 cells/15 cm plate) in 15 mL of DMEM supplemented with 10% FBS. After 24 hours, the medium was replaced with 15 mL of serum-free medium. The medium was then collected, and enzyme-linked immunosorbent assay (ELISA) kits were used to determine concentrations of human vascular endothelial growth factor (VEGF 165 ; R&D, Minneapolis, MN), basic fibroblast growth factor (bFGF; R&D), and thrombospondin-1 (CYT Immune Science, College Park, MD) according to the manufacturers' protocols. For each sample, blank values (i.e., those for serum-free media) were subtracted, and mean results were normalized per 10 4 cells. This assay was performed in triplicate.
Protein Extraction and Immunoblot Analysis
Angiogenic and nonangiogenic breast cancer cells (MDA-MB-436) were grown in 10-cm tissue culture plates in DMEM supplemented with 10% FBS. When cells reached 80% confluence, half the plates were treated with the phosphoinositide 3-kinase (PI3K) inhibitor LY294002 (Calbiochem, San Diego, CA) at a final concentration of 10 μM in DMEM with 0.1% FBS for 12 hours. The remaining plates were untreated. For immunoblotting, cells were harvested by mechanical scraping into 4 °C PBS. Cell pellets were then lysed in 50 mM Tris–HCl (pH 7.4), 150 mM NaCl, 1% NP40, 1 mM sodium orthovanadate, 5 mM NaF, 20 mM β-glycerophosphate, and complete protease inhibitor (Roche, Indianapolis, IN). Fifty micrograms of protein was loaded in the wells of a 4%–12% precast Bis–Tris gel (BioRad, Hercules, CA). Membranes were blocked with 5% nonfat milk and incubated with primary antibodies to c-Myc (Abcam, Cambridge, UK), phospho-Myc (Cell Signaling Technology, Beverly, MA), thrombospondin-1 (LabVision, Fremont, CA), and β-actin (Abcam, Cambridge, MA). Antibody binding was detected by incubating blots with horseradish peroxidase–conjugated secondary antibodies, either goat anti–mouse (c-Myc, thrombospondin-1, and β-actin) or goat anti–rabbit (p-Myc) (Jackson Immunoresearch Labs, West Grove, PA). Bands were visualized with enhanced chemiluminescence reagent (Pierce, Rockford, IL).
Statistical Analysis
The time to development of a palpable tumor (i.e., after tumor cell inoculation) was used as the endpoint of the dormancy period in survival analyses. For each of the three tumor types, times to palpable tumor for the angiogenic, nonangiogenic, and nonangiogenic clone A1 (breast cancer) cells were compared using the Kaplan–Meier product limit method ( 22 ) . Confidence intervals around estimated survival curves were calculated using Greenwood's formula ( 22 ) . In a subgroup analysis, we compared time to palpation for angiogenic breast carcinoma, osteosarcoma, and glioblastoma tumor cell populations. The log-rank test was used to compare the statistical significance of differences between survival curves ( 23 ) . For tumors that switched to the angiogenic phenotype, we compared the median times from initial tumor palpation (i.e., from a size of approximately 50 mm 3 ) until the tumor reached a size of 500 mm 3 using the nonparametric Mann–Whitney U test. The Student's t test was used to compare angiogenic and nonangiogenic tumor cell lines with respect to continuous data including in vitro tumor cell doubling times, anchorage-independent growth, vascular permeability, and ELISA. Two-tailed P values less than .05 were considered statistically significant. Statistical analyses were performed with the SPSS package (version 13.0 SPSS, Chicago, IL).
R ESULTS
In Vitro Growth of Nonangiogenic and Angiogenic Tumor Cells
In vitro assessment of doubling times of all three cancer types showed no statistically significant difference between the nonangiogenic and angiogenic cell lines ( Fig. 1, A–C ). During the exponential tumor cell proliferation phase, approximately 90% of both nonangiogenic and angiogenic breast cancer cells expressed comparable levels of Ki-67 protein (data not shown).
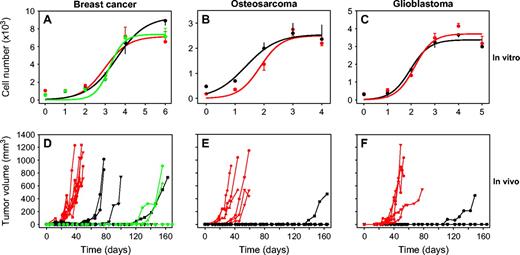
In vitro and in vivo growth of nonangiogenic and angiogenic tumor cells of three cancer types. In vitro growth (panels A–C ) and in vivo subcutaneous tumor growth ( D–F ) of angiogenic ( red ), nonangiogenic ( black ), and nonangiogenic clone A1 ( green ) human MDA-MB-436 breast cancer ( A, D ), KHOS-24OS osteosarcoma ( B, E ), and T98G glioblastoma ( C, F ) cell lines. For in vitro growth curves, each line represents a mean number of cells from three independent replicate assays with error bars denoting 95% confidence intervals. For growth of subcutaneous tumors, each line represents a single mouse. Numbers of mice were as follows: angiogenic breast cancer, n = 7; nonangiogenic breast cancer, n = 5; nonangiogenic breast cancer clone A1, n = 5; angiogenic osteosarcoma, n = 6; nonangiogenic osteosarcoma, n = 8; angiogenic glioblastoma, n = 5; nonangiogenic gliobastoma, n = 5. Day of tumor cell inoculation was designated as day 0. Mice inoculated with nonangiogenic cells that did not develop palpable tumors by 160 days were monitored for up to 350 days.
We then analyzed the differences in anchorage-independent growth between nonangiogenic and angiogenic tumor cells for all three tumor types ( Fig. 2 ). Both nonangiogenic and angiogenic subpopulations of the breast carcinoma, osteosarcoma, and glioblastoma formed colonies 3 weeks after plating in soft agar with no statistically significant differences (all P >.05) in the number of colonies formed.
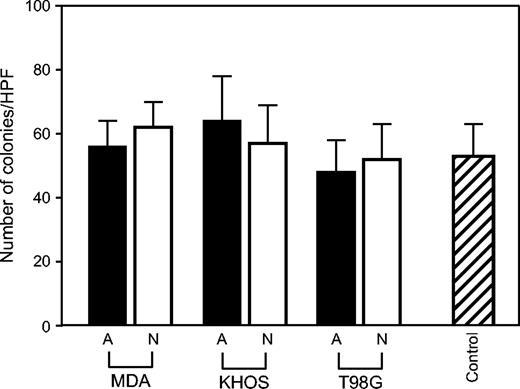
Anchorage-independent in vitro growth of nonangiogenic and angiogenic cells of three cancer types. Colony formation was assessed by a standard soft agar assay. Number of colonies (in soft agar) per high power field of view (HPF) is shown for both angiogenic ( A; black bars ) and nonangiogenic ( N; white bars ) cells of MDA-MB-436 (MDA; breast cancer), KHOS-24OS (KHOS; osteosarcoma), and T98G (glioblastoma). For a control, 293T cells were used. Data represent mean values with error bars denoting the upper limit of the 95% confidence intervals.
Subcutaneous Tumor Growth
To investigate in vivo tumor growth, we inoculated mice with either angiogenic or nonangiogenic cells from each cancer type and monitored them for as long as 350 days. Additional mice were inoculated with the nonangiogenic clone A1 breast cancer cells. The number and proportion of angiogenic tumors that had switched from dormancy within a period of 160 days after tumor cell inoculation was determined for all mice. For breast carcinoma, palpable tumors developed in all seven mice inoculated with angiogenic cells, in four of the five mice inoculated with nonangiogenic cells, and in three of the eight mice inoculated with nonangiogenic clone A1 cells. For osteosarcoma, angiogenic tumors developed in all six mice inoculated with angiogenic cells and in one of the eight mice inoculated with nonangiogenic cells. For glioblastoma, angiogenic tumors developed in all five mice inoculated with angiogenic cells and in one of the five mice inoculated with nonangiogenic cells ( Fig. 1, D–F ).
Kaplan–Meier analysis was used to compare the time between inoculation of tumor cells and detection of palpable tumors for nonangiogenic and angiogenic cell populations of all three cancer cell lines ( Fig. 3 ). This analysis accounted for those mice in which tumor cells switched to the angiogenic phenotype and formed tumors as well as those mice that remained free of palpable tumor for a prolonged time and were censored at various time points during the dormancy period for histological analysis (as denoted by tick marks along the Kaplan–Meier curves in Fig. 3 ). The mean times between tumor cell inoculation and the development of palpable tumors (i.e., tumors of approximately 50 mm 3 ) were 19 days (95% confidence interval [CI] = 16 to 22 days) in mice (n = 11) inoculated with angiogenic breast cancer cells, 119 days (95% CI = 53 to 185 days) in mice (n = 21) inoculated with nonangiogenic cells (log-rank P <.001), and 234 days (95% CI = 199 to 269 days) in mice (n = 12) inoculated with nonangiogenic clone A1 breast cancer cells (log-rank P <.001 for comparison with angiogenic cells). Mean times to develop palpable tumors were 21 days (95% CI = 18 to 25 days) in mice (n = 11) inoculated with angiogenic osteosarcoma cells and 238 days (95% CI = 184 to 291 days) for mice (n = 18) inoculated with nonangiogenic osteosarcoma cells (log-rank P <.001). Finally, mean times to palpable tumor were 20 days (95% CI = 16 to 24 days) for mice (n = 5) inoculated with angiogenic glioblastoma cells and 226 days (95% CI = 150 to 301 days) for mice (n = 5) inoculated with nonangiogenic glioblastoma cells (log-rank P = .002). By contrast, comparison of time to develop a palpable tumor for angiogenic tumor cell populations of the three cancer types showed no differences ( P = .15). Similar dormancy times were observed for the breast and glioblastoma tumors when inoculated orthotopically in the mammary fat pad or brain (George Naumov, unpublished data).
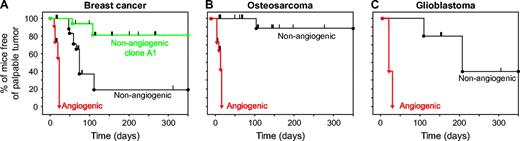
Kaplan–Meier analysis of time from tumor cell inoculation to palpable tumor detection. The persistence of mice free of palpable tumors was represented using the Kaplan–Meier analysis. Mice were inoculated with either angiogenic or nonangiogenic tumor cell lines: ( A ) Breast cancer MDA-MB-436 (angiogenic, n = 11 mice; nonangiogenic, n = 21; nonangiogenic clone A1, n = 12). ( B ) Osteosarcoma KHOS-24OS (angiogenic, n = 11; nonangiogenic, n = 18). ( C ) T98G glioblastoma (angiogenic, n = 5; nonangiogenic, n = 5). A drop in the curve indicates the occurrence of a palpable tumor at the corresponding time since tumor cell inoculation. Tick marks denote mice euthanized for histologic analysis that had not developed a palpable tumor at that time (i.e., censored data). Log-rank tests for differences between angiogenic and nonangiogenic cell populations yielded P <.001 for breast cancer and osteosarcoma and P = .002 for glioblastoma.
To determine whether tumors from nonangiogenic cells, once they emerge from dormancy, have growth kinetics similar to those of tumors from angiogenic cells, we assessed the kinetics of tumor growth in mice that developed palpable tumors from both angiogenic and nonangiogenic cell lines of each cancer type (including for breast cancer, clone A1). For this analysis, we determined the time from the detection of a palpable tumor to the time tumors reached 500 mm 3 . For breast cancer, the median times to reach 500 mm 3 were 22 days (range = 11–36 days, n = 7) for angiogenic cell populations and 38 days (range = 25–51 days, n = 4) for nonangiogenic cell subpopulations. For osteosarcoma, median times to reach this size were 30 days (range = 17–33 days, n = 6) and 25 days (n = 1) for angiogenic and nonangiogenic cell subpopulations, respectively. For glioblastoma, median times were 26 days (range = 21–61 days, n = 5) and 39 days (range = 25–43 days, n = 2) for angiogenic and nonangiogenic cell subpopulations, respectively. There were no differences in the time to reach 500 mm 3 between nonangiogenic and angiogenic subpopulations for any of the three cancer cell types, indicating that, after a tumor emerged from dormancy (i.e., in mice inoculated with the nonangiogenic tumor cells), its growth rate was comparable to that of angiogenic tumors regardless of the length of the dormancy period.
Histologic Differences Between Nonangiogenic and Angiogenic Tumors
We analyzed tumors for evidence of blood vessels on day 14 after tumor cell inoculation, when mice inoculated with either the angiogenic or nonangiogenic tumor cells had only microscopic tumors ( Fig. 4, A, C, D ), and when tumors reached 1000–2000 mm 3 ( Fig. 4, B, E ). Fig. 4 shows results for breast cancer cells; results for osteosarcoma and glioblastoma were similar (data not shown). At day 14 after inoculation, angiogenic tumors (i.e., derived from angiogenic cell lines), although still less than 1 mm in diameter, contained functional blood microvessels that were CD31 positive ( Fig. 4, K ) and were filled with red blood cells ( Fig. 4, F ). By contrast, at the same time point nonangiogenic tumors either lacked vasculature (CD31 negative, Fig. 4, H, M ) or contained sparse microvessels that lacked red blood cells ( Fig. 4, I, N ). At this early time point, nonangiogenic tumors either appeared white or contained microvessels mainly at the periphery of the lesion by gross examination ( Fig. 4, C, D ). By contrast, all angiogenic tumors appeared red and vascularized by gross examination ( Fig. 4, A ). Histologic examination of the nonangiogenic tumors at day 14 after inoculation showed that a minority of tumors (<10%) were completely avascular with no evidence of intratumoral endothelial cells, as demonstrated by absence of CD31 staining ( Fig. 4, M ); most tumors showed histologic evidence of undeveloped (CD31 positive) microvasculature that lacked lumens, had no red blood cells ( Fig. 4, I ), and possibly contained a few blind vascular sprouts that were CD31 positive ( Fig. 4, N ). Macroscopic tumors that had spontaneously switched to the angiogenic phenotype in mice inoculated with nonangiogenic tumor cells showed histologic evidence of vessels with open lumens ( Fig. 4, O ) that were filled with red blood cells ( Fig. 4, J ), similar to the microvasculature of tumors derived from angiogenic cell lines ( Fig. 4, G, L ).
![Histologic analysis of tumors from nonangiogenic and angiogenic human MDA-MB-436 breast cancer cells. Photomicrographs of representative tumors are shown at day 14 ( panels A, C, D ) and day 47 or 77 ( panels B, E ) after inoculation for both nonangiogenic and angiogenic tumor variants (human breast cancer). Panels A and B represent microscopic and macroscopic tumors generated from angiogenic tumor cell lines, respectively. Panels C and D represent microscopic tumors, generated from a nonangiogenic tumor cell line, that differ in morphologic appearance. Panel E represents a macroscopic tumor, generated from a nonangiogenic cell line, that has spontaneously switched to the angiogenic phenotype from tumor dormancy. For each tumor, representative hematoxylin and eosin–stained sections ( F–J ) and CD31-stained sections ( K–O ) in high power field of views (×400) are shown. At day 14 after inoculation, angiogenic tumors (although still less than 1 mm in diameter) contained functional blood microvessels that were CD31 positive ( K ) and were filled with red blood cells ( F ). At the same time point, size-matched nonangiogenic tumors either lacked vasculature (absence of CD31 stain [ M ] and red blood cells [ H ]) or contained microvessels ( N ) that were not filled with red blood cells ( I ). Ratios of tumor cell proliferation to apoptosis were determined by immunohistochemical staining for Ki67 and terminal deoxynucleotidyl transferase biotin–dUTP nick-end labeling (TUNEL). These ratios were statistically significantly lower for microscopic than macroscopic tumors from the nonangiogenic cell line ( P = .002) but not for the angiogenic line or nonangiogenic clone A1. Bars represent means based on at least 10 independent mice, with upper 95% confidence intervals.](https://oup.silverchair-cdn.com/oup/backfile/Content_public/Journal/jnci/98/5/10.1093_jnci_djj068/2/m_jncidjj068f04_4c.jpeg?Expires=1716374874&Signature=GFy1odLUFPcaGQDjBmjalTqNJLWEcC9p6ndjCaH96ANiuc-LnjQQl~9UCCkUPsqAEyaNvQwSKDX3ILIgILvn6Qk8OMbfhKPo7TQ4yOaSgHNR31bry4a5vDRdyJ4y~RFry3qCtxq274NViC4aWLbTsrNCbMdMkb0nQ2MjzuJA5c4q3HoJIlr78Q-1Ng194FWHS0c8nIL17VSaHyXKkkMi~psecLojet85UsdGmBAnkEOC51UlJoOKpaAuKcqYfUTSIT1khjkdS6WvPP274cN5HaqVYZp~jqY9fTEGzkI9XVyTfm2EAAGdr2CgPfVbsrPZcXlF8ibh2Y2gjlFBm5K3Mw__&Key-Pair-Id=APKAIE5G5CRDK6RD3PGA)
Histologic analysis of tumors from nonangiogenic and angiogenic human MDA-MB-436 breast cancer cells. Photomicrographs of representative tumors are shown at day 14 ( panels A, C, D ) and day 47 or 77 ( panels B, E ) after inoculation for both nonangiogenic and angiogenic tumor variants (human breast cancer). Panels A and B represent microscopic and macroscopic tumors generated from angiogenic tumor cell lines, respectively. Panels C and D represent microscopic tumors, generated from a nonangiogenic tumor cell line, that differ in morphologic appearance. Panel E represents a macroscopic tumor, generated from a nonangiogenic cell line, that has spontaneously switched to the angiogenic phenotype from tumor dormancy. For each tumor, representative hematoxylin and eosin–stained sections ( F–J ) and CD31-stained sections ( K–O ) in high power field of views (×400) are shown. At day 14 after inoculation, angiogenic tumors (although still less than 1 mm in diameter) contained functional blood microvessels that were CD31 positive ( K ) and were filled with red blood cells ( F ). At the same time point, size-matched nonangiogenic tumors either lacked vasculature (absence of CD31 stain [ M ] and red blood cells [ H ]) or contained microvessels ( N ) that were not filled with red blood cells ( I ). Ratios of tumor cell proliferation to apoptosis were determined by immunohistochemical staining for Ki67 and terminal deoxynucleotidyl transferase biotin–dUTP nick-end labeling (TUNEL). These ratios were statistically significantly lower for microscopic than macroscopic tumors from the nonangiogenic cell line ( P = .002) but not for the angiogenic line or nonangiogenic clone A1. Bars represent means based on at least 10 independent mice, with upper 95% confidence intervals.
Next, we analyzed breast tumor cell proliferation and apoptosis to determine whether tumor dormancy resulted from tumor cell quiescence. Histologic studies of tumors generated from the angiogenic cell line revealed similar ratios of tumor cell proliferation to apoptosis in tumors generated up to 14 days after inoculation and in tumors that had reached a size of more than 1000 mm 3 (around day 40). For tumors generated from the angiogenic breast cancer cell line, the mean ratios of Ki-67 stain to TUNEL assay results, in arbitrary units, were 7.6 (95% CI = 4.8 to 10.4) for 14-day microscopic tumors and 6.3 (95% CI = 3.8 to 8.8) for 40-day macroscopic tumors (not statistically significantly different, P = .43) ( Fig. 4, P ). Similar ratios were observed in tumors derived from the nonangiogenic clone A1 cells, both during early dormancy (4–14 days after inoculation) and after the switch to the angiogenic phenotype, i.e., past day 70 of inoculation (early dormancy, 6.8 [95% CI = 4.6 to 8.9]; angiogenic, 5.8 [95% CI = 3.8 to 7.8]; P = .53). However, the ratios in nonangiogenic tumors during early dormancy were statistically significantly lower than those in tumors that had switched to the angiogenic phenotype (early dormancy, 3.1 [95% CI = 2.1 to 4.1], angiogenic, 5.6 [95% CI = 4.5 to 6.6]; P = .002). More than 50% of tumor cells were proliferative and more than 10% underwent apoptosis in all microscopic and macroscopic tumors analyzed. These findings indicate that nonangiogenic tumors, even before they have switched from dormancy to the angiogenic phenotype, have high proliferation rates and therefore are not quiescent (i.e. are not in a G 0 state). These results are consistent with those of previous reports ( 13 , 17 , 24 ) . Moreover, establishment of angiogenic and expanding tumors appeared to be independent of the tumor cell proliferation/apoptosis ratio.
Vascular Integrity and Functionality
To compare vascular integrity and functionality between angiogenic and nonangiogenic tumors, we performed a modified Miles assay. Vascular permeability was assessed within size-matched nonangiogenic and angiogenic tumors, as well as in the skin overlying the tumor and in control skin from the contralateral flank of the mouse ( Fig. 5 ). We assessed permeability by measuring Evans blue dye that had leaked from the vasculature after removing intravascular dye by systemic perfusion of the mice with PBS ( Fig. 5, B ). Both macroscopic analysis ( Fig. 5, A ) and quantification of extracted dye indicated that angiogenic tumors retained the dye, and nonangiogenic tumors remained dye free. Vascular permeability within the skin that remained in contact with the tumor was comparable to that of skin obtained from the contralateral flank of the mouse. Thus, the observed differences in vascular permeability between angiogenic and nonangiogenic tumors appeared to be localized to the neoplastic tissue and did not affect the permeability of adjacent nonneoplastic tissue (i.e., skin).
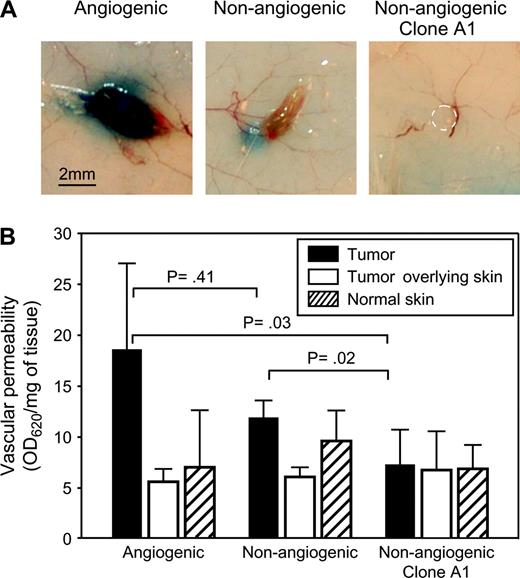
In vivo Miles assay comparing vascular permeability between tumors generated from nonangiogenic and angiogenic cell lines. Mice were inoculated with either nonangiogenic or angiogenic tumor cells. A modified Miles assay was performed in mice bearing size-matched tumors (from nonangiogenic or angiogenic tumor cells) at day 14 after inoculation. ( A ) Gross morphology of dye-containing angiogenic and dye-excluding nonangiogenic tumors. Dashed circle indicates the location of a tumor generated from the nonangiogenic clone A1. ( B ) Quantification of tissue retention of the Evans blue dye (normalized to weight of the tissue samples) showed 1.5- to 2.5-fold higher vascular permeability of the dye in angiogenic tumors than in nonangiogenic tumors (at least seven mice per group). Nonangiogenic tumors and mouse skin samples (tumor-overlying or normal control) had similar permeability. Data represent mean values with error bars denoting the upper limit of the 95% confidence intervals. Vascular permeability between tumors from nonangiogenic and angiogenic cell lines was compared using analysis of variance (ANOVA).
Differences in Expression of Pro- and Antiangiogenic Proteins Between Nonangiogenic and Angiogenic Tumor Cells
Levels of bFGF and VEGF 165 (both of which are proangiogenic) and thrombospondin-1 (which is an angiogenesis inhibitor) secreted by tumor cells were quantified in the media of cells grown in vitro ( Fig. 6 ). In all three cancer types, angiogenic tumor cells secreted much higher levels of bFGF than nonangiogenic cells (13-fold difference for breast cancer cells, 79-fold for osteosarcoma, and fourfold for glioblastoma; P <.001 for all three cancer types, Student's t test). All tumor cells secreted substantial levels of VEGF 165 . However, whereas angiogenic osteosarcoma cells secreted 66-fold higher levels of VEGF 165 than nonangiogenic tumor cells ( P <.001), levels of VEGF 165 secreted by nonangiogenic and angiogenic tumor cells were similar for both breast carcinoma and glioblastoma. In all three cancer types, nonangiogenic subpopulations secreted statistically significantly higher levels of thrombospondin-1 than angiogenic cells (23-fold difference for breast cancer cells, sixfold for osteosarcoma, and fivefold for glioblastoma and breast carcinoma; P = .011, osteosarcoma and glioblastoma; P <.001).
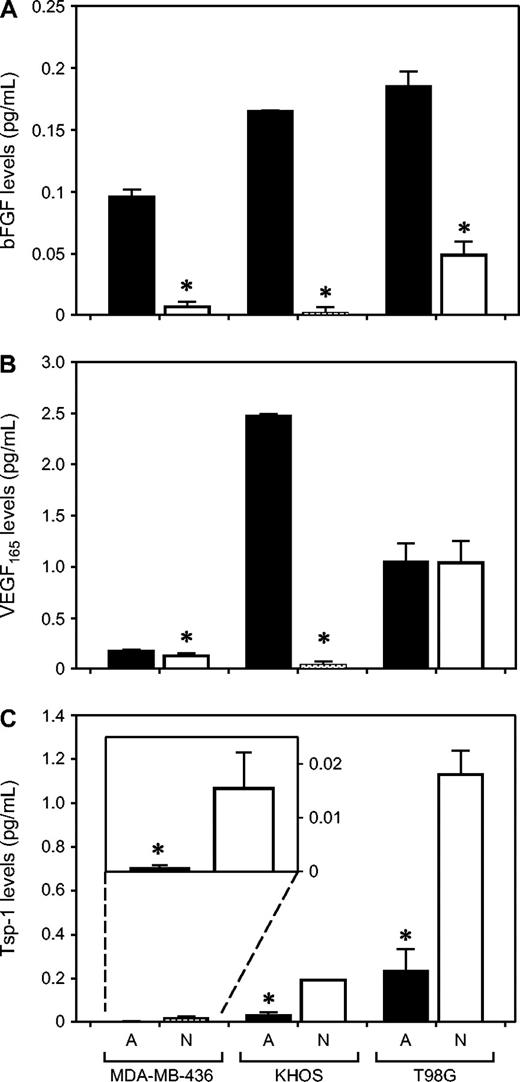
Secretion of basic fibroblast growth factor (bFGF), vascular endothelial growth factor (VEGF 165 ), and thrombospondin-1 by nonangiogenic and angiogenic tumor cells in vitro. Tissue culture medium from angiogenic ( A, black bars ) and nonangiogenic ( N, white bars ) cells was analyzed for levels of bFGF ( panel A ), VEGF 165 ( panel B ), and thrombospondin-1 ( panel C ) using enzyme-linked immunosorbent assay, for all three human tumor cell lines: MDA-MB-436 (breast cancer), KHOS-24OS (osteosarcoma), and T98G (glioblastoma). All results were standardized per number of viable tumor cells at the time of the assay. Data represent mean values with error bars denoting the upper limit of the 95% confidence intervals. Statistically significantly different results between the nonangiogenic and angiogenic pairs are shown with an asterisk ( * ) above the bar (angiogenic versus nonangiogenic cell comparisons for bFGF, all P <.001; for VEGF levels, MDA-436, P = .005; KHOS, P <.001; for Tsp-1 levels, MDA-MB-436, P = .011; KHOS-24OS and T98G, P <.001).
Repression of Thrombospondin-1 Activity via the PI3K–c-Myc Pathway Correlates With the Switch From Dormancy to the Angiogenic Phenotype
Because nonangiogenic cells secreted higher levels of thrombospondin-1 than angiogenic cells, we hypothesized that thrombospondin-1 expression plays a role during tumor dormancy. Previous work ( 19 ) in a different breast cancer cell line (MDA-MB-435) demonstrated that thrombospondin-1 expression is governed by the PI3K–c-Myc signaling pathway. Therefore, we compared the expression levels of c-Myc, phosphorylated-Myc (p-Myc), and thrombospondin-1 in cell lysates of nonangiogenic and angiogenic tumor cells. Western blot analysis showed 2.5-fold higher levels of c-Myc and p-Myc in angiogenic cells than in their nonangiogenic counterparts ( Fig. 7, A, B ). By contrast, angiogenic tumor cells contained lower levels of thrombospondin-1 than nonangiogenic cells. This finding confirmed the results obtained by measuring secreted thrombospondin-1. PI3K has previously been demonstrated to induce a signal transduction cascade leading to the phosphorylation of c-Myc and subsequent repression of thrombospondin-1 ( 19 ) . Therefore, we sought to determine whether this pathway was active in the angiogenic cell line. We treated both angiogenic and nonangiogenic tumor cells with the PI3K inhibitor LY294002. Treatment with this compound caused thrombospondin-1 levels within angiogenic cells to increase but had no effect on the levels in nonangiogenic cells (or those in nonangiogenic clone A1 cells) ( Fig. 7, B ). Therefore, we conclude that the PI3K signaling pathway is responsible for the repression of thrombospondin-1 and is differently regulated in angiogenic and nonangiogenic tumor cells.

Thrombospondin-1 expression in nonangiogenic and angiogenic MDA-MB-436 human breast cancer cells. ( A ) Western blot analysis of c-Myc, thrombospondin-1 (Tsp-1), and β-actin (loading control) in angiogenic, nonangiogenic, and nonangiogenic clone A1 variants of MDA-MB-436 cells. ( B ) Upper panel is a representative immunoblot analysis of thrombospondin-1 and phosphorylated c-Myc (p-Myc) in cells treated with the phosphoinositide 3-kinase inhibitor LY294002 (+) or left untreated (−). Lower panel shows thrombospondin-1 expression levels, normalized to total protein gel loading as quantified by staining for β-actin.
D ISCUSSION
The results presented here show that the switch to the angiogenic phenotype in human cancer cells is highly reproducible in frequency and proportion of otherwise microscopic and dormant tumors. The model for human tumor dormancy that we have developed here is novel because the angiogenic tumor cell lines had spontaneously switched from the nonangiogenic cell lines without the use of in vitro selection (by a particular tumor cell marker) or artificial genetic alterations ( 15 , 17 – 19 ) . Our results suggest that the onset and extent of angiogenesis are critical determinants of tumor progression and growth. Also, our results indicate that the establishment of angiogenic and expanding tumors in vivo (i.e., the angiogenic switch) is independent of the ratio of tumor cell proliferation to apoptosis.
Histologic examination of microscopic nonangiogenic breast cancers revealed two categories of such tumors: 1) completely avascular tumors and 2) tumors containing empty lumens, without red blood cells, which we assume represent blind sprouts. Neither category of nonangiogenic tumors showed evidence of vascular permeability, most likely because of the absence of vasculature or presumably inefficient vascular sprouting. These categories are likely to represent early stages leading to the angiogenic switch. The gross difference between the nonangiogenic tumors and angiogenic tumors (i.e., white versus red tumors) is most likely due to the reactive hyperemia that accompanies the onset of blood flow after the angiogenic switch is completed in a previously hypoxic tumor.
In the experiments reported here, we used 5 × 10 6 tumor cells in each inoculation. We observed sparse microvessels in the nonangiogenic tumors up to 40 days after inoculation. These structures did not appear to be functional microvessels, as evidenced by lack of vascular lumens and absence of red blood cells. After 40 days, these microvascular structures could not be sustained, and they disappeared until the angiogenic switch. After the completion of this study, further work (data not shown) indicated that these sparse microvessels could be induced by excessive VEGF or other proangiogenic proteins carried over in the original tumor cell inoculum. Therefore, we decreased the inoculum by decrements from 5 × 10 6 to 500 tumor cells. We found the optimum inoculum to be 10 6 tumor cells; this inoculum produced nonangiogenic, microscopic, dormant tumors that were completely avascular until the time of the angiogenic switch. Therefore, in future studies, we suggest that the model we now report could be optimized by using approximately 10 6 tumor cells as the initial inoculum.
Although our findings indicate that the lack of angiogenesis is a rate-limiting step for tumor expansion in the dormant state, there may also be other processes involved in human tumor dormancy, such as differentiation programs, tumor cell survival, or immune response of the host. Although the precise mechanism and timing of tumor dormancy have not yet been completely elucidated, our novel approach provides a means to determine the molecular events and sequential steps of the angiogenic switch. The kinetics of individual stages might be of substantial practical importance for identifying an optimal therapeutic window in the treatment of early cancer.
In other animal models, the growth of angiogenic tumors has been associated with reduced expression of endogenous angiogenesis inhibitors, such as angiostatin ( 24 ) , endostatin ( 25 ) , tumstatin ( 26 ) , pigment epithelium–derived factor ( 27 ) , and thrombospondin-1 ( 28 ) . Although it is likely that other endogenous angiogenesis inhibitors play a role in the switch to the angiogenic phenotype for other cancer types, in these experiments we focused on the differences in thrombospondin-1 expression between nonangiogenic and angiogenic tumor cells. In our experiments, thrombospondin-1 appeared to be a major negative regulator of angiogenesis. That is, thrombospondin-1 expression had to be reduced in the angiogenic tumor cells for the angiogenic switch to take place. This finding further strengthens Noël Bouck's hypothesis that the onset of tumor angiogenesis is associated with a substantial decrease in thrombospondin-1 levels ( 29 ) . Previous reports have shown that transfection of thrombospondin-1 into human breast cancer cell lines decreased angiogenesis, tumor growth, and metastasis in immunocompromised mice ( 19 , 30 ) . Immunohistochemical analysis of human breast cancer tissue has shown marked increases in levels of thrombospondin-1 mRNA in stromal cells immediately adjacent to ductal carcinomas in situ compared with normal breast tissue ( 31 ) . These findings raise the possibility that increased expression of thrombospondin-1 in stromal cells and cancer cells may inhibit angiogenesis induced by VEGF and bFGF.
Our dormancy model of breast cancer shows that thrombospondin-1 expression is regulated by the PI3K–c-Myc signaling pathway. This finding is consistent with those of previous reports ( 19 , 32 – 34 ) . Western blot analysis demonstrated that the angiogenic MDA-MB-436 breast cancer cells expressed higher levels of c-Myc and lower levels of thrombospondin-1 than the nonangiogenic cell line or the nonangiogenic single cell–derived clone A1. Furthermore, when the activity of PI3 kinase was inhibited in the angiogenic cells, levels of p-Myc decreased and levels of thrombospondin-1 increased compared with levels in the nonangiogenic cells. We conclude that the PI3K–c-Myc pathway plays a key role in the regulation of thrombospondin-1 and may contribute to the observed differences in growth in vivo.
In our study, most of the nonangiogenic glioblastoma and osteosarcoma tumors never switched to an angiogenic phenotype during the lifetimes of the mice. By contrast, most of the nonangiogenic breast tumors did undergo the angiogenic switch. Therefore, the amount of time until the angiogenic switch appears to be distinct for a given tumor type and to differ among tumor types. We speculate that most human microscopic cancers can survive for prolonged periods by keeping the balance of pro- and antiangiogenic proteins in a steady state that favors dormancy.
The human tumor dormancy model has a few limitations. One limiting factor is that experiments characterizing the timing of the angiogenic switch can be time-consuming, lasting up to 1 year or longer. Consequently, up to this point, the mechanism of the angiogenic switch is still unclear and under investigation. Nonangiogenic tumors are invisible until the angiogenic switch, unless they are imaged using luciferase or green fluorescent protein.
Our results provide the basis for further analysis of dormant nonangiogenic tumors. Among the questions that it can be used to address are the following: 1) What are the determinants and mechanism for the “clock” that governs the angiogenic switch? Why is the timing of the switch to the angiogenic phenotype so predictable for a given tumor type? For example, why do 100% of angiogenic breast cancers become palpable at a median of 19 days, when less than 20% of nonangiogenic (clone A1) breast cancers switch to the angiogenic phenotype after approximately 1 year? In vivo growth of these single-cell clones demonstrates heterogeneity in the dormancy clock and will be used for subsequent molecular studies of this process. 2) What is the sequence of the different stages of the angiogenic switch, i.e., lumen formation, initiation of flow, and hyperemia? 3) Is the angiogenic switch reversible? Can angiogenic tumor cells revert to nonangiogenic cells? If not, why is it possible to isolate nonangiogenic tumor cells from angiogenic tumors, such as the nonangiogenic clone A1 of breast cancer?
During the dormancy period, nonangiogenic tumors had high proliferation rates and were therefore not quiescent (i.e. were not in a G 0 state). Moreover, the angiogenic switch appeared to be independent of the tumor cell proliferation/apoptosis ratio. Therefore, angiogenesis and proliferation/apoptosis represent different programs in tumor progression. These models can permit further studies of the angiogenic switch, especially the different stages and timing of the process. Also, this approach may be suitable for the study of sensitive angiogenesis-based biomarker assays and novel treatment strategies. We, along with others, are currently developing an angiogenesis-based panel of blood and urine biomarkers that can be quantified and used to detect microscopic tumors before or during the angiogenic switch. If this approach is feasible, microscopic tumors could possibly be treated years before they become symptomatic or their anatomical site is detectable. The use of this animal model has taught us that in the future, it may be possible to liberate the management of cancer from dependency on anatomical site.
We thank Amy Birsner, Nathan Liu, and Gerd Lillian Hallseth for excellent technical assistance; Dr. Raanan Berger (Dana-Farber Cancer Institute) for technical help with the in vitro anchorage-independent growth assay; Drs. Giannoula Klement and Sandra Ryeom for valuable comments; and Kristin Gullage for photography.
Supported by the Breast Cancer Research Foundation, an Innovator Award (W81XWH-04-1-0316) from the Department of Defense, and Institute of Cancer Research/Oliver R. Grace fellowship to Dr. Nava Almog. The funding agencies did not have a role in the design, conduct, and reporting of this study.
Funding to pay the Open Access publication charges for this article was provided by the Breast Cancer Research Foundation.
References
Folkman J, Cole P, Zimmerman S. Tumor behavior in isolated perfused organs: in vitro growth and metastases of biopsy material in rabbit thyroid and canine intestinal segment.
Gimbrone MA Jr, Leapman SB, Cotran RS, Folkman J. Tumor dormancy in vivo by prevention of neovascularization.
Folkman J. Antiangiogenesis agents. In Cancer: Principles and Practice of Oncology, 7th ed. VT DeVita Jr, S Hellman, and SA Rosenberg, editors. Philadelphia (PA): Lippincott Williams & Wilkins;
Nielsen M, Thomsen JL, Primdahl S, Dyreborg U, Andersen JA. Breast cancer and atypia among young and middle-aged women: a study of 110 medicolegal autopsies.
Black WC, Welch HG. Advances in diagnostic imaging and overestimators of disease prevalence and the benefits of therapy.
Feldman AR, Kessler L, Myers MH, Naughton MD. The prevalence of cancer. Estimates based on the Connecticut Tumor Registry.
Demicheli R, Terenziani M, Valagussa P, Moliterni A, Zambetti M, Bonadonna G. Local recurrences following mastectomy: support for the concept of tumor dormancy.
Meng S, Tripathy D, Frenkel EP, Shete S, Naftalis EZ, Huth JF, et al. Circulating tumor cells in patients with breast cancer dormancy.
Mizuno I, Izeki O, Nakahara S, Kawamoto K, Onga T, Matsuoka H, et al. Disseminated carcinomatosis of the bone marrow occurring 11 years after subtotal gastrectomy for gastric cancer.
Crowley NJ, Seigler HF. Relationship between disease-free interval and survival in patients with recurrent melanoma.
Badgley CE, Batts M. Osteogenic sarcoma: an analysis of eighty cases.
Holmgren L, O'Reilly MS, Folkman J. Dormancy of micrometastases: balanced proliferation and apoptosis in the presence of angiogenesis suppression.
Folkman J, Watson K, Ingber D, Hanahan D. Induction of angiogenesis during the transition from hyperplasia to neoplasia.
Hanahan D, Folkman J. Patterns and emerging mechanisms of the angiogenic switch during tumorigenesis.
Hanahan D, Christofori G, Naik P, Arbeit J. Transgenic mouse models of tumor angiogenesis: the angiogenic switch, its molecular controls, and prospects for preclinical therapeutic models.
Achilles EG, Fernandez A, Allred EN, Kisher O, Udagawa T, Beecken WD, et al. Heterogeneity of angiogenic activity in a human liposarcoma: a proposed mechanism for “no take” of human tumors in mice.
Udagawa T, Fernandez A, Achilles E, Folkman J, D'Amato RJ. Persistence of microscopic human cancers in mice: alterations in the angiogenic balance accompanies loss of tumor dormancy.
Watnick RS, Cheng Y, Rangarajan A, Ince TA, Weinberg RA. Ras modulates Myc activity to repress thrombospondin-1 expression and increase tumor angiogenesis.
Gavrieli Y, Sherman Y, Ben-Sasson SA. Identification of programmed cell death in situ via specific labeling of nuclear DNA fragmentation.
Miles A, Miles E. Vascular reactions to histamine, histamine-liberator and leukotaxine in the skin of guinea pigs.
Kaplan EL, Meier P. Nonparametric estimation from incomplete observations.
Mantel N. Evaluation of survival data and two new rank order statistics arising in its consideration.
O'Reilly MS, Holmgren L, Chen C, Folkman J. Angiostatin induces and sustains dormancy of human primary tumors in mice.
O'Reilly MS, Boehm T, Shing Y, Fukai N, Vasios G, Lane WS, et al. Endostatin: an endogenous inhibitor of angiogenesis and tumor growth.
Maeshima Y, Sudhakar A, Lively JC, Ueki K, Kharbanda S, Kahn CR, et al. Tumstatin, an endothelial cell-specific inhibitor of protein synthesis.
Dawson DW, Volpert OV, Gillis P, Crawford SE, Xu H, Benedict W, et al. Pigment epithelium-derived factor: a potent inhibitor of angiogenesis.
Good DJ, Polverini PJ, Rastinejad F, Le-Beau MM, Lemons RS, Frazier WA, et al. A tumor suppressor-dependent inhibitor of angiogenesis is immunologically and functionally indistinguishable from a fragment of thrombospondin.
Rastinejad F, Polverini PJ, Bouck NP. Regulation of the activity of a new inhibitor of angiogenesis by a cancer suppressor gene.
Weinstat-Saslow DL, Zabrenetzky VS, VanHoutte K, Frazier WA, Roberts DD, Steeg PS. Transfection of thrombospondin 1 complementary DNA into a human breast carcinoma cell line reduces primary tumor growth, metastatic potential, and angiogenesis.
Brown LF, Guidi AJ, Schnitt SJ, Van De Water L, Iruela-Arispe ML, Yeo TK, et al. Vascular stroma formation in carcinoma in situ, invasive carcinoma, and metastatic carcinoma of the breast.
Aguirre-Ghiso JA, Kovalski K, Ossowski L. Tumor dormancy induced by downregulation of urokinase receptor in human carcinoma involves integrin and MAPK signaling.
Aguirre-Ghiso JA, Liu D, Mignatti A, Kovalski K, Ossowski L. Urokinase receptor and fibronectin regulate the ERK(MAPK) to p38(MAPK) activity ratios that determine carcinoma cell proliferation or dormancy in vivo.

