


Abstract
Background: The number, nature, and costs of serious adverse effects experienced by younger women receiving chemotherapy for breast cancer outside of clinical trials are unknown. Methods: From a database of medical claims made by individuals with employer-provided health insurance between January 1998 and December 2002, we identified 12 239 women 63 years of age or younger with newly diagnosed breast cancer, of whom 4075 received chemotherapy during the 12 months after the initial breast cancer diagnosis and 8164 did not. Diagnostic codes for eight chemotherapy-related adverse effects were identified. Total hospitalizations for all causes, hospitalizations or emergency room visits for adverse effects that are typically related to chemotherapy, and health care expenditures were compared between the two groups of women. All statistical tests were two-sided. Results: Women who received chemotherapy were more likely than those who did not to be hospitalized or to visit the emergency room for all causes (61% versus 42%; mean difference = 19%, 95% confidence interval [CI] = 16.7% to 21.3%, P <.001) and for chemotherapy-related serious adverse effects (16% versus 5%, mean difference = 11%, 95% CI = 9.6% to 12.4%, P <.001). The percentages of chemotherapy recipients who were hospitalized or visited the emergency room during the year after their breast cancer diagnosis were 8.4% for fever or infection; 5.5% for neutropenia or thrombocytopenia; 2.5% for dehydration or electrolyte disorders; 2.4% for nausea, emesis, or diarrhea; 2.2% for anemia; 2% for constitutional symptoms; 1.2% for deep venous thrombosis or pulmonary embolus; and 0.9% for malnutrition. Chemotherapy recipients incurred large incremental expenditures for chemotherapy-related serious adverse effects ($1271 per person per year) and ambulatory encounters ($17 617 per person per year). Conclusions: Chemotherapy-related serious adverse effects among younger, commercially insured women with breast cancer may be more common than reported by large clinical trials and lead to more patient suffering and health care expenditures than previously estimated.
A drug-related serious adverse effect has been defined as any untoward medical occurrence that is related to drug use and results in death or significant disability/incapacity, requires hospital admission or prolongation of existing hospital stay, or is life threatening ( 1 , 2 ) . Population-based data suggest that drug-related adverse effects are common and cause morbidity and mortality accounting for approximately 6.5% of all hospitalizations ( 3 ) and as many as 100 000 deaths per year ( 4 , 5 ) in the United States. Although clinical trials of new drug therapies provide some information regarding the number and nature of serious adverse effects, reports of these complications are frequently inadequate ( 6 , 7 ) and may not accurately reflect the experiences of the general population ( 8 ) . Indeed, recent and widely publicized cases have demonstrated that serious adverse effects that are not fully appreciated during early clinical trials can appear after a drug is approved by the US Food and Drug Administration (FDA) and used by the public ( 9 ) . In fact, one study of serious adverse effects identified after FDA approval found that 22 cancer drugs had been linked with 25 serious adverse effects between 2000 and 2002 ( 10 ) .
Breast cancer is the most common indication for chemotherapy among women in the United States ( 11 ) , and chemotherapy drugs are the leading cause of serious drug-related adverse effects among women with breast cancer. Although large clinical trials of adjuvant chemotherapy for breast cancer have reported that hospitalizations for serious adverse effects are uncommon ( 12 ) , only one study ( 13 ) has investigated the frequency of chemotherapy-related serious adverse effects in the general population of women with breast cancer. That study, which analyzed data from the National Cancer Institute's (NCI) Surveillance, Epidemiology, and End Results (SEER) database linked with Medicare claims data found that, for women with breast cancer who were treated in actual practice, the rates of hospitalization for eight chemotherapy-related toxicities were higher than had been expected based on results of large clinical trials ( 13 ) . However, this study included women diagnosed from 1991 to 1996, when medications that treat the adverse effects of chemotherapy (i.e., growth factors and newer antiemetics) were less available than they are today. Also, it included only women over age 65, a group that may be more likely than younger women to experience chemotherapy-related toxicities, in part because comorbid conditions are more common in older women. To more comprehensively characterize the risks and consequences of serious adverse effects among women in the general population treated with chemotherapy for breast cancer, we used insurance claims data to assess the frequencies and costs of eight chemotherapy-related adverse effects in women who were diagnosed with breast cancer when they were under 64 years of age and who were treated during the period from April 1, 1998, to December 31, 2002.
S UBJECTS AND M ETHODS
Data Source and Study Population
The MarketScan Commercial Claims and Encounters Research Database served as the data source for this analysis. This database was compiled by Medstat, a medical information company, from claims made to health plans that contract with large employers, state and local governments, and public organizations in the United States. The health plans included in the database provided employer-sponsored private fee-for-service or capitated health insurance to employees and their covered dependents. The database contains inpatient, outpatient, and prescription claims, as well as administrative data at the patient level that is tracked longitudinally as long as patients remain with their employer.
Data for more than 5.6 million individuals were available during the 5-year period from January 1, 1998, to December 31, 2002. The data set analyzed here was restricted to women aged 18–63 with two indications of a breast cancer diagnosis, i.e., code 174.x from the International Classification of Diseases (Ninth Revision) (ICD-9), separated by at least 30 days to exclude patients with ICD-9 codes that were entered by mistake or who were undergoing evaluation for breast abnormalities that were subsequently found to be benign. At least one breast cancer diagnostic code had to appear in conjunction with a face-to-face encounter with a health care provider, and patients with other cancer diagnoses were excluded. To restrict the study to those with new cancer diagnoses, eligible women had to have been enrolled in a health plan for at least 3 months before their first breast cancer diagnosis and to have no evidence of a cancer diagnosis during that time. To ensure that treatments and serious adverse effects were recorded in the data set, women had to be enrolled in a health plan for at least 12 months following the first breast cancer diagnosis (unless they entered hospice or died). Women 64 years of age or older when their breast cancer was first diagnosed were excluded to ensure that claims had not been submitted to Medicare. A total of 12 239 women from the database were eligible for this study.
Data Acquisition and Variable Definitions
For each member of the study population, we extracted, from the MarketScan database, information on age, health plan type (basic comprehensive, health maintenance organization, point of service, preferred provider organization, or point of service with capitation), region of residence (northeast, north central, south, west, or unknown), union status (union or nonunion), work hours (full time or part time), comorbidity score (no comorbid conditions or at least one condition), metastatic status (metastatic or nonmetastatic), claims for biopsies or pathology studies, receipt of cancer-related surgery or radiation therapy, receipt of trastuzumab or hormonal therapy, receipt of chemotherapy, and claims for inpatient, emergency room, and ambulatory encounters. For 83% of the women, data on prescriptions were available. Comorbid diagnoses were considered present if two claims were made at least 30 days apart during the 3 months before and the 12 months after the first breast cancer diagnosis. Comorbid diagnoses excluded cancer diagnoses and were coded using the method developed by Charlson et al. ( 14 ) , with some modifications ( 15 , 16 ) . Claims for cancer treatments, hospitalizations, emergency room visits, and prescriptions were assessed during the 12 months after the first breast cancer diagnosis. The 12-month cutoff was chosen to identify all initial breast cancer treatments and associated serious adverse effects.
Intravenous chemotherapy administration was identified using diagnostic and procedure codes for ambulatory encounters, including Current Procedural Terminology (CPT) codes for chemotherapy services and procedures, J & Q codes for selected chemotherapy agents, and ICD-9 and Diagnosis-Related Group (DRG) codes for chemotherapy administration ( Appendix A ). Women were considered to have received chemotherapy if at least one chemotherapy code was present during the 12 months after the first breast cancer diagnosis. The number of months during which chemotherapy was administered ( 1 – 12 ) and the cost of chemotherapy administration were recorded. The receipt of supportive medications (e.g., antiemetics and growth factors), breast biopsies, breast cancer surgeries, pathology studies, and radiation therapy during the 12 months after the first breast cancer diagnosis were identified using selected medication names and CPT, ICD-9, and DRG codes ( Appendix A ).
Direct medical expenditures were obtained for hospitalizations, emergency room visits, ambulatory encounters, and prescriptions; co-payments incurred by patients were reported for ambulatory encounters and prescriptions. Expenditures for chemotherapy medications and their administration were considered ambulatory expenditures but were also analyzed separately. Expenditures for hospitalizations or emergency room visits attributable to chemotherapy-related serious adverse effects were reported separately as well.
Matching the Cohorts
The population of eligible patients was divided into two cohorts: those who received chemotherapy within 12 months of their first breast cancer diagnosis and those who did not (4075 and 8164 women, respectively). Women who did not receive chemotherapy were on average older than those who did, were more likely to have had comorbidities, and were less likely to have received breast cancer–related surgery or radiation therapy. Therefore, propensity score–based matching was used as follows to designate a nonchemotherapy group with a distribution of measured covariates similar to that of the chemotherapy cohort ( 17 , 18 ) . First, a logistic regression model predicting receipt of chemotherapy was created, with age, health plan type, region of residence, union status, work hours, comorbidity score, receipt of cancer-related surgery or radiation therapy, and metastatic status as predictors. Next, each chemotherapy recipient was paired with a nonchemotherapy patient who was randomly selected from the subset of nonchemotherapy patients whose predicted logits were within a specified small distance of the chemotherapy recipient's predicted logit. Using a small distance between paired logits was possible because there were many nonchemotherapy patients from whom to select a match, and this small distance ensured that matched patients were similar (i.e., had nearly identical propensities to receive chemotherapy). After matching, the predicted probabilities corresponding to the logits were less than 0.01 apart for 80% of the pairs. Of the 4075 women in the chemotherapy group, 3526 (87%) were matched. Although the analysis reported here reflects only those patients who were matched, a sensitivity analysis incorporating all chemotherapy recipients yielded similar results (data not shown).
Defining and Identifying Adverse Effects of Therapy
For the purposes of this study, a serious adverse effect was defined as harm in a patient resulting in an emergency room visit or hospitalization. A patient was considered to have had a serious adverse effect if a diagnostic code for that event was associated with a hospitalization or emergency room visit during the 12 months following the first breast cancer diagnosis.
Based on their association with chemotherapy in previous clinical trials ( 12 ) , the following chemotherapy-related serious adverse effects were selected: 1) infections or fever; 2) neutropenia or thrombocytopenia; 3) anemia or transfused packed red blood cells; 4) nausea, emesis, or diarrhea; 5) dehydration or electrolyte abnormality; 6) malnutrition; 7) constitutional symptoms or nonspecific complications of treatments; and 8) deep venous thrombosis or pulmonary embolus. Chemotherapy-unrelated events (i.e., conditions that are never or only rarely [<1% of the time] associated with chemotherapy use in trials) were also selected: 1) fracture or dislocation, 2) asthma or chronic obstructive pulmonary disease, 3) renal failure, 4) thyroid disorder, and 5) headache. ICD-9, DRG, and CPT codes were identified and grouped together to form each chemotherapy-related serious adverse effect and each chemotherapy-unrelated event ( Appendix B ). Diagnostic codes associated with outpatient encounters were not considered when identifying either type of outcome, because they reflected less severe conditions and would have generated oversampling bias, given that women who received chemotherapy had more outpatient visits than those who did not.
There were insufficient clinical data in the MarketScan data set to definitively establish a cause–effect relationship between chemotherapy administration and the chemotherapy-related serious adverse effects. Therefore, odds ratios (ORs) for each of the chemotherapy-related serious adverse effects and each of the chemotherapy-unrelated events were derived to assess their association with chemotherapy administration. To further assess the strength of the association between the chemotherapy-related serious adverse effects and chemotherapy administration, odds ratios for each of the serious adverse effects were calculated for patient groups defined by receipt and nonreceipt of radiation therapy and receipt and nonreceipt of breast cancer surgery. The percentages of women who experienced any of the eight chemotherapy-related serious adverse effects were calculated for chemotherapy recipients and nonrecipients and reported as the primary outcome. The mean number of serious adverse effects per person per year was calculated because women could have experienced more than one serious adverse effect during the observation period. The percentage of women who experienced hospitalizations or emergency room visits for any reason, the mean duration of all hospitalizations in days, and the mean expenditure per patient per year were also reported.
Statistical Analysis
Statistical analyses were performed using SAS software version 9.1 (Cary, NC). Binary and categorical variables were compared using the Fisher's exact and chi-square tests, respectively. Distributions of continuous variables were summarized by their means and standard deviations and compared using t tests. All tests for statistical significance were two-sided. A multivariable logistic regression analysis for the odds of experiencing each chemotherapy-related serious adverse effect was performed to adjust for residual confounding and identify independent associations. Anthracycline chemotherapy use was entered as an independent binary predictor for women who received chemotherapy because its addition to chemotherapy regimens may be associated with additional short-term adverse effects ( 19 ) .
R ESULTS
Characteristics of Eligible Breast Cancer Patients
After matching, the study population included equal numbers of women who did and did not receive chemotherapy (3526 in each group). However, matching left some small imbalances ( Table 1 ). Chemotherapy recipients were younger than nonrecipients (by an average of 10 months), more likely to have metastatic disease (8.3% versus 6.9%, mean difference = 1.4%, 95% confidence interval [CI] = 0.16% to 2.64%, P = .03), and more likely to work full time at the time of diagnosis (74.1% versus 71.8%, mean difference = 2.3%, 95% CI = 0.23% to 4.37%, P = .005). Compared with women who did not receive chemotherapy, those who did were slightly more likely to have a breast biopsy or pathology claim and to have had radiation therapy. These differences persisted when the 534 women with metastatic disease were excluded from the analysis. Chemotherapy recipients and nonrecipients did not show differences in comorbidity score, type of health care plan, region of residence, or union status. Rates of breast cancer surgery and receipt of trastuzumab/hormonal agents were also similar for the two groups.
Characteristics of 7052 patients being treated for breast cancer by receipt of chemotherapy *
| Patient characteristics | Chemotherapy (n = 3526) | No chemotherapy (n = 3526) | P value † |
|---|---|---|---|
| Age, y | |||
| Mean | 51.9 | 52.7 | |
| Minimum–Maximum | 21–63 | 24–63 | <.001 |
| Standard error | 0.12 | 0.12 | |
| Metastatic status ‡ | |||
| Nonmetastatic | 91.7% | 93.1% | .03 |
| Metastatic | 8.3% | 6.9% | |
| Comorbidity score § | |||
| 0 | 92.1% | 91.4% | .32 |
| ≥1 | 7.9% | 8.6% | |
| Health plan type | |||
| Basic/comp | 29.4% | 29.6% | |
| HMO | 5.1% | 5.2% | |
| POS | 12.1% | 10.4% | .33 |
| PPO | 32.3% | 33.4% | |
| POS with CAP | 20.4% | 20.9% | |
| Other | 0.8% | 0.5% | |
| Region of residence in United States | |||
| Northeast | 14.0% | 14.5% | |
| North-central | 24.8% | 26.7% | |
| South | 51.8% | 48.7% | .14 |
| West | 4.3% | 4.4% | |
| Unknown | 5.2% | 5.7% | |
| Union status | |||
| Union | 16.6% | 16.9% | .70 |
| Nonunion | 83.4% | 83.1% | |
| Work hours | |||
| Full time | 74.8% | 71.8% | .005 |
| Part time | 25.2% | 28.2% | |
| Additional breast cancer tests and therapies | |||
| Biopsy or pathology claim | 89.4% | 87.4% | .01 |
| Breast cancer surgery | 84.8% | 86.4% | .06 |
| Radiation therapy | 56.4% | 53.7% | .02 |
| Trastuzumab or hormonal therapy ‖ | 64.3% | 65.0% | .53 |
Basic/comp = basic comprehensive; HMO = health maintenance organization; POS = point of service; PPO = preferred provider organization; POS with CAP = point of service with capitation.
Fisher's exact and chi-square tests.
Metastatic status was identified using ICD-9 codes for secondary malignant neoplasms (197–199).
Comorbid diagnoses were considered present if two claims were made at least 30 days apart during the 3 months before and the 12 months after the first breast cancer diagnosis (other cancer diagnoses were excluded).
Data for the 5848 women for whom prescription data were available—2935 who received chemotherapy and 2913 who did not.
Women in the study population received a range of chemotherapy treatments; among those treated, 58% received alkylating agents, 51% received anthracyclines, 25% received taxanes, and 18% received antimetabolites. For 78% of the chemotherapy recipients, the duration of chemotherapy was 3–7 months, the approximate time needed to administer a course of adjuvant chemotherapy ( 12 ) ; 15% received chemotherapy for less than 3 months and 7% received it for more than 7 months. Women who had undergone chemotherapy were more likely than those who had not to receive prescriptions for antiemetics (84% versus 23%, mean difference = 61%, 95% CI = 59.0% to 63.0%, P <.001) or growth factors (12% versus 1%, mean difference = 11%, 95% CI = 9.7% to 12.2%, P <.001).
Odds Ratios of Serious Adverse Effects
The association between chemotherapy-related serious adverse effects and chemotherapy administration was assessed in two ways. First, we compared the odds of serious adverse effects experienced by women who did and did not receive chemotherapy for two categories of adverse effects—“chemotherapy related” and “chemotherapy unrelated” ( Table 2 ). Women who received chemotherapy had statistically significantly greater odds of experiencing each of the eight chemotherapy-related serious adverse effects and 3.6-fold (95% CI = 3.0 to 4.3) greater odds of experiencing at least one of the eight chemotherapy-related serious adverse effects. However, they were more likely to experience only one of the five chemotherapy-unrelated events. We also computed the odds ratios of each of the chemotherapy-related serious adverse effects for recipients of radiation therapy compared with nonrecipients and for those who underwent breast cancer surgery compared with those who did not ( Table 2 ). The lingering effects of chemotherapy given immediately before radiation therapy may have caused radiation therapy recipients to have greater odds of experiencing neutropenia or thrombocytopenia compared with those who did not receive radiation therapy (OR = 1.4, 95% CI = 1.0 to 1.8). The odds ratios for all other chemotherapy-related serious adverse effects among women who received radiation therapy relative to those who did not were not statistically significantly greater than 1. Finally, the odds ratios of chemotherapy-related serious adverse effects among women who received breast cancer surgery relative to those who did not were also not statistically significantly greater than 1.0.
Odds ratios (with 95% confidence intervals) of chemotherapy-related serious adverse effects and chemotherapy-unrelated events according to type of treatment received *
| Treatment † | |||||
|---|---|---|---|---|---|
| Type of serious adverse effect | Chemotherapy (n = 3526) | Radiation therapy (n = 3885) | Breast cancer surgery (n = 6036) | ||
| Chemotherapy-related SAEs | |||||
| Infection and fever | 3.8 ‡ (3.0–4.9) | 1.2 (1.0–1.5) | 0.9 (0.7–1.2) | ||
| Neutropenia and thrombocytopenia | 14.6 † (8.5–25.2) | 1.4 † (1.0–1.8) | 0.8 (0.6–1.2) | ||
| Anemia and PRBC transfusion | 3.0 † (2.0–4.8) | 0.6 † (0.4–0.9) | 0.9 (0.5–1.4) | ||
| Nausea, emesis, and diarrhea | 3.2 † (2.1–5.0) | 0.9 (0.6–1.3) | 1.0 (0.6–1.7) | ||
| Malnutrition | 7.8 † (2.8–22.2) | 0.7 (0.4–1.3) | 0.3 † (0.2–0.6) | ||
| Constitutional and nonspecific symptoms § | 2.3 † (1.5–3.5) | 0.9 (0.6–1.4) | 0.9 (0.5–1.6) | ||
| Dehydration and electrolyte disorders | 3.4 † (2.2–5.3) | 0.8 (0.6–1.2) | 0.5 † (0.3–0.7) | ||
| DVT or PE | 3.2 † (1.7–5.8) | 1.2 (0.7–2.0) | 0.7 (0.4–1.4) | ||
| Any | 3.6 † (3.0–4.3) | 1.1 (0.9–1.3) | 0.8 (0.7–1.0) | ||
| Chemotherapy-unrelated events ‖ | |||||
| Fractures and dislocations | 0.8 (0.5–1.2) | NA | NA | ||
| Asthma and COPD | 1.0 (0.5–1.7) | NA | NA | ||
| Renal failure | 1.5 (0.5–4.2) | NA | NA | ||
| Thyroid disorders | 0.7 (0.4–1.2) | NA | NA | ||
| Headaches | 1.9 † (1.1–3.4) | NA | NA | ||
| Any | 1.0 (0.8–1.3) | 0.9 (0.7–1.2) | 0.8 (0.6–1.1) | ||
Odds ratio for each effect among breast cancer patients who received the indicated treatment compared with those who did not receive it. SAE = serious adverse effect; NA = not assessed; COPD = chronic obstructive pulmonary disease; DVT or PE = deep venous thrombosis or pulmonary embolus; PRBC = packed red blood cells.
There were 3526 chemotherapy recipients and 3526 nonrecipients, 3885 radiation therapy recipients and 3167 nonrecipients, and 6036 breast cancer surgery recipients and 1016 nonrecipients.
Fisher's exact test P <.001 for all comparisons, except for the odds of neutropenia or thrombocytopenia among radiation therapy recipients ( P = .03), malnutrition among breast cancer surgery recipients ( P = .002), and headaches among chemotherapy recipients ( P = .04).
Constitutional and nonspecific symptoms include diagnostic codes for malaise, fatigue, dizziness, syncope, dysequilibrium, adverse effects of systemic therapy, complications of treatment, or nonspecific signs or symptoms.
Odds ratios for chemotherapy-unrelated events were not determined for women who did or did not receive radiation therapy or women who did or did not undergo breast cancer surgery.
A multivariable logistic regression model was developed to predict the odds ratio for a breast cancer patient experiencing at least one of the eight chemotherapy-related serious adverse effects. Only receipt of chemotherapy (OR = 3.7; 95% CI = 3.0 to 4.3) and the presence of metastatic disease (OR = 2.1; 95% CI = 1.6 to 2.7) were independently associated with a statistically significant increase in the odds of experiencing a serious adverse effect. During the 12 months after the initial breast cancer diagnosis, each additional month of chemotherapy was associated with a 20% increase in the odds of experiencing a chemotherapy-related serious adverse effect (95% CI = 17% to 23%). Among the women who received chemotherapy, anthracycline use was not associated with greater odds of experiencing any individual chemotherapy-related serious adverse effect (data not shown).
Effects of Chemotherapy on Rates of Hospitalization and Emergency Room Visits
More than half (51%) of the women in our cohort had at least one hospitalization or emergency room visit during the year after their first breast cancer diagnosis; the percentages among those who did and did not receive chemotherapy were 61% and 42%, respectively (difference = 19%, 95% CI = 16.7% to 21.3%) ( Fig. 1 ). The majority of all hospitalizations (57%) were related to breast cancer surgery. Chemotherapy recipients experienced more hospitalizations than nonrecipients (1.41 per person per year versus 1.25 per person per year, difference = 0.16, 95% CI = 0.10 to 0.22, P <.001), and they had longer hospital stays (5.0 versus 3.8 days, difference = 1.2, 95% CI = 0.6 to 1.7, P <.001). In the overall cohort, 10.5% of the patients had a hospitalization or emergency room visit for a chemotherapy-related serious adverse effect; for chemotherapy recipients and nonrecipients the corresponding percentages were 16% and 5%, respectively (difference = 11%, 95% CI = 9.6% to 12.4%, P <.001 [ Fig. 1 ]). Chemotherapy-related serious adverse effects were identified for 22% of all hospitalizations among chemotherapy recipients but only 12% of all hospitalizations among women who did not receive chemotherapy.
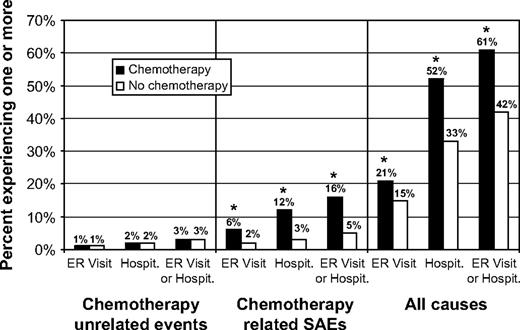
Rates of emergency room (ER) visits and hospitalizations (Hospit.) for chemotherapy-unrelated events, chemotherapy-related serious adverse effects (SAEs), and all causes within 1 year of diagnosis. Results are presented for two matched cohorts: those treated with chemotherapy ( solid bars ) and those not treated with chemotherapy ( open bars ). For both cohorts, n = 3526. Asterisks indicate that comparison of the number of events in the two groups using Fisher's exact test yielded P <.001.
The rates of each of the chemotherapy-related serious adverse effects and the chemotherapy-unrelated events are presented in Fig. 2 . Fever or infection was the most common chemotherapy-related serious adverse effect and was associated with hospitalizations or emergency room visits in 8.4% of chemotherapy recipients ( Fig. 2 ). When we limited the cohort to women who had breast cancer surgery as a way to focus on incident cases and exclude women with metastatic disease (who may have been symptomatic because of their disease), we obtained similar results (data not shown). Because some women experienced multiple serious adverse effects, analyzing the percentage of women who experienced at least one underestimates the impact of these effects on the population. To address this issue, we calculated the number of serious adverse effects per person per year. Chemotherapy recipients had four times the number of chemotherapy-related serious adverse effects per person per year (0.25 versus 0.06, difference = 0.19, 95% CI = 0.16 to 0.21, P <.001).
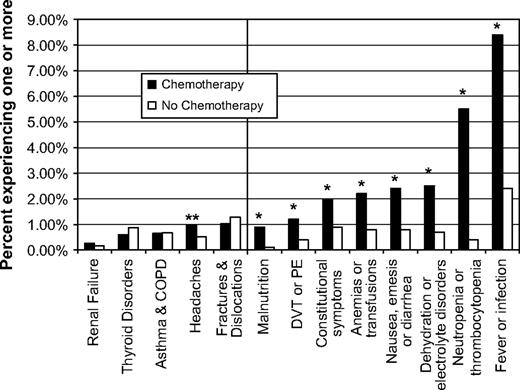
Rates of hospitalizations or emergency room visits for five chemotherapy-unrelated events and eight chemotherapy-related serious adverse effects. Chemotherapy-unrelated events are shown on the left side of the vertical line, and chemotherapy-related serious adverse effects are shown on the right side. The percentage of breast cancer patients who experienced each adverse effect and unrelated event within 1 year of initial diagnosis was compared among two matched cohorts: those treated with chemotherapy ( solid bars ) and those not treated with chemotherapy ( open bars ). For both cohorts, n = 3526. Asterisks indicate that comparison of the number of serious adverse effects in the two groups using Fisher's exact test yielded P <.001. Double asterisks indicate that the comparison of the number of unrelated events attributable to headaches using Fisher's exact test yielded P = .04. COPD = chronic obstructive pulmonary disease; DVT = deep venous thrombosis; PE = pulmonary embolus.
Economic Costs of Breast Cancer Chemotherapy and Chemotherapy-Related Serious Adverse Effects
To estimate breast cancer–related medical expenditures for the whole population, we calculated expenditures per person per year across all women in each group regardless of whether they had a particular service ( Table 3 ). For the whole cohort of 7052 women with breast cancer, mean expenditure was $26 928 per person per year for ambulatory encounters (includes chemotherapy), $5594 per person per year for hospitalizations, $148 per person per year for emergency room visits, and $2056 per person per year for prescriptions. Among chemotherapy recipients, incremental expenditure for chemotherapy-related serious adverse effects (i.e., expenditure in excess of those made on behalf of the matched nonchemotherapy recipients) was $1271 per person per year ( Table 3 ). Chemotherapy recipients also had large incremental expenditures for inpatient care ($3213 per person per year), ambulatory encounters ($17 617 per person per year), and ambulatory co-payments ($299 per person per year). On an individual basis, the costs of chemotherapy-related serious adverse effects were striking: those who experienced chemotherapy-related serious adverse effects had large incremental expenditures for hospitalizations ($12 907 per person per year), prescriptions ($1908 per person per year), and prescription co-payments ($120 per person per year) compared with those who did not have chemotherapy-related serious adverse effects.
Incremental expenditures for patients receiving chemotherapy and for patients who experienced chemotherapy-related serious adverse effects (mean dollars per person per year) *
| Received chemotherapy (3526 of 7052 patients) | Experienced chemotherapy-related SAEs † (738 of 7052 patients) | |||||||||
|---|---|---|---|---|---|---|---|---|---|---|
| Type of expenditure | Yes | No | Incremental expenditure | Yes | No | Incremental expenditure | ||||
| Chemotherapy † | $7470 | 0 | $7470 | $7736 | $3267 | $4469 | ||||
| Hospitalizations or ER visits for chemotherapy-related SAEs ‡ | $1681 | $410 | $1271 | $9994 | 0 | $9994 | ||||
| Hospitalizations for all causes | $7200 | $3987 | $3213 | $17 150 | $4243 | $12 907 | ||||
| ER visits for all causes | $177 | $118 | $59 | $511 | $105 | $406 | ||||
| Ambulatory encounters § | $35 736 | $18 119 | $17 617 | $41 272 | $25 251 | $16 021 | ||||
| Ambulatory co-payments | $905 | $606 | $299 | $975 | $729 | $246 | ||||
| Prescriptions | $2640 | $1471 | $1169 | $3764 | $1856 | $1908 | ||||
| Prescription co-payments | $261 | $216 | $45 | $346 | $226 | $120 | ||||
Mean expenditures and incremental expenditures are presented for women who did and did not receive chemotherapy and for women who did and did not experience chemotherapy-related SAEs. The P value from t tests comparing expenditures among women who did and did not receive chemotherapy and among women who did and did not experience at least one SAE was <.001 in every category of expenditure. SAE = serious adverse effect; ER = emergency room.
Includes payments for chemotherapy medications and administration costs.
Includes payments for hospitalizations or ER visits for which chemotherapy-related SAEs were identified.
Includes payments for office visits, as well as procedures performed and chemotherapy administered in the outpatient setting.
D ISCUSSION
This study is the first, to our knowledge, of chemotherapy-related serious adverse effects in a population-based sample of younger women with breast cancer. We found that eight chemotherapy-related serious adverse effects may be more common than reported by large clinical trials ( Table 4 ), and, therefore, that these adverse effects may be responsible for more patient suffering and higher health care expenditures than currently predicted. There are several reasons why the rates of serious adverse effects in the general population could be greater than the rates reported by large clinical trials. First, clinical trials are designed and powered primarily to identify the benefits of chemotherapy, not to characterize the risks of serious adverse effects. If only a few thousand patients are exposed to a chemotherapy regimen, then a clinical trial may not detect uncommon serious adverse effects or it may detect them but generate inaccurate risk estimates for rare events ( 10 , 20 ) . Second, there are differences—in terms of age, race, disease severity, comorbidities, socioeconomic status, and educational status—between the small fraction of women with cancer who participate in clinical trials and the general population ( 21 – 28 ) . Participants in a clinical trial typically have a better prognosis than nonparticipants ( 29 – 33 ) and therefore may be less likely to experience serious adverse effects. Third, some ( 34 , 35 ) , although not all ( 36 , 37 ) , studies suggest that participation in a clinical trial could be associated with improved outcomes independent of the effects of the treatment under investigation. Fourth, clinical trials may not detect all serious adverse effects; a recent study investigating the ability of physicians to identify adverse events in the setting of a phase II clinical trial of chemotherapy found physician reports to be neither sensitive nor specific in identifying common adverse effects ( 6 ) . Fifth, clinical trials frequently do a poor job of reporting the frequency and severity of serious adverse effects identified during the course of a trial. A review of 192 randomized drug trials ( 7 ) found that 25% did not report the number of discontinuations due to toxicity and 54% of those that did failed to give specific reasons for the discontinuations. Moreover, 50% of the trials inadequately reported the severity of clinical adverse effects, and 63% failed to properly report the severity of lab-determined toxicities.
Frequencies of chemotherapy-related adverse effects in the general population and the clinical trial population of breast cancer patients *
| Type of adverse effect † | Our data | Du et al. ( 13 ) ‡ | Shapiro and Recht ( 12 ) § |
|---|---|---|---|
| Infection | 8.4% | 6.7% | <2% |
| Fever | 2.9% | <2% | |
| Neutropenia | 5.5% | 7.0% | <2% |
| Thrombocytopenia | 0.6% | <1% | |
| Anemia | 2.2% | 9.2% | <1% |
| Constitutional symptoms ‖ | 2.0% | 4.8% | NA |
| Nonspecific complications ¶ | 3.0% | NA | |
| Dehydration | 2.5% | 4.3% | NA |
| Electrolyte disorder | NA | NA | |
| Nausea | NA | <5% # | |
| Emesis | 2.4% | NA | |
| Diarrhea | NA | <5% | |
| DVT or PE | 1.3% | NA | <0.6% |
DVT = deep venous thrombosis; PE = pulmonary embolus; NA = not assessed.
Groups of adverse effects are those used in our analysis; the other studies divided some of these adverse effects into more specific conditions in their analysis or did not analyze them at all.
Adverse effects were ascertained for women over 65 from SEER–Medicare data indicating hospitalizations.
Adverse effects were determined in a clinical trial setting, where the National Cancer Institute's common terminology criteria were used to identify serious (grade 3–4) events. Although these events are considered serious, they do not necessarily lead to an emergency room visit or require hospitalization.
Constitutional symptoms include malaise, fatigue, dizziness, dysequilibrium, syncope, delirium, unspecified adverse effects of systemic therapy, complications of treatment, and nonspecific signs or symptoms.
Nonspecific symptoms can include adverse effects of systemic therapy, complications of treatment, or nonspecific signs or symptoms.
Frequency of nausea and emesis combined.
One other study has analyzed the frequency of chemotherapy-related serious adverse effects in the general population of women with breast cancer ( 13 ) . It differed from this one in that it used SEER–Medicare data to identify hospitalizations for serious adverse effects among women aged 65 years and older, whereas this study analyzed insurance claims for hospitalizations and emergency room visits among women aged 18–63 years. Our finding that rates of serious infections, fevers, and low blood counts were greater than reported in large clinical trials agrees with the results of the SEER–Medicare study ( Table 4 ). Our study also found that the rate of pulmonary embolus or deep venous thrombosis was greater than reported in clinical trials (these adverse effects were not examined in the prior study). The rates of several chemotherapy-related serious adverse effects, including anemia, neutropenia, thrombocytopenia, and dehydration, were lower in our study compared with those observed in the SEER–Medicare study ( 13 ) . One explanation for this difference could be that our study included younger patients who may have had greater marrow reserve, fewer comorbidities, or better baseline performance status. Also, our study included patients treated when the use of growth factors and newer antiemetics may have been more widespread than during the time frame of the previous study.
Few studies have examined the economic outcomes associated with chemotherapy-related serious adverse effects. We found that, for breast cancer patients, incremental expenditure for chemotherapy-related serious adverse effects was $1271 per chemotherapy recipient per year. Data from our population-based sample suggest that at least 35 000 women under age 64 receive chemotherapy for breast cancer each year in the United States. If this estimate is correct, then incremental expenditure for hospitalizations or emergency room visits due to chemotherapy-related serious adverse effects could reach $45 million per year. We found that expenditure for inpatient care was $3213 per person per year higher among chemotherapy recipients than for nonrecipients and $12 907 per person per year higher among women who experienced serious adverse effects compared to those who did not experience them. These costs are higher than previous estimates of incremental costs for cancer patients, which found that expenditure for hospitalizations was $2716 higher among metastatic colorectal cancer patients treated with 5-FU ( 38 ) and $2725–$5565 higher per chemotherapy cycle among cancer patients with chemotherapy-induced mucositis who had been treated for a variety of different cancers with chemotherapy cycles of various lengths ( 39 ) .
Our study also showed that mean monthly health care expenditure for women with breast cancer was $2894. This value compares well with those from a retrospective analysis of insurance claims for patients with seven different types of cancer, which found that mean monthly health care costs ranged from $2187 to $7616 ( 40 ) . Combining ambulatory co-payments, prescription co-payments, and deductible payments, out-of-pocket expenditures averaged $91 per month. However, this figure underestimates actual out-of-pocket expenditures because it includes only some of the costs incurred by women with breast cancer. Interviews with 156 breast cancer patients found that out-of-pocket expenditures and lost income costs averaged $1455 per month ( 41 ) .
The increased odds of chemotherapy-related serious adverse effects reported by our study may be biased, in part, because women who do not receive chemotherapy tend to be older and to have more comorbid conditions and because women who do receive chemotherapy tend to have more advanced disease. To limit the extent of this bias, a propensity score–based matching algorithm was used to identify a group of women who did not receive chemotherapy but were relatively similar to those who did. However, even after matching, heterogeneous distributions of unmeasured covariates could still have confounded odds ratio estimates. In any event, our estimates of the actual frequencies of chemotherapy-related serious adverse effects among women who received chemotherapy would not be affected by the composition of the control group or the matching process. Although matching did remove 549 women from the chemotherapy group, the rates of chemotherapy-related serious adverse effects in the original chemotherapy cohort (4075 patients) were nearly identical to those in the matched chemotherapy cohort (3526 patients), so this group's ability to reflect the general population of chemotherapy recipients was not compromised by the matching process.
Because the insurance claims analyzed in this study contained limited amounts of clinical data, it was not possible to control for stage or to establish a direct link between chemotherapy administration and particular serious adverse effects. Using only diagnostic and procedure codes to identify serious adverse effects could have overestimated their frequency. However, even if one considered only the additional serious adverse effects experienced by the chemotherapy group, the rates of chemotherapy-related serious adverse effects would have been 6% for infections or fevers and 11% for all causes––values that are still greater than those reported by large clinical trials. Identifying serious medical conditions that were common among women under 64 and completely unrelated to all chemotherapy medications used for breast cancer was particularly challenging; however, in support of our classification, the data showed that most of the chemotherapy-unrelated events were not more common in chemotherapy recipients than in nonrecipients ( Table 2 ).
In conclusion, our results suggest that breast cancer chemotherapy may cause more patient suffering and higher health care costs than previously estimated. The findings support assertions that clinical trials often lack external validity ( 8 ) and underscore the fact that health care providers must carefully decide whether trial results can be applied to routine clinical practice. Although our findings may not substantially alter estimates of breast cancer patients' overall survival, they have important implications for quality of life and could affect decisions regarding therapy.
To help patients make informed decisions, the risks and benefits of therapy must be presented in ways that are relevant to them. Compared with the NCI's common terminology criteria, hospitalization rates may be a less objective and systematic method of estimating the frequencies of treatment-related serious adverse effects. However, they do confer important information that patients may find valuable. Improving efforts to estimate the frequencies of treatment-related serious adverse effects and presenting this information in ways that patients find meaningful would generate a more complete picture of the impact treatments have on patients' lives and facilitate informed decision making.
Therapy and procedure codes
| Type of code | Codes | ||
|---|---|---|---|
| Chemotherapy | Anthracyclines | HCPCS level II | J9000, J9001, J9150, J9151, J9180, J9211, J9293 |
| Alkylators | HCPCS level II | J9070, J9080, J9090–J9097, J9280, J9290, J9291 | |
| Taxanes | HCPCS level II | J9170, J9265 | |
| Antimetabolites | HCPCS level II | J9190, J9201, J9250, J9260, J8610 | |
| Platinum | HCPCS level II | J9060, J9062 | |
| Vinca alkaloids | HCPCS level II | J9360, J9370, J9375, J9380, J9390 | |
| Other | HCPCS level I—CPT | 96400, 96408, 96410, 96412, 96414, 96545 | |
| HCPCS level II | J9010, J9015, J9020, J9031, J9040, J9045, J9050, J9065, J9100, J9110, J9120, J9130, J9140, J9165, J9181, J9182, J9185, J9200, J9201, J9202, J9206, J9208, J9209, J9211–J9218, J9230, J9245, J9250, J9260, J9265, J9266, J9268, J9270, J9280, J9290, J9291, J9295, J9310, J9320, J9340, J9350, J9355, J9357, J9600, J9999, J8999, J8510, Q0083–Q0085 | ||
| ICD-9 diagnostic | v58.1, v66.2, v67.2 | ||
| ICD-9 procedure | 99.25 | ||
| DRG | 410 | ||
| Surgery | Mastectomy | HCPCS level I—CPT | 19180, 19182, 19184, 19185, 19186, 19187, 19200, 19211, 19212, 19213, 19214, 19215, 19216, 19220, 19224, 19225, 19226, 19227, 19228, 19229, 19240, 19250, 19251, 19252, 19253, 19254, 19255 |
| ICD-9 procedure | 85.4x | ||
| DRG | 257, 258 | ||
| Subtotal mastectomy | HCPCS level I—CPT | 19120, 19125, 19126, 19160, 19162 | |
| ICD-9 procedure | 85.20, 85.21, 85.22, 85.23 | ||
| DRG | 259, 260 | ||
| Radiation therapy | HCPCS level I—CPT | 77xxx | |
| ICD-9 diagnostic | v58.0, v66.1, v67.1 | ||
| ICD-9 procedure | 92.2, 92.3 | ||
| DRG | 409 | ||
| Pathology | HCPCS level I—CPT | 80500, 80502, 88104, 88106–88108, 88199, 88302, 88304, 88305, 88307, 88309, 88329, 88331, 88332, 89130, 89132, 89399 | |
| ICD-9 procedure | 90.06, 90.09, 90.16, 90.19, 90.26, 90.29, 90.36, 90.39, 90.46, 90.49, 90.56, 90.66, 90.69, 90.76, 90.79, 90.86, 90.89, 90.96, 90.99, 91.06, 91.09, 91.16, 91.19, 91.26, 91.29, 91.36, 91.39, 91.46, 91.49, 91.56, 91.59, 91.66, 91.69, 91.76, 91.79, 91.86, 91.89 | ||
| Antiemetics | HCPCS level II | J0780, J1094, J1100, J1260, J1626, J1630, J1700, J1710, J1720, J2060, J2405, J2550, J2600, J2765, J7506, J7510, Q0163–Q0179, Q0181, K0145, K0146 | |
| Drug name | Aprepitant, dolasetron anzamet, granisetron, kytril, ondansetron, zofran | ||
| Growth factors | HCPCS level II | J0880, J1440, J1441, J2505, J2820, Q4054, Q9920–Q9940, Q0136 | |
| Trastuzumab and hormonal therapies | Drug name | Herceptin, trastuzumab, nolvadex, tamoxifen, farestom, toremifeme, evista, raloxifene, arimidex, anastrozole, femara, letrozole, aromasin, exemestane, faslodex, fulvestrant |
Adverse effects
| Description | Diagnosis | ICD-9 code | DRG code |
|---|---|---|---|
| Abnormal electrolytes or dehydration | Hyponatremia | 276.1 | |
| Hypokalemia | 276.8 | ||
| Electrolyte disorder | 276.9 | ||
| Injection/infusion of electrolytes | 99.18 | ||
| Dehydration/hypovolemia | 276.5 | ||
| Constitutional symptoms and nonspecific | Malaise/fatigue | 780.79 | |
| symptoms associated with therapy | Syncope | 780.2 | |
| Dizziness | 780.4 | ||
| Dysequilibrium | 065 | ||
| Syncope | 141–142 | ||
| Adverse effects of systemic therapy | E9331 | ||
| Complications of treatment with or without chief complaint | 452–453 | ||
| Signs/symptoms with or without chief complaint | 463–464 | ||
| Nausea, emesis, and diarrhea | Diarrhea | 787.91 | |
| Functional diarrhea | 564.5 | ||
| Nausea/emesis | 787.0 | ||
| Infection and fever | Bronchitis | 490 | |
| Pneumonia | 480–486 | ||
| Flu | 487 | ||
| Kidney infection | 590 | ||
| Acute cystitis | 595.0 | ||
| Cellulitis | 681–682 | ||
| Empyema | 510 | ||
| Abscess of lung/mediastinum | 513 | ||
| Long-term current use of antibiotics | V58.62 | ||
| Other: septicemia | 038.9 | ||
| Bacteremia | 790.7 | ||
| Shock/septicemia—unspecificed | 785.50 | ||
| Shock/septicemia—septic | 785.52 | ||
| Shock/septicemia—other | 785.59 | ||
| Fever | 780.6 | ||
| Respiratory infection > 17 | 079–080 | ||
| Pneumonia > 17 | 089–090 | ||
| Cellulites > 17 | 277–278 | ||
| Kidney/urinary tract infection | 320–321 | ||
| Septicemia | 416 | ||
| Fever unknown origin > 17 | 419–420 | ||
| Other infection and parasitic disease | 423 | ||
| Inject antibiotics | 99.21 | ||
| Injection of other anti-infective | 99.22 | ||
| 90 788 | |||
| Malnutrition | Abnormal weight loss | 783.21 | |
| Failure to thrive—adult | 783.7 | ||
| Cachexia | 799.4 | ||
| Anorexia | 783.0 | ||
| Underweight | 783.22 | ||
| Malnutrition | 263.9 | ||
| Parenteral infusion of PPN, TPN, etc. | 99.15 | ||
| Nutritional/metabolic disorder | 296–297 | ||
| Anemia & red cell transfusion | Iron deficiency anemias | 280 | |
| Other deficiency anemias | 281 | ||
| Aplastic anemia | 284 | ||
| Other and unspecified anemias | 285 | ||
| Blood transfusion without reported diagnosis | V58.2 | ||
| Transfusion—whole blood | 99.03 | ||
| Transfusion—packed cells | 99.04 | ||
| 364.30 | |||
| Anemia | 395 | ||
| Neutropenia or thrombocytopenia | Neutropenia | 288.0 | |
| Other specified diseases of white blood cells | 288.8 | ||
| Unspecified diseases of white blood cells | 288.9 | ||
| Thrombocytopenia | 287.4 | ||
| Transfusion of platelets | 99.05 | ||
| DVT or PE | Thrombophlebitis—deep veins | 451 | |
| Pulmonary embolism | 78 | ||
| Pulmonary embolism | 415.19 | ||
| Fractures or dislocations | Any fracture | 800–829 | |
| Any dislocation | 830–839 | ||
| Fracture femur, hip, or pelvis | 235, 236 | ||
| Asthma or chronic obstructive pulmonary disease | Chronic bronchits with or without acute exacerbation | 491 | |
| Emphysema | 492 | ||
| Asthma | 493 | ||
| Chronic obstructive pulmonary disease | 088 | ||
| Renal failure | Acute renal failure | 584 | |
| Chronic renal failure | 585 | ||
| Renal failure | 316 | ||
| Renal failure unspecified | 586 | ||
| Thyroid disorders | Goiter | 240, 241 | |
| Thyrotoxicosis | 242 | ||
| Congenital hypothyroidism | 243 | ||
| Hypothroid—other reasons | 244 | ||
| Thyroiditis | 245 | ||
| Headache | Headache | 784.0 | |
| Migraine | 346 |
This research was supported by grant PO1-HS10803 from the Agency for Healthcare Research and Quality. Dr. Hassett received salary support from R25 CA092203. The sponsors had no direct influence on the design of the study, analysis of the data, interpretation of the results, or writing of the manuscript. J. Newhouse holds stock in and is a director of Aetna.
References
Nebeker JR, Barach P, Samore MH. Clarifying adverse drug events: a clinician's guide to terminology, documentation, and reporting [see comment].
Edwards IR, Aronson JK. Adverse drug reactions: definitions, diagnosis, and management [see comment].
Pirmohamed M, James S, Meakin S, Green C, Scott AK, Walley TJ, et al. Adverse drug reactions as cause of admission to hospital: prospective analysis of 18 820 patients [see comment].
Lazarou J, Pomeranz BH, Corey PN. Incidence of adverse drug reactions in hospitalized patients: a meta-analysis of prospective studies [see comment].
Kohn LT, Corrigan J, Donaldson MS. To err is human: building a safer health system. Washington (DC): National Academy Press;
Fromme EK, Eilers KM, Mori M, Hsieh YC, Beer TM. How accurate is clinician reporting of chemotherapy adverse effects? A comparison with patient-reported symptoms from the Quality-of-Life Questionnaire C30.
Ioannidis JP, Lau J. Completeness of safety reporting in randomized trials: an evaluation of 7 medical areas.
Rothwell PM. External validity of randomised controlled trials: “to whom do the results of this trial apply?” [see comment].
Ladewski LA, Belknap SM, Nebeker JR, Sartor O, Lyons EA, Kuzel TC, et al. Dissemination of information on potentially fatal adverse drug reactions for cancer drugs from 2000 to 2002: first results from the research on adverse drug events and reports project. [erratum in J Clin Oncol 2004;22:1169].
Jemal A, Murray T, Ward E, Samuels A, Tiwari RC, Ghafoor A, et al. Cancer statistics, 2005.
Shapiro CL, Recht A. Side effects of adjuvant treatment of breast cancer.
Du XL, Osborne C, Goodwin JS. Population-based assessment of hospitalizations for toxicity from chemotherapy in older women with breast cancer.
Charlson ME, Pompei P, Ales KL, MacKenzie CR. A new method of classifying prognostic comorbidity in longitudinal studies: development and validation.
Klabunde CN, Potosky AL, Legler JM, Warren JL. Development of a comorbidity index using physician claims data.
Deyo RA, Cherkin DC, Ciol MA. Adapting a clinical comorbidity index for use with ICD-9-CM administrative databases.
D'Agostino RB Jr. Propensity score methods for bias reduction in the comparison of a treatment to a non-randomized control group.
Joffe MM, Rosenbaum PR. Invited commentary: propensity scores.
Land SR, Kopec JA, Yothers G, Anderson S, Day R, Tang G, et al. Health-related quality of life in axillary node-negative, estrogen receptor-negative breast cancer patients undergoing AC versus CMF chemotherapy: findings from the National Surgical Adjuvant Breast and Bowel Project B-23.
Hampson JP, Harvey JN. Postmarketing surveillance and black box warnings [comment].
Aapro MS, Kohne CH, Cohen HJ, Extermann M. Never too old? Age should not be a barrier to enrollment in cancer clinical trials.
Britton A, McKee M, Black N, McPherson K, Sanderson C, Bain C. Threats to applicability of randomised trials: exclusions and selective participation.
Bugeja G, Kumar A, Banerjee AK. Exclusion of elderly people from clinical research: a descriptive study of published reports [see comment].
Adams-Campbell LL, Ahaghotu C, Gaskins M, Dawkins FW, Smoot D, Polk OD, et al. Enrollment of African Americans onto clinical treatment trials: study design barriers.
Gross CP, Filardo G, Mayne ST, Krumholz HM. The impact of socioeconomic status and race on trial participation for older women with breast cancer.
Murthy VH, Krumholz HM, Gross CP. Participation in cancer clinical trials: race-, sex-, and age-based disparities [see comment].
Simon MS, Du W, Flaherty L, Philip PA, Lorusso P, Miree C, et al. Factors associated with breast cancer clinical trials participation and enrollment at a large academic medical center [see comment].
Talarico L, Chen G, Pazdur R. Enrollment of elderly patients in clinical trials for cancer drug registration: a 7-year experience by the US Food and Drug Administration.
Antman K, Amato D, Wood W, Carson J, Suit H, Proppe K, et al. Selection bias in clinical trials.
Bertelsen K. Protocol allocation and exclusion in two Danish randomised trials in ovarian cancer.
Chen CI, Skingley P, Meyer RM. A comparison of elderly patients with aggressive histology lymphoma who were entered or not entered on to a randomized phase II trial.
Hjorth M, Holmberg E, Rodjer S, Westin J. Impact of active and passive exclusions on the results of a clinical trial in multiple myeloma. The Myeloma Group of Western Sweden.
Rahman ZU, Frye DK, Buzdar AU, Smith TL, Asmar L, Champlin RE, et al. Impact of selection process on response rate and long-term survival of potential high-dose chemotherapy candidates treated with standard-dose doxorubicin-containing chemotherapy in patients with metastatic breast cancer [see comment].
Stiller CA. Centralised treatment, entry to trials and survival.
Braunholtz DA, Edwards SJ, Lilford RJ. Are randomized clinical trials good for us (in the short term)? Evidence for a “trial effect”.
Peppercorn JM, Weeks JC, Cook EF, Joffe S. Comparison of outcomes in cancer patients treated within and outside clinical trials: conceptual framework and structured review [see comment].
Vist GE, Hagen KB, Devereaux PJ, Bryant D, Kristoffersen DT, Oxman AD. Systematic review to determine whether participation in a trial influences outcome [see comment].
Delea TE, Vera-Llonch M, Edelsberg JS, McGarry L, Anton S, Ulcickas-Yood M, et al. The incidence and cost of hospitalization for 5-FU toxicity among Medicare beneficiaries with metastatic colorectal cancer.
Elting LS, Cooksley C, Chambers M, Cantor SB, Manzullo E, Rubenstein EB. The burdens of cancer therapy. Clinical and economic outcomes of chemotherapy-induced mucositis [see comment].
Chang S, Long SR, Kutikova L, Bowman L, Finley D, Crown WH, et al. Estimating the cost of cancer: results on the basis of claims data analyses for cancer patients diagnosed with seven types of cancer during 1999 to 2000.

