


Abstract
Background: Risk prediction models for breast cancer can be improved by the addition of recently identified risk factors, including breast density and use of hormone therapy. We used prospective risk information to predict a diagnosis of breast cancer in a cohort of 1 million women undergoing screening mammography. Methods: There were 2 392 998 eligible screening mammograms from women without previously diagnosed breast cancer who had had a prior mammogram in the preceding 5 years. Within 1 year of the screening mammogram, 11 638 women were diagnosed with breast cancer. Separate logistic regression risk models were constructed for premenopausal and postmenopausal examinations by use of a stringent ( P <.0001) criterion for the inclusion of risk factors. Risk models were constructed with 75% of the data and validated with the remaining 25%. Concordance of the predicted with the observed outcomes was assessed by a concordance (c) statistic after logistic regression model fit. All statistical tests were two-sided. Results: Statistically significant risk factors for breast cancer diagnosis among premenopausal women included age, breast density, family history of breast cancer, and a prior breast procedure. For postmenopausal women, the statistically significant factors included age, breast density, race, ethnicity, family history of breast cancer, a prior breast procedure, body mass index, natural menopause, hormone therapy, and a prior false-positive mammogram. The model may identify high-risk women better than the Gail model, although predictive accuracy was only moderate. The c statistics were 0.631 (95% confidence interval [CI] = 0.618 to 0.644) for premenopausal women and 0.624 (95% CI = 0.619 to 0.630) for postmenopausal women. Conclusion: Breast density is a strong additional risk factor for breast cancer, although it is unknown whether reduction in breast density would reduce risk. Our risk model may be able to identify women at high risk for breast cancer for preventive interventions or more intensive surveillance.
The Gail breast cancer risk model was developed in the late 1980s with information from women undergoing annual mammography screening in the Breast Cancer Detection Demonstration Project ( 1 , 2 ) . The Gail model uses retrospective risk factor information that was collected in a case–control study embedded in the cohort study. Those data were coupled with cancer incidence rates obtained from the National Cancer Institute's (NCI) Surveillance, Epidemiology, and End Results (SEER) program to estimate the probability that a woman who undergoes annual screening will be diagnosed with invasive breast cancer within the next 5 years. The Gail model used risk factors known at the time (i.e., in 1989), including current age, age at menarche, age at birth of first child, number of first-degree relatives with a family history of breast cancer, and number of previous breast biopsy examinations. Race and atypical hyperplasia were added in a revised model ( 1 , 2 ) .
The Gail model has been validated ( 2 – 6 ) , although the predictive accuracy and calibration of the model are only fair ( 5 – 13 ) . Predictive accuracy is the ability to correctly predict the outcome for an individual woman, and calibration measures the predicted versus actual number of breast cancers in a cohort. The predictive accuracy of the model is highest in annually screened non-Hispanic white women and is lowest in women with different demographic characteristics (age, race, ethnicity, and nationality) than the population from which the model was developed ( 8 – 13 ) . Women with high Gail scores have been encouraged to be screened, to undergo genetic or biomarker evaluation, and to participate in intervention trials ( 14 – 20 ) . The Gail model is also used to estimate the number of expected breast cancers in a particular population ( 21 – 23 ) . Consequently, both predictive accuracy and calibration of the model are important.
Risk prediction models for breast cancer may be improved by the addition of recently identified risk factors, including breast density and use of hormone therapy. It may be desirable to include other routinely available risk factors and to have separate models for premenopausal and postmenopausal women. Recently, higher breast density has been shown to be strongly associated with breast cancer risk ( 24 – 31 ) . Other factors associated with breast cancer risk include use of hormone therapy, high body mass index (BMI), and the result of the previous mammographic examination ( 32 – 42 ) . Finally, the effects of race and ethnicity on risk models have not been well validated or explored ( 10 – 11 , 43 ) . For example, Asian women are assigned the risk of white women in the online Gail risk model ( http://www.cancer.gov/bcrisktool/ ), although Asian women have a markedly lower incidence rate of breast cancer than white women ( 44 ) .
To develop an enhanced breast cancer risk model requires a large cohort with measured risk factors and well-ascertained cancer status. The Breast Cancer Surveillance Consortium (BCSC) was established in 1994 by the NCI to assess community mammography practice and outcomes ( 45 ) , collect risk factors prospectively at the time of each screening mammogram, and ascertain cancer outcomes for all women. In this report, we used data from the BCSC to estimate the probability of a diagnosis of incident breast cancer (invasive breast cancer or ductal carcinoma in situ) after a screening mammogram. Although most breast cancers were detected shortly after the screening mammogram, we included breast cancers diagnosed within 1 year, a commonly recommended screening interval ( 46 ) . To estimate probabilities, we developed a model that includes traditional risk factors and adds others including race, ethnicity, breast density, BMI, use of hormone therapy, type of menopause, and previous mammographic result.
P ATIENTSAND M ETHODS
Study Population
Seven mammography registries of the BCSC ( http://breastscreening.cancer.gov ) participated in this study (Carolina Mammography Registry, Colorado Mammography Project, Group Health Cooperative's Breast Cancer Surveillance Project, New Hampshire Mammography Network, New Mexico Mammography Project, San Francisco Mammography Registry, and the Vermont Breast Cancer Surveillance System) ( 45 ) . The mammography registries are community based and located in geographic areas that broadly represent the United States ( 47 ) . Screening mammograms in the calendar period from January 1, 1996, through December 31, 2002 (or December 31, 2001, at one registry), from women aged 35–84 years were included. Women with previous breast cancer were excluded. Women with breast augmentation were also excluded because augmentation decreases breast cancer detection by mammography ( 48 ) . We also restricted our analysis to women who had a known previous mammogram (screening or diagnostic) or who self-reported a mammogram within the last 5 years, to eliminate women with long-term prevalent breast cancers. There were 2 392 998 eligible screening mammograms from women without previously diagnosed breast cancer who had had a prior mammogram in the preceding 5 years. Within 1 year of the screening mammogram, 11 638 women were diagnosed with breast cancer.
Each mammography registry actively links mammography records to cancer outcomes recorded in cancer registry or pathology data. De-identified mammography and outcome data were sent to the BCSC Statistical Coordinating Center for analysis. Procedures for maintaining confidentiality have been described previously ( 49 ) . All study activities were approved by the institutional review boards of the participating institutions.
Screening Mammograms and Risk Factors
Screening examinations had to be designated as bilateral screening by the radiology facility and needed to be done at least 9 months after any preceding breast imaging to ensure an accurate designation as a screening mammogram. Patient information was primarily obtained from self-report at the time of the screening mammogram. Questionnaires may differ across registries or calendar time, but all contain certain core elements (available at http://breastscreening.cancer.gov/elements.html#questionnaires ). Questions include information about birth date, race, ethnicity, education, time since last mammogram, personal or family history of breast cancer, prior breast procedures, age at menarche, age at the birth of first child, menopausal status, age at menopause, type of menopause, and current use of hormone therapy. Prior breast procedure included self-reported breast biopsy, fine needle aspiration, cyst aspiration, breast reconstruction, lumpectomy, or mastectomy, but women with previous breast cancer in either breast were excluded. Prior pathologic findings such as lobular carcinoma in situ or atypical hyperplasia were not available for all women and so were not included as predictors. Age at menarche was often not collected or not reported, but it was tested as a risk factor in women who reported it. Height and weight were only recently added to the questionnaire, and so BMI (weight in kilograms/[height in meters] 2 ) was available primarily for recent examinations. Family history in this report refers to the number of first-degree relatives with breast cancer (classified as none, one, or two or more).
When results are presented without regard to menopausal status, they include screening mammograms from all women aged 35–84 years. For the analysis of premenopausal women, we included only women aged 35–54 years who stated that they were still having periods. Analyses of postmenopausal women included all women aged 55 years or older and women aged 45–54 years who reported their periods had stopped permanently or who were on hormone therapy. Women aged 35–54 years of unknown menopausal status were excluded from both pre- and postmenopausal models to avoid misclassification. Postmenopausal women were classified as having surgical menopause if the woman reported that surgery was responsible for the cessation of menstruation. It was not always possible to ascertain whether the woman had oophorectomy and/or hysterectomy.
We included only information known at the time of each mammogram even though additional information became known subsequent to the mammogram. Data were missing primarily because the item was not on the mammography registry's questionnaire and secondarily because the woman chose not to report this information. We included “unknown” as a category in most analyses.
In addition to self-reported data, breast density was also recorded at the time of the mammogram and was typically classified by use of the four categories in the Breast Imaging Reporting and Data System (BI-RADS) coding system: 1) almost entirely fat, 2) scattered fibroglandular densities, 3) heterogeneously dense, and 4) extremely dense ( 50 ) . This method is the predominant method for reporting breast density among radiologists, and efforts are under way to standardize its reporting ( 50 ) because use of the scale can vary among radiologists ( 51 , 52 ). If breast density was recorded using a different system or was not recorded at all, then it was classified as “unknown.”
All women had a prior mammogram in the last 5 years. If the previous mammogram was in our data, then the final interpretation of that previous mammogram was categorized as false positive (BI-RADS category of 0, 4, 5, or 3 with immediate follow-up) or true negative (BI-RADS category of 1, 2, or 3 without immediate follow-up) ( 50 ) . Women with previous true-positive or false-negative mammograms would have been excluded because of prior breast cancer.
Follow-up for Breast Cancer
Women were classified as having breast cancer if there was a breast cancer diagnosis within 1 year of the screening mammogram. We used 1 year because women were encouraged to be screened every 1–2 years, and the observation period was truncated by a new screening examination. Breast cancer cases were identified through linkage of each mammography registry to a cancer registry or pathology data. Both invasive carcinoma and ductal carcinoma in situ were included as breast cancer, although some analyses included invasive cancer only. Lobular carcinoma in situ was not included as a breast carcinoma, and women with this diagnosis continued to be screened.
Statistical Analysis
We evaluated the probability of a cancer diagnosis within 1 year of each screening mammogram by use of logistic regression analysis in SAS, Version 9.0 ( 53 ) , and Stata, Version 8 ( 54 ) . The primary goal was to find a model that best predicted a diagnosis of breast cancer separately in premenopausal and postmenopausal women with a minimal number of predictors. Because the number of observations was very large, small effects can be statistically significant at usual nominal levels such as .05. Consequently, we included only covariates that were statistically significant at a very stringent level of P less than .0001. All P values were from two-sided tests, when possible.
We did not include interaction terms to keep the model parsimonious, but a few interactions were tested as noted below. Because of the potential for overfitting, we used a 75% random sample (training sample) to generate and test different statistical models before determining a final model. We then tested the prediction in the remaining 25% (validation sample) with estimates derived from the model of the training data. We report the concordance value (i.e., the c statistic) for the validation sample by use of the estimates derived from the training sample. The c statistic ranges from 0.50 to 1.00, with a higher score indicating better prediction for an individual woman ( 55 ) . Approximate 95% confidence intervals (CIs) for the c statistic (or for the area under the curve) are derived from an empirical receiver-operator curve analysis, by treating the estimated score from the logistic regression model as a continuous marker of cancer risk ( 54 ) . The c statistic may also be stratified by age group to determine the remaining effect of the other predictors ( 56 ) . We also tested the goodness-of-fit of the data to the estimated model by use of the Hosmer–Lemeshow test ( 55 ) . After the training sample was used to guide model development and the validation sample was used to test model prediction, we consolidated the data to estimate the coefficients for the final prediction model. Thus, reported odds ratios, 95% confidence intervals, and P values were from the full dataset, although the training sample was used to choose predictors and the validation sample was used to assess prediction.
In these analyses, the screening mammogram is the unit of analysis because many of the associated characteristics (e.g., age, breast density, menopausal status, or prior mammogram result) can change over time. We considered several possible regression approaches to address the complexity introduced by a woman having several screening mammograms during the study period. Many women (38%) had only a single screening mammogram, 52% had two to four screening mammograms, and 10% had five or more screening mammograms. However, this cohort was an open cohort, so that not all women were under observation for the same length of time. Choosing only one mammogram per woman would underestimate the contribution of women who are regularly screened compared with women who may have a single screening mammogram over the study period. To parallel the data used in the Gail model, it was important to include all screening examinations from women undergoing annual or biannual screening. A diagnosis of breast cancer would make her ineligible for further screening examinations. Therefore, the only possible sequence for a woman would be a series of screening mammograms with a negative outcome (no cancer) followed by a last screening mammogram that could be either negative or positive (cancer diagnosis). Thus, all cancers were found on the last screening examination that a woman had. If only the last mammogram was chosen for each woman, then the cancer risk would be biased upward because all preceding negative examinations would be ignored.
We used several alternative models to address the possible correlation of mammograms within a woman, but the results were almost identical to the one used here, a standard logistic regression model for each mammogram. These alternative models include 1) a model of the sequence of screening examinations that uses a negative binomial model of time to first failure (cancer diagnosis), 2) a Poisson regression model, and 3) logistic regression that uses a generalized estimating equations approach for all mammograms from the same woman ( 57 ) . These alternative models gave very similar results because of the low outcome rate and the low correlation between examinations after adjustment for risk factors ( 58 ) . We used a standard logistic model because it allows estimation of the concordance between prediction and outcome (by the c statistic) and because the odds ratio is a good approximation to the risk ratio ( 59 ) .
We also compared our absolute incidence rates with those reported by the SEER program over the same calendar period ( 60 ) . The incidence rates and the percentage of all breast cancers that were invasive were computed by use of the SEER*STAT program ( 61 ) . Confidence intervals for rates were computed by use of the normal approximation of the binomial distribution. We reported incidence rates per 1000 examinations (or per 1000 women in SEER). We also show the percentage of women reporting a screening mammogram in the last 2 years according to data from the National Health Interview Survey (N. Breen for data from the 2003 National Health Interview Survey: personal communication).
Data Availability
Other investigators may wish to explore modification of risk factors by demographic factors or statistical issues, such as the effect of data imputation for missing values, or alternative estimation models. To aid in this exploration, these data will be available to others by following the link http://breastscreening.cancer.gov/rfdataset/ . The particular dataset used in this study was a large cross-classification of risk factors by cancer outcome.
R ESULTS
There were 2 884 197 screening mammograms, but we included only the 2 392 998 (83.0%) index screening mammograms from 1 007 600 women who had had a previous mammogram in the prior 5 years. Breast cancer was diagnosed within 1 year of a screening mammogram in 11 638 women, for an absolute rate of 4.86 breast cancers per 1000 screening mammograms (95% CI = 4.78 to 4.95). Most (75.7%) of these 11 638 breast cancers were diagnosed within 3 months of the screening mammogram.
Risk factors vary by menopausal status, so that separate models were fit for premenopausal and postmenopausal women. This procedure required excluding 7.6% of the mammograms from women aged 45–54 years with unknown menopausal status. The remaining mammograms were classified as premenopausal (n = 568 215; 25.7%) or postmenopausal (n = 1 642 824; 74.3%). There were 1726 breast cancers among premenopausal women, for an absolute rate of 3.04 per 1000 screening mammograms (95% CI = 2.89 to 3.18), and 9300 breast cancers among postmenopausal women, for an absolute rate of 5.66 per 1000 screening mammograms (95% CI = 5.55 to 5.78).
Distribution of Risk Factors
We next determined the distribution of demographic factors and cancer rates per 1000 screening mammograms by menopausal status ( Table 1 ). The cancer rates suggest that risk patterns are dissimilar for premenopausal and postmenopausal women. For example, premenopausal women had decreasing breast cancer rates with increasing BMI, but postmenopausal women had increasing cancer rates with increasing BMI ( Table 2 ).
Distribution of demographic factors by menopausal status and cancer rate per 1000 screening mammograms in the Breast Cancer Surveillance Consortium *
| Premenopausal | Postmenopausal | |||||||||
|---|---|---|---|---|---|---|---|---|---|---|
| Factor | No. (%) † | No. of cancers | Rate ‡ (95% CI) | No. (%) † | No. of cancers | Rate ‡ (95% CI) | ||||
| Total | 568 215 | 1726 | 3.04 (2.89 to 3.18) | 1 642 824 | 9300 | 5.66 | ||||
| Age group, y | ||||||||||
| 35–39 | 37 043 (6.5) | 75 | 2.02 (1.57 to 2.48) | |||||||
| 40–44 | 239 273 (42.1) | 539 | 2.25 (2.06 to 2.44) | |||||||
| 45–49 | 194 584 (34.2) | 693 | 3.56 (3.30 to 3.83) | 126 768 (7.7) | 361 | 2.85 (2.55 to 3.14) | ||||
| 50–54 | 97 315 (17.1) | 419 | 4.31 (3.89 to 4.72) | 268 655 (16.4) | 1022 | 3.80 (3.57 to 4.04) | ||||
| 55–59 | 334 132 (20.3) | 1795 | 5.37 (5.12 to 5.62) | |||||||
| 60–64 | 263 521 (16.0) | 1576 | 5.98 (5.69 to 6.27) | |||||||
| 65–69 | 231 904 (14.1) | 1467 | 6.33 (6.00 to 6.65) | |||||||
| 70–74 | 203 106 (12.4) | 1420 | 6.99 (6.63 to 7.35) | |||||||
| 75–79 | 145 102 (8.8) | 1089 | 7.51 (7.06 to 7.95) | |||||||
| 80–84 | 69 636 (4.2) | 570 | 8.19 (7.52 to 8.85) | |||||||
| Race | ||||||||||
| White | 411 734 (85.6) | 1239 | 3.01 (2.84 to 3.18) | 1 209 930 (87.0) | 7049 | 5.83 (5.69 to 5.96) | ||||
| Asian/Pacific Islander | 29 637 (6.2) | 98 | 3.31 (2.65 to 3.96) | 66 284 (4.8) | 315 | 4.75 (4.23 to 5.28) | ||||
| Black | 28 468 (5.9) | 79 | 2.78 (2.16 to 3.39) | 81 948 (5.9) | 457 | 5.58 (5.07 to 6.09) | ||||
| Native-American/Alaskan Native | 4479 (0.9) | 14 | 3.13 (1.49 to 4.76) | 18 918 (1.4) | 61 | 3.22 (2.42 to 4.03) | ||||
| Other | 6697 (1.4) | 28 | 4.18 (2.64 to 5.73) | 14 278 (1.0) | 70 | 4.90 (3.76 to 6.05) | ||||
| Unknown | 87 200 [15.3] | 268 | 3.07 (2.71 to 3.44) | 251 466 [15.3] | 1348 | 5.36 (5.08 to 5.65) | ||||
| Hispanic | ||||||||||
| No | 427 598 (92.4) | 1295 | 3.03 (2.86 to 3.19) | 1 209 335 (92.1) | 7091 | 5.86 (5.73 to 6.00) | ||||
| Yes | 35 290 (7.6) | 85 | 2.41 (1.90 to 2.92) | 103 682 (7.9) | 439 | 4.23 (3.84 to 4.63) | ||||
| Unknown | 105 327 [18.5] | 346 | 3.29 (2.94 to 3.63) | 329 807 [20.1] | 1770 | 5.37 (5.12 to 5.62) | ||||
| Education | ||||||||||
| <HS graduate | 15 632 (3.9) | 60 | 3.84 (2.87 to 4.81) | 125 927 (11.6) | 720 | 5.72 (5.30 to 6.13) | ||||
| HS graduate/GED | 73 085 (18.4) | 220 | 3.01 (2.61 to 3.41) | 330 102 (30.3) | 1776 | 5.38 (5.13 to 5.63) | ||||
| Some college/technical | 104 643 (26.3) | 314 | 3.00 (2.67 to 3.33) | 296 065 (27.2) | 1748 | 5.90 (5.63 to 6.18) | ||||
| College degree | 204 916 (51.5) | 701 | 3.42 (3.17 to 3.67) | 336 181 (30.9) | 2037 | 6.06 (5.80 to 6.32) | ||||
| Unknown | 169 939 [29.9] | 431 | 2.54 (2.30 to 2.78) | 554 549 [33.8] | 3019 | 5.44 (5.25 to 5.64) | ||||
CI = confidence interval; HS = high school; GED = general educational development.
Percentages in square brackets excluded the unknown category from calculation of 100%.
Rate is presented as number per 1000 screening mammograms.
Distribution of risk factors by menopausal status and cancer rate per 1000 screening mammograms *
| Premenopausal | Postmenopausal | |||||||||
|---|---|---|---|---|---|---|---|---|---|---|
| Factor | No. (%) † | No. of cancers | Rate (95% CI) ‡ | No. (%) † | No. of cancers | Rate (95% CI) ‡ | ||||
| Age at birth of first child, y | ||||||||||
| <30 | 156 924 (53.7) | 470 | 3.00 (2.72 to 3.27) | 546 295 (73.8) | 3093 | 5.66 (5.46 to 5.86) | ||||
| ≥30 | 65 514 (22.4) | 226 | 3.45 (3.00 to 3.90) | 72 347 (9.8) | 485 | 6.70 (6.11 to 7.30) | ||||
| Nulliparous | 70 049 (23.9) | 253 | 3.61 (3.17 to 4.06) | 121 812 (16.5) | 798 | 6.55 (6.10 to 7.00) | ||||
| Unknown | 275 728 [48.5] | 777 | 2.82 (2.62 to 3.02) | 902 370 [54.9] | 4924 | 5.46 (5.30 to 5.61) | ||||
| First-degree family history of breast cancer | ||||||||||
| No | 427 656 (84.6) | 1234 | 2.89 (2.72 to 3.05) | 1 199 921 (84.7) | 6421 | 5.35 (5.22 to 5.48) | ||||
| Yes (one or more relatives) | 77 929 (15.4) | 350 | 4.49 (4.02 to 4.96) | 215 899 (15.3) | 1623 | 7.52 (7.15 to 7.88) | ||||
| One relative | 75 106 (14.9) | 332 | 4.42 (3.95 to 4.89) | 203 569 (14.4) | 1502 | 7.38 (7.01 to 7.75) | ||||
| Two or more relatives | 2823 (0.6) | 18 | 6.38 (3.44 to 9.31) | 12 330 (0.9) | 121 | 9.81 (8.07 to 11.55) | ||||
| Unknown | 62 630 [11.0] | 142 | 2.27 (1.89 to 2.64) | 227 634 [13.9] | 1256 | 5.52 (5.21 to 5.82) | ||||
| BMI, kg/m2 | ||||||||||
| <25 | 142 416 (54.3) | 460 | 3.23 (2.94 to 3.52) | 332 255 (45.6) | 1864 | 5.61 (5.36 to 5.86) | ||||
| 25–29 | 69 476 (26.5) | 212 | 3.05 (2.64 to 3.46) | 237 278 (32.5) | 1408 | 5.93 (5.62 to 6.24) | ||||
| 30–34 | 31 003 (11.8) | 92 | 2.97 (2.36 to 3.57) | 105 598 (14.5) | 643 | 6.09 (5.62 to 6.56) | ||||
| ≥35 | 19 510 (7.4) | 55 | 2.82 (2.08 to 3.56) | 53 998 (7.4) | 334 | 6.19 (5.52 to 6.85) | ||||
| Unknown | 305 810 [53.8] | 907 | 2.97 (2.77 to 3.16) | 913 695 [55.6] | 5051 | 5.53 (5.38 to 5.68) | ||||
| Prior breast procedure | ||||||||||
| No | 449 510 (84.7) | 1269 | 2.82 (2.67 to 2.98) | 1 163 114 (78.4) | 6023 | 5.18 (5.05 to 5.31) | ||||
| Yes | 81 384 (15.3) | 378 | 4.64 (4.18 to 5.11) | 320 980 (21.6) | 2345 | 7.31 (7.01 to 7.60) | ||||
| Unknown | 37 321 [6.6] | 79 | 2.12 (1.65 to 2.58) | 158 730 [9.7] | 932 | 5.87 (5.50 to 6.25) | ||||
| Breast density (BI-RADS) | ||||||||||
| 1. Almost entirely fat | 18 183 (4.3) | 19 | 1.04 (0.58 to 1.51) | 124 477 (10.2) | 306 | 2.46 (2.18 to 2.73) | ||||
| 2. Scattered fibroglandular densities | 146 721 (34.3) | 306 | 2.09 (1.85 to 2.32) | 597 359 (49.0) | 2957 | 4.95 (4.77 to 5.13) | ||||
| 3. Heterogeneously dense | 200 896 (47.0) | 704 | 3.50 (3.25 to 3.76) | 433 058 (35.5) | 2884 | 6.66 (6.42 to 6.90) | ||||
| 4. Extremely dense | 61 413 (14.4) | 251 | 4.09 (3.58 to 4.59) | 65 267 (5.3) | 434 | 6.65 (6.03 to 7.27) | ||||
| Unknown or other system | 141 002 [24.8] | 446 | 3.16 (2.87 to 3.46) | 422 663 [25.7] | 2719 | 6.43 (6.19 to 6.67) | ||||
| Last mammogram | ||||||||||
| Negative | 396 683 (97.6) | 1176 | 2.96 (2.80 to 3.13) | 1 266 143 (98.4) | 6914 | 5.46 (5.33 to 5.59) | ||||
| Positive | 9554 (2.4) | 47 | 4.92 (3.52 to 6.32) | 21 210 (1.6) | 204 | 9.62 (8.30 to 10.93) | ||||
| Unknown | 161 978 [28.5] | 503 | 3.11 (2.83 to 3.38) | 355 471 [21.6] | 2182 | 6.14 (5.88 to 6.40) | ||||
| Current hormone therapy use | ||||||||||
| Not currently on HT | 729 196 (51.6) | 3985 | 5.46 (5.30 to 5.63) | |||||||
| Currently on HT | 683 350 (48.4) | 3950 | 5.78 (5.60 to 5.96) | |||||||
| Unknown | 230 278 [14.0] | 1365 | 5.93 (5.61 to 6.24) | |||||||
| Menopause type | ||||||||||
| Natural | 717 966 (62.7) | 4316 | 6.01 (5.83 to 6.19) | |||||||
| Surgical | 427 332 (37.3) | 2180 | 5.10 (4.89 to 5.32) | |||||||
| Unknown | 497 526 [30.3] | 2804 | 5.64 (5.43 to 5.84) | |||||||
CI = confidence interval; BMI = body mass index; BI-RADS = Breast Imaging Reporting and Data System; HT = hormone therapy.
Percentages in square brackets excluded the unknown category from calculation of 100%.
Rate is presented as number per 1000 screening mammograms.
To better describe the relationship between cancer risk and the joint effects of age and breast density, we computed the observed cancer risk without regard to menopausal status. In this analysis, the observed breast cancer rates (per 1000 screening mammograms) increased with both breast density and age ( Fig. 1 ).
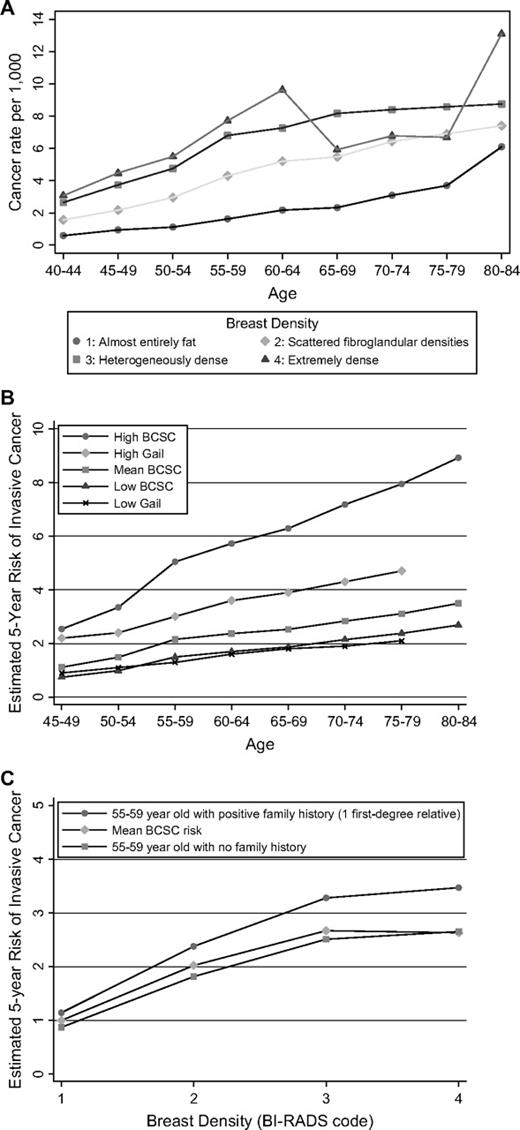
A ) Observed breast cancer rates per 1000 screening mammograms by age and breast density. Density was classified by use of the Breast Imaging Reporting and Data System (BI-RADS) coding system: 1) almost entirely fat ( circles ), 2) scattered fibroglandular densities ( diamonds ), 3) heterogeneously dense ( squares ), and 4) extremely dense ( triangles ). Both invasive cancers and ductal carcinomas in situ are included. B and C ) Breast Cancer Surveillance Consortium (BCSC) estimates are based on a logistic regression model of 7577 invasive breast cancers diagnosed after 1 642 824 screening mammograms in postmenopausal women aged 45–84 years. B ) Estimated 5-year invasive breast cancer risk (percent of women) for high- and low-risk postmenopausal women with the BCSC model and the Gail model by age. The mean risk is the mean of the estimated risk in that age group. The high-risk estimate is based on a non-Hispanic white woman with a prior breast procedure, with a family history of breast cancer (one relative), with a body mass index (BMI) of 30–34 kg/m 2 , with current use of hormone therapy, and who had natural menopause. She had a breast density of 3 on the BI-RADS scale, had her first child before the age of 30 years, and had a negative last mammogram, so that she was not at high risk on all factors. The low-risk woman had a breast density of 2 on the BI-RADS scale, a negative family history, a surgical menopause, and no current use of hormone therapy, but her other characteristics were otherwise identical to the high-risk woman. Ages were varied from 45 to 80 years, and the estimated 5-year risk was plotted. The Gail estimates assume that age at menarche was 12–13 years, that the family history of breast cancer was positive indicating one affected first-degree relative, and that a prior breast procedure was equivalent to a single benign breast biopsy examination. C ) Estimated 5-year invasive breast cancer risk for postmenopausal women from the BCSC model by breast density. The age-specific estimate was based on a non-Hispanic white woman with no prior breast procedure, a BMI of 30–34 kg/m 2 , no current hormone therapy, natural menopause, birth of her first child before age 30 years, and the last mammogram being negative. The risk for that woman is shown if she has none or one first-degree relative with breast cancer. Density ranged over all four BI-RADS categories.
Model for Premenopausal Women
Factors that were not statistically significantly associated with breast cancer risk for premenopausal women when the training data were analyzed included race ( P = .40), Hispanic ethnicity ( P = .41), age at birth of first child ( P = .48), age at menarche ( P = .56), BMI ( P = .89), and education ( P = .13). The P value for the result of the previous mammogram ( P = .0018) did not meet our strict criterion. Four factors—age, breast density, family history of breast cancer, and a prior breast procedure—were all statistically significantly associated with breast cancer risk ( P <.0001). Application of the model to the validation data showed the model was well calibrated, with an observed cancer rate of 3.042 breast cancers per 1000 mammograms compared with an estimated rate of 3.037 breast cancers per 1000 mammograms ( Table 4 ). In addition, the c statistic yielded a value of 0.629 (95% CI = 0.603 to 0.656), and the Hosmer–Lemeshow test showed no lack of fit ( P = .91).
Multivariable model for predicting breast cancer within 1 year in premenopausal women who have undergone previous screening *
| Risk factor | Odds ratio (95% CI) |
|---|---|
| Age, y | |
| 35–39 | 1.00 (referent) |
| 40–44 | 1.23 (0.96 to 1.56) |
| 45–49 | 1.89 (1.49 to 2.41) |
| 50–54 | 2.36 (1.84 to 3.02) |
| Prior breast procedure | |
| No | 1.00 (referent) |
| Yes | 1.47 (1.31 to 1.65) |
| Unknown | 0.87 (0.69 to 1.10) |
| First-degree family history of breast cancer | |
| No | 1.00 (referent) |
| Yes, one relative | 1.54 (1.36 to 1.74) |
| Yes, two or more relatives | 2.11 (1.32 to 3.36) |
| Unknown | 0.89 (0.75 to 1.07) |
| Breast density (BI-RADS) | |
| 1 (almost entirely fat) (referent) | 1.00 (referent) |
| 2 (scattered fibroglandular densities) | 2.00 (1.26 to 3.18) |
| 3 (heterogeneously dense) | 3.34 (2.12 to 5.27) |
| 4 (extremely dense) | 3.93 (2.46 to 6.28) |
| Unknown/different system | 3.31 (2.09 to 5.24) |
CI = confidence interval; BI-RADS = Breast Imaging Reporting and Data System.
Model fit statistics: multivariable model for predicting breast cancer within 1 year in premenopausal women who have undergone previous screening *
| Sample | No. of case patients | No. of control subjects | Observed cancer rate † | Estimated cancer rate † (calibration) | c Statistic (95% CI) | Hosmer–Lemeshow GOF P value |
|---|---|---|---|---|---|---|
| Training | 1294 | 424 930 | 3.036 | 0.631 (0.617 to 0.646) | .32 | |
| Validation | 432 | 141 559 | 3.042 | 3.037 | 0.629 (0.603 to 0.656) | .91 |
| Overall | 1726 | 566 489 | 3.038 | 0.631 (0.618 to 0.644) | .19 |
CI = confidence interval; GOF = goodness-of-fit test.
Rate per 1000 screening mammograms.
The model was then refit to the combined data (training and validation data together) ( Table 3 ). All factors that were statistically significant in the training set remained statistically significantly associated with breast cancer risk (at P <.0001). Risk increased with age (trend test, P <.0001), breast density (trend test, P <.0001), having a positive family history of breast cancer, and having had a prior breast procedure. The fitted model had a c statistic of 0.631 (95% CI = 0.618 to 0.644) ( Table 4 ). If stratified by age group, the c statistic was 0.600 (95% CI = 0.587 to 0.613) for the three remaining risk factors. If breast density was completely excluded from the model, the c statistic decreased to 0.607 (95% CI = 0.592 to 0.621). The predictors age and breast density individually had c statistics of 0.574 (95% CI = 0.562 to 0.585) and 0.565 (95% CI = 0.553 to 0.578), respectively, indicating almost equal ability to predict breast cancer. Finally, prediction of invasive cancer alone by the four risk factors had a c statistic of 0.633 (95% CI = 0.618 to 0.648), and thus, predictive ability differed little from the model for both invasive and ductal carcinoma in situ disease combined.
Model for Postmenopausal Women
Many risk factors jointly predicted the likelihood of a breast cancer diagnosis for postmenopausal women ( Table 5 ). Age at menarche was not associated with breast cancer risk ( P = .24), and the P value for educational level ( P = .0002) did not meet the pre-established statistical significance level. All factors shown in Table 5 were statistically significantly associated with breast cancer risk ( P <.0001). Application to the validation sample showed slight overestimation of the cancer rate, but the c statistic of 0.626 was similar to that in the training data (i.e., c statistic = 0.623), and the lack of fit test was not statistically significant ( P = .23) ( Table 6 ).
Multivariable model for predicting breast cancer within 1 year in postmenopausal women who have undergone previous screening *
| Risk factor | Odds ratio (95% CI) |
|---|---|
| Age, y | |
| 45–49 | 1.00 (referent) |
| 50–54 | 1.33 (1.18 to 1.50) |
| 55–59 | 1.96 (1.75 to 2.20) |
| 60–64 | 2.27 (2.02 to 2.55) |
| 65–69 | 2.47 (2.20 to 2.77) |
| 70–74 | 2.79 (2.48 to 3.14) |
| 75–79 | 3.03 (2.69 to 3.42) |
| 80–84 | 3.33 (2.91 to 3.80) |
| Hispanic | |
| Non-Hispanic | 1.00 (referent) |
| Hispanic | 0.74 (0.66 to 0.81) |
| Unknown | 0.94 (0.87 to 1.01) |
| Race | |
| White | 1.00 (referent) |
| Asian/Pacific Islander | 0.80 (0.71 to 0.90) |
| Black | 1.10 (1.00 to 1.21) |
| Native-American/Alaskan Native | 0.54 (0.42 to 0.70) |
| Other | 0.97 (0.77 to 1.24) |
| Unknown | 1.00 (0.92 to 1.09) |
| Body mass index, kg/m2 | |
| <25 (referent) | 1.00 (referent) |
| 25–29.99 | 1.14 (1.07 to 1.23) |
| 30–34.99 | 1.28 (1.17 to1.40) |
| 35 or greater | 1.47 (1.30 to 1.65) |
| Missing | 1.03 (0.97 to 1.10) |
| Age at birth of first child, y | |
| <30 | 1.00 (referent) |
| ≥30 | 1.21 (1.09 to 1.33) |
| Nulliparous | 1.18 (1.09 to 1.27) |
| Unknown | 1.02 (0.96 to 1.08) |
| Prior breast procedure | |
| No | 1.00 (referent) |
| Yes | 1.30 (1.24 to 1.36) |
| Unknown | 1.06 (0.98 to 1.15) |
| First-degree family history of breast cancer | |
| No | 1.00 (referent) |
| Yes, one relative | 1.31 (1.24 to 1.39) |
| Yes, two or more relatives | 1.66 (1.39 to 1.99) |
| Unknown | 0.95 (0.89 to 1.02) |
| Current hormone therapy use | |
| No | 1.00 (referent) |
| Yes | 1.19 (1.13 to 1.24) |
| Unknown | 1.13 (1.05 to 1.22) |
| Surgical menopause | |
| No | 1.00 (referent) |
| Yes | 0.84 (0.80 to 0.89) |
| Unknown | 0.94 (0.89 to 1.00) |
| Previous mammographic outcome | |
| Negative | 1.00 (referent) |
| Positive | 1.69 (1.47 to 1.94) |
| Unknown | 1.20 (1.14 to 1.26) |
| Breast density (BI-RADS) | |
| 1. Almost entirely fat | 1.00 (referent) |
| 2. Scattered fibroglandular densities | 2.09 (1.86 to 2.35) |
| 3. Heterogeneously dense | 2.95 (2.61 to 3.32) |
| 4. Extremely dense | 3.15 (2.72 to 3.66) |
| Unknown or different system | 2.84 (2.52 to 3.21) |
CI = confidence interval; BI-RADS = Breast Imaging Reporting and Data System.
The model was then refit to the combined data ( Table 5 ), and risk was found to increase with age, BMI, and breast density (trend test P <.0001, for all variables). The risk among Asian/Pacific Islander women and Native-American/Alaskan Native women was lower than that among white women, but the risks among African American women and women of other or mixed race and of unknown race were similar to those among white women. Being of Hispanic ethnicity conferred lower risk compared with being of non-Hispanic ethnicity. Other factors associated with higher risk included later age at birth of first child (≥30 years) or being nulliparous, prior breast surgery, family history of breast cancer, natural menopause, current use of hormone therapy, or a false-positive result on the prior mammogram. The c statistic for the overall model was 0.624 (95% CI = 0.619 to 0.630), indicating moderate prediction ( Table 6 ). If stratified by age group, the c statistic was 0.599 (95% CI = 0.593 to 0.604), indicating that age contributes to the prediction but that the other factors also contribute substantially. When breast density was excluded, the c statistic decreased to 0.605 (95% CI = 0.600 to 0.611). Conversely, the c statistics for age and breast density alone were 0.571 (95% CI = 0.565 to 0.577) and 0.552 (95% CI = 0.547 to 0.558), respectively, so that both were highly predictive. If only invasive cancer was modeled, the same risk factors were identified, and the c statistic of 0.628 (95% CI = 0.622 to 0.634) was similar to that for all breast cancer.
Model fit statistics: multivariable model for predicting breast cancer within 1 year in postmenopausal women who have undergone previous screening *
| Sample | No. of case patients | No. of control subjects | Observed cancer rate † | Estimated cancer rate † (calibration) | c Statistic (95% CI) | Hosmer–Lemeshow GOF P value |
|---|---|---|---|---|---|---|
| Training | 6997 | 1 225 472 | 5.677 | 0.623 (0.617 to 0.629) | .30 | |
| Validation | 2303 | 408 052 | 5.612 | 5.668 | 0.626 (0.615 to 0.637) | .23 |
| Overall | 9300 | 1 633 524 | 5.661 | 0.624 (0.619 to 0.630) | .29 |
CI = confidence interval; GOF = Goodness-of-fit test.
Rate per 1000 screening mammograms.
Inspection of the highest and lowest deciles of risk showed that no risk factor automatically conferred high or low risk. The observed numbers of breast cancer cases for the two extreme deciles were 341 and 1766, which were close to the predicted numbers of 345 and 1787.
Some interaction terms were tested to determine whether there was sufficient improvement to justify more complicated models. Race did not interact with breast density ( P = .50) or BMI ( P = .95). There was a statistically significant interaction between breast density and age ( P <.0001), but this interaction increased the c statistic by only 0.002 at the expense of 28 additional covariates. There was also a strong interaction of BMI and current use of hormone therapy ( P <.0001). BMI was a strong predictor of breast cancer among women not currently taking hormone therapy ( P <.0001) but not among current users of hormone therapy ( P = .067). However, adding this interaction to the model only improved the predictive power (i.e., c statistic) from 0.624 to 0.626. In some additional analyses, combining pre- and postmenopausal data, BMI had a very strong interaction with menopausal status ( P <.0001), showing a possible protective effect of high BMI in premenopausal women and a deleterious effect in postmenopausal women.
To compare our BCSC model with the Gail model, we refit the BCSC model to predict invasive cancer only. We could not directly compare our model with the Gail model because of the difference in the time intervals for cancer ascertainment. However, we obtained crude estimates of a 5-year risk by using the formula Prob(invasive cancer in 5 years) ≈ 1 − [1 − Prob(invasive cancer in 1 year)] 5 (where Prob is probability) and averaged the computed 5-year probability estimates within each age group for all postmenopausal women ( Fig. 2 ). We also computed the risk for a high-risk woman who we defined as a non-Hispanic white woman with a prior breast procedure, one first-degree relative with breast cancer, and BMI of 30–34 kg/m 2 and who is a current user of hormone therapy who had natural menopause. We assumed that this woman had a breast density of 3 on the BI-RADS scale, had her first child before the age of 30 years, and had a negative last mammogram, so that she was not at high risk on all factors. We also computed the risk for a low-risk woman by changing breast density to 2 on the BI-RADS scale, the family history to negative, the menopause type to surgical, and the hormone therapy use to negative. This woman was identical to the high-risk woman on all other characteristics. Age was varied from 45 to 80 years, and the estimated 5-year risk was plotted ( Fig. 1 ). Finally, we computed Gail estimates of the 5-year risk by assuming that age at menarche was 12–13 years and that a prior breast procedure was equivalent to a single benign breast biopsy examination. For the low-risk patient, the Gail model and the BCSC model provided very similar 5-year estimates ( Fig. 2 ). However, for the high-risk patient, the BCSC risk was much higher. This result may be due to risk factors not included in the Gail model, such as use of hormone therapy, BMI, and breast density. For invasive cancer only, inclusion of risk factors not in the Gail model increased the c statistic to 0.628 from 0.598.
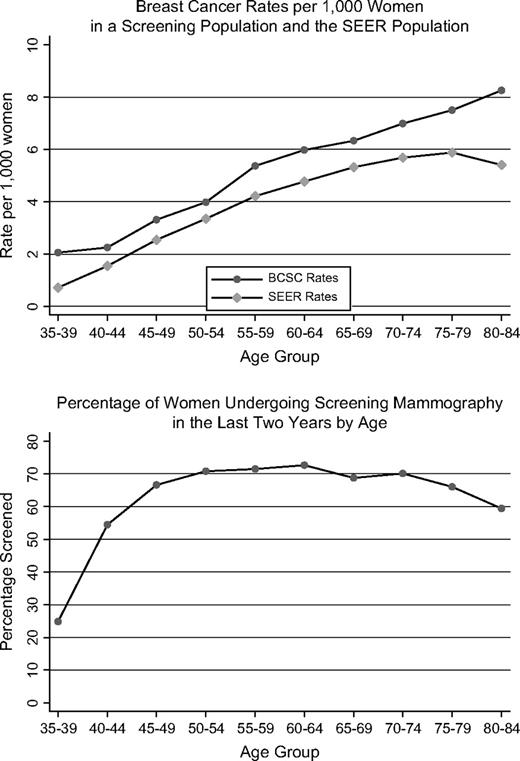
Upper ) Comparison of breast cancer incidence per 1000 women from the Surveillance, Epidemiology, and End Results (SEER) program database with breast cancer rates per 1000 screening examinations by age. Using SEER public-use files, we computed breast cancer (invasive cancer and ductal carcinoma in situ) incidence from January 1, 1996, through December 31, 2002, by age and compared it with the observed incidence in the Breast Cancer Surveillance Consortium (BCSC) cohort of women undergoing mammography screening. For this analysis, we combined premenopausal and postmenopausal women. Lower ) Percentage of women reporting in the National Health Interview Survey that they underwent screening mammography in the last 2 years.
We compared SEER cancer incidence rates, which are based on both screened and unscreened women, with the BCSC rates, which are based on women undergoing screening. Use of SEER data allowed computation of cancer incidence (invasive and ductal carcinoma in situ) by age over the calendar period from January 1, 1996, through December 31, 2002, but did not allow separation by menopausal status. Consequently, we had to compare the BCSC and SEER rates by age without regard to menopausal status ( Fig. 1 ). For women younger than 75 years, the BCSC and SEER rates were roughly parallel, with the BCSC rate indicating that approximately one more breast cancer case per 1000 examinations was identified with BCSC data compared with SEER data. The percentage of breast cancer that was invasive was similar between BCSC and SEER women aged 50 years or older (data not shown). Figure 1 also shows the percentage of women in the National Health Interview Survey reporting a screening mammogram in the last 2 years by age (N. Breen: personal communication).
D ISCUSSION
We used prospectively collected risk-factor information to predict a breast cancer diagnosis after a screening mammogram. The models establish breast density as a highly clinically significant predictor of breast cancer risk that is almost as powerful a risk factor as age. The models also confirm most previously established risk factors as being additional independent predictors of breast cancer, particularly for postmenopausal women. Nonetheless, ability to accurately predict breast cancer at the individual level remains limited.
For premenopausal women, only four risk factors were statistically significantly associated with the risk of breast cancer: age, breast density, number of first-degree relatives with breast cancer, and a prior breast procedure. Having had a prior breast procedure was associated with an approximately 50% increase in risk even without knowledge of the type or result of the prior breast procedure. Breast density was strongly associated with the risk for breast cancer among women with extremely dense breasts, with the risk almost four times greater than that for a woman with breasts that are almost entirely fat, after adjustment for age. Vacek and Geller ( 62 ) found a slightly higher, but similar, risk of 4.6 (95% CI = 1.7 to 12.6). The effect of breast density may be underestimated in general because mammography has poorer sensitivity for dense breasts than for fatty breasts ( 63 ) . Despite the large sample size, many potential risk factors were not associated with a diagnosis of breast cancer in premenopausal women, consistent with other reports ( 64 ) . These risk factors include race, Hispanic ethnicity, education, age at menarche, age at the birth of the first child, and BMI.
Risk in postmenopausal women increased dramatically with age, as expected. Unlike what is observed in SEER program data, we observed no decrease in incidence for the most elderly women. Because screening decreases with older age, our screening cohort may become less representative of the general population as it ages ( 65 , 66 ) . Hispanic ethnicity was associated with a 30% reduction in risk, and being American Native or Pacific Islander was associated with a 44% reduction in risk, although it is always possible that this result can be partially attributed to lower rates of diagnostic follow-up that would result in underdiagnosis subsequent to a positive mammogram. Screened Asian women appeared to have lower incidence of breast cancer compared with white women, even though breast density is greater for Asian women ( 67 ) . Other factors associated with increased risk included higher BMI, late age at the birth of the first child or being nulliparous, prior breast procedure, family history of breast cancer, natural menopause, and use of hormone therapy. Breast density was strongly associated with breast cancer risk, with women with the highest breast density having a risk of 3.16 (95% CI = 2.72 to 3.66) compared with those with the lowest density even after adjustment for several factors including age and BMI. This value is lower than the hazard ratio of 3.9 (95% CI = 2.6 to 5.8) found by Vacek and Geller ( 62 ) . We confirmed that having had a false-positive mammogram at the last mammographic examination was associated with an increased risk for detecting breast cancer within a year of the current index mammogram. McCann et al. ( 35 ) found an odds ratio of 2.15 (95% CI = 1.55 to 2.98) for detecting cancer at the second round of screening in women who had a false-positive result on the first round, compared with women who were negative on the first screening round.
Recent studies show that increased breast cancer risk was associated with estrogen plus progestin hormone therapy but not with estrogen-only therapy ( 68 – 72 ) . We could model only the effect of current hormone therapy because earlier questionnaires did not distinguish among types of hormone therapy. Therefore, the association between estrogen plus progestin and breast cancer risk may have been underestimated in this study, and the association between taking unopposed estrogen therapy and breast cancer risk may be overestimated. We were unable to examine the association between parity and breast cancer risk because information on parity was unavailable ( 73 ) . Age at menopause has previously been demonstrated to be statistically significantly associated with the risk of breast cancer ( 74 – 77 ) , although it was not included in this analysis.
With the exception of age at menarche, the BCSC models support an association between some known factors and the risk for breast cancer and show that breast density is a salient addition to models to predict the risk of breast cancer. As a single predictor, breast density is almost as powerful as age. However, the c statistics show that breast density has only moderate predictive ability when added to other factors ( 6 , 19 ) . Tice et al. ( 31 ) found that the Gail model risk factors had a c statistic of 0.67, which was increased to 0.68 when breast density was added to the model. It is difficult to compare predictive ability across different models and populations. The moderate predictive power also suggests that major determinants of breast cancer risk remain to be discovered.
There are important similarities and differences between the BCSC and Gail populations ( 1 ). The Gail model was developed by use of data from Caucasian women who participated in a demonstration project of annual mammography screening population recruited from January 1, 1973, through December 31, 1975 ( 78 ) . The BCSC used modern screening mammography techniques, and the population was racially and ethnically diverse. Unlike the Gail model, our model used prospectively measured risk factors and internal estimation of the cancer rates, rather than SEER program rates. The BCSC incidence rates are slightly higher than the SEER rates. This fact is not surprising because women undergoing screening mammography are at higher risk for breast cancer ( 79 ) and because the SEER program combines screened and unscreened women. The similarity of the BCSC and SEER rates does provide further validation that the BCSC population is representative of the population of US women.
The high percentage of missing values in this report may be cause for concern. However, in most cases, the missing values are attributable to the question not being asked in the questionnaire or omitted by a particular mammography facility, rather than women choosing not to answer the question. Inclusion of a “Missing” category in analyses has the potential to bias the odds ratios for the observed nonmissing levels of that predictor ( 80 ) . For each risk factor, we eliminated women with missing information for that risk factor only and refit the model. The odds ratios did not change by more than 0.01 for any predictor, except breast density for which the odds ratios increased if women with unknown breast density were excluded. However, the ultimate goal is to predict breast cancer from a collection of risk factors, some of which may be unknown for some women. Therefore, it seems most appropriate to include “Missing” as a legitimate level in a prediction model.
There are some other limitations of the use of BCSC data for assessing risk. Typically, incidence was assessed on a cohort known to be cancer free at the beginning of the study, time t0 , and the incidence rate was estimated on new cases accrued since t0 divided by cumulative person-time. In this study, we used the index mammogram time as t0 , so the outcome was highly associated with the starting point because most cancers are diagnosed within 3 months of the examination. We did include all cancers diagnosed within 1 year, including so-called “interval cancers,” for the following reasons. First, it is likely that the interval cancers were present at the time of the index mammogram but may not have been detectable mammographically. By including all cancers detected within 1 year of a screening mammogram, we avoid consideration of the sensitivity of mammography that is affected by many of the included risk factors. Second, it has been suggested that risk models can probably include cases obtained in the initial screen ( 81 ) . Our model is really a short-term prediction model for diagnosing a recently developed breast cancer within a year of a scheduled screening examination. Despite that, the risk factors are similar to those of the Gail model, which were based on a longer follow-up. As more longitudinal follow-up time accrues in the BCSC trial, direct modeling of the 5-year risk will become possible.
A recent conference sponsored by the NCI called for better risk prediction models that can be validated ( 82 ) . Such models can identify women at high risk who may benefit from more intensive screening with magnetic resonance imaging or with ultrasound or may benefit from prophylactic interventions, such as use of antiestrogen agents. In the absence of strong predictive accuracy, however, some argue that the models may be misleading, frightening, or even unethical ( 83 ) . At the population level, the models may identify some factors that are modifiable, such as BMI, use of hormone therapy, or potentially breast density ( 84 , 85 ) .
Clinically, it might be useful to offer a revised prediction of the likelihood of breast cancer after the result of the mammogram is known. For women with a positive mammogram, the use of covariates would refine assessment of the positive predictive value, the probability of breast cancer given a positive mammogram ( 86 ) . Similarly, women with a negative mammogram may still be at increased risk given certain risk factors. Analysis of positive and negative predictive values is beyond the scope of this article, but the combined use of mammographic findings and risk factor data has the potential to address these clinical questions ( 87 ) .
The risk factors in these models can be collected at the time of mammography screening. Dr. Steven Cummings (personal communication) of the San Francisco Coordinating Center (and California Pacific Medical Center Research Institute) has suggested integrating risk assessment, including breast density, into routine mammography. This step would expand the role of mammography facilities into centers for breast cancer prevention (personal communication). This practice could include evaluation of biomarkers that may aid in a final diagnosis of breast cancer ( 88 , 89 ) . Computation of the risk of breast cancer could assist recruitment to prevention interventions for women estimated to be at high risk. Finally, it would allow the mammography facility to tailor current and future screening to the actual risk of the patient.
This project was supported by funding from the NCI through a BCSC cooperative agreement (U01CA63740, U01CA86076, U01CA86082, U01CA63736, U01CA70013, U01CA69976, U01CA63731, U01CA70040). The authors had sole responsibility for the design of the study, the collection of the data, the analysis and interpretation of the data, the decision to submit the manuscript for publication, and the writing of the manuscript.
References
Gail MH, Brinton LA, Byar DP, Corle DK, Green SB, Schairer C, et al. Projecting individualized probabilities of developing breast cancer for white females who are being examined annually.
Gail MH, Costantino JP. Validating and improving models for projecting the absolute risk of breast cancer.
Gail MH, Benichou J. Validation studies on a model for breast cancer risk.
Spiegelman D, Colditz GA, Hunter D, Hertzmark E. Validation of the Gail et al. model for predicting individual breast cancer risk.
Rockhill B, Spiegelman D, Byrne C, Hunter DJ, Colditz GA. Validation of the Gail et al. model of breast cancer risk prediction and implications for chemoprevention.
Rockhill B, Byrne C, Rosner B, Louie MM, Colditz G. Breast cancer risk prediction with a log-incidence model: evaluation of accuracy.
MacKarem G, Roche CA, Hughes KS. The effectiveness of the Gail model in estimating risk for development of breast cancer in women under 40 years of age.
Amir E, Evans DG, Shenton A, Lalloo F, Moran A, Boggis C, et al. Evaluation of breast cancer risk assessment packages in the family history evaluation and screening programme.
Boyle P, Mezzetti M, La Vecchia C, Franceschi S, Decarli A, Robertson C. Contribution of three components to individual cancer risk predicting breast cancer risk in Italy.
Kaur JS, Roubidoux MA, Sloan J, Novotny P. Can the Gail model be useful in American Indian and Alaska Native populations?
Medina-Franco H, Garza E, Gabilondo B, Gaona-Luviano P. Risk of invasive breast cancer in Mexican population and patterns of screening and prophylaxis.
Pastor Climente IP, Morales Suarez-Varela MM, Llopis Gonzalez A, Magraner Gil JF. Application of the Gail method of calculating risk in the population of Valencia.
Bondy ML, Lustbader ED, Halabi S, Ross E, Vogel VG. Validation of a breast cancer risk assessment model in women with a positive family history.
Brinkmann E, Morrow M. The surgeon's role in breast cancer chemoprevention.
Dunn BK, Ford LG. From adjuvant therapy to breast cancer prevention: BCPT and STAR.
Vogel VG, Costantino JP, Wickerham DL, Cronin WM, Wolmark N. The study of tamoxifen and raloxifene: preliminary enrollment data from a randomized breast cancer risk reduction trial.
Lewis CL, Kinsinger LS, Harris RP, Schwartz RJ. Breast cancer risk in primary care: implications for chemoprevention.
Brown P. Risk assessment: controversies and management of moderate- to high-risk individuals.
Higgins SA, Matloff ET, Rimm DL, Dziura J, Haffty BG, King BL. Patterns of reduced nipple aspirate fluid production and ductal lavage cellularity in women at high risk for breast cancer.
Freedman AN, Graubard BI, Rao SR, McCaskill-Stevens W, Ballard-Barbash R, Gail MH. Estimates of the number of US women who could benefit from tamoxifen for breast cancer chemoprevention.
Bernatsky S, Ramsey-Goldman R, Boivin JF, Joseph L, Moore AD, Rajan R, et al. Do traditional Gail model risk factors account for increased breast cancer in women with lupus?
Bernatsky S, Clarke A, Ramsey-Goldman R, Joseph L, Boivin JF, Rajan R, et al. Hormonal exposures and breast cancer in a sample of women with systemic lupus erythematosus.
Olson JE, Sellers TA, Iturria SJ, Hartmann LC. Bilateral oophorectomy and breast cancer risk reduction among women with a family history.
Boyd NF, Byng JW, Jong RA, Fishell EK, Little LE, Miller AB, et al. Quantitative classification of mammographic densities and breast cancer risk: results from the Canadian National Breast Screening Study.
Byrne C, Schairer C, Wolfe J, Parekh N, Salane M, Brinton LA, et al. Mammographic features and breast cancer risk: effects with time, age, and menopause status.
Vacek PM, Geller BM. A prospective study of breast cancer risk using routine mammographic breast density measurements.
Ziv E, Tice J, Smith-Bindman R, Shepherd J, Cummings S, Kerlikowske K. Mammographic density and estrogen receptor status of breast cancer.
Boyd NF, Rommens JM, Vogt K, Lee V, Hopper JL, Yaffe MJ, et al. Mammographic breast density as an intermediate phenotype for breast cancer.
Kerlikowske K, Shepherd J, Creasman J, Tice JA, Ziv E, Cummings SR. Are breast density and bone mineral density independent risk factors for breast cancer?
Maskarinec G, Pagano I, Lurie G, Wilkens LR, Kolonel LN. Mammographic density and breast cancer risk: the multiethnic cohort study.
Tice JA, Cummings SR, Ziv E, Kerlikowske K. Mammographic breast density and the Gail model for breast cancer risk prediction in a screening population.
Cleary MP, Maihle NJ. The role of body mass index in the relative risk of developing premenopausal versus postmenopausal breast cancer.
La Vecchia C, Negri E, Franceschi S, Talamini R, Bruzzi P, Palli D, et al. Body mass index and post-menopausal breast cancer: an age-specific analysis.
Chen CL, Weiss NS, Newcomb P, Barlow W, White E. Hormone therapy in relation to breast cancer.
McCann J, Stockton D, Godward S. Impact of false-positive mammography on subsequent screening attendance and risk of cancer.
Beral V for the Million Women Study Collaborators. Breast cancer and hormone-replacement therapy in the Million Women Study.
Chlebowski RT, Hendrix SL, Langer RD, Stefanick ML, Gass M, Lane D, et al. Influence of estrogen plus progestin on breast cancer and mammography in healthy postmenopausal women: the women's health initiative randomized trial.
Kerlikowske K, Miglioretti DL, Ballard-Barbash R, Weaver DL, Buist DS, Barlow WE, et al. Prognostic characteristics of breast cancer among postmenopausal hormone users in a screened population.
Feigelson HS, Jonas CR, Teras LR, Thun MJ, Calle EE. Weight gain, body mass index, hormone therapy, and postmenopausal breast cancer in a large prospective study.
Stahlberg C, Pedersen AT, Lynge E, Andersen ZJ, Keiding N, Hundrup YA, et al. Increased risk of breast cancer following different regimens of hormone therapy frequently used in Europe.
McTiernan A, Martin CF, Peck JD, Aragaki AK, Chlebowski RT, Pisano ED, et al. Estrogen-plus-progestin use and mammographic density in postmenopausal women: women's health initiative randomized trial.
Zhu K, Caulfield J, Hunter S, Roland CL, Payne-Wilks K, Texter L. Body mass index and breast cancer risk in African American women.
Bondy ML, Newman LA. Breast cancer risk assessment models: applicability to African-American women.
Edwards BK, Brown ML, Wingo PA, Howe HL, Ward E, Ries LA, et al. Annual report to the nation on the status of cancer, 1975–2002, featuring population-based trends in cancer treatment.
Ballard-Barbash R, Taplin SH, Yankaskas BC, Ernster VL, Rosenberg RD, Carney PA, et al. Breast Cancer Surveillance Consortium: a national mammography screening and outcomes database.
Smith RA, Saslow D, Sawyer KA, Burke W, Costanza ME, Evans WP 3rd, et al. American Cancer Society guidelines for breast cancer screening: update 2003.
Sickles EA, Miglioretti DL, Ballard-Barbash R, Geller BM, Leung JW, Rosenberg RD, et al. Performance benchmarks for diagnostic mammography.
Miglioretti DL, Rutter CM, Geller BM, Cutter G, Barlow WE, Rosenberg R, et al. Effect of breast augmentation on the accuracy of mammography and cancer characteristics.
Carney PA, Geller BM, Moffett H, Ganger M, Sewell M, Barlow WE, et al. Current medicolegal and confidentiality issues in large, multicenter research programs.
American College of Radiology. Illustrated Breast Imaging Reporting and Data System (BI-RADS™), 4th ed. Reston (VA): American College of Radiology;
Berg WA, Campassi C, Langenberg P, Sexton MJ. Breast Imaging Reporting and Data System: inter- and intraobserver variability in feature analysis and final assessment.
Lee-Han H, Cooke G, Boyd NF. Quantitative evaluation of mammographic densities: a comparison of methods of assessment.
Stata Corp. Stata statistical software: release 8.0. College Station (TX): Stata Corporation;
Colditz G, Rosner B, Chen WY, Holmes M, Hankinson SE. Risk factors for breast cancer according to estrogen and progesterone receptor status.
Zeger SL, Liang KY. Longitudinal data analysis for discrete and continuous outcomes.
Miglioretti DL, Heagerty PJ. Marginal modeling of multilevel binary data with time-varying covariates.
Kelsey JL, Thompson WD, Evans AS. Methods in observational epidemiology. New York (NY): Oxford University Press;
Surveillance, Epidemiology, and End Results (SEER) Program. SEER*Stat Database: Incidence–SEER 9 Regs Public-Use, Nov 24 Sub (1973–2002). National Cancer Institute, DCCPS, Surveillance Research Program, Cancer Statistics Branch. Released April 2005, based on the November 2004 submission. Available at: http://www.seer.cancer.gov .
Surveillance Research Program. National Cancer Institute SEER*Stat software, version 6.1.4. Available at: http://www.seer.cancer.gov/seerstat .
Vacek PM, Geller BM. A prospective study of breast cancer risk using routine mammographic breast density measurements.
Buist DS, Porter PL, Lehman C, Taplin SH, White E. Factors contributing to mammography failure in women aged 40–49 years.
Kerlikowske K, Barclay J, Grady D, Sickles EA, Ernster V. Comparison of risk factors for ductal carcinoma in situ and invasive breast cancer.
Burack RC, George J, Gurney JG. Mammography use among women as a function of age and patient involvement in decision-making.
Swan J, Breen N, Coates RJ, Rimer BK, Lee NC. Progress in cancer screening practices in the United States: results from the 2000 National Health Interview Survey.
Maskarinec G, Pagano I, Lurie G, Wilkens LR, Kolonel LN. Mammographic density and breast cancer risk: the multiethnic cohort study.
Colditz G, Rosner B. Cumulative risk of breast cancer to age 70 years according to risk factor status: data from the Nurses' Health Study.
Ross RK, Paganini-Hill A, Wan P, Pike M. Effect of hormone replacement therapy on breast cancer: estrogen versus estrogen plus progestin.
Schairer C, Lubin J, Troisi R, Sturgeon S, Brinton LA, Hoover R. Menopausal estrogen and estrogen-progestin replacement therapy and breast cancer risk.
Newcomb PA, Titus-Ernstoff L, Egan K, Trentham-Dietz A, Baron J, Storer B, et al. Postmenopausal estrogen and progestin use in relation to breast cancer risk.
Rossouw JE, Anderson GL, Prentice RL, LaCroix AZ, Kooperberg C, Stefanick ML, et al. Risks and benefits of estrogen plus progestin in healthy postmenopausal women: principal results from the Women's Health Initiative randomized controlled trial.
Lambe M, Hsieh C-C, Trichopoulos D, Ekbom A, Pavia A, Adami H-O. Transient increase in risk of breast cancer after giving birth.
Trichopoulos D, MacMahon B, Cole P. Menopause and breast cancer risk.
Lilienfeld AM. The relationship of cancer of the female breast to artificial menopause and marital status.
Pike M, Ross R, Spicer D. Problems involved in including women with simple hysterectomy in epidemiologic studies measuring the effects of hormone replacement therapy on breast cancer risk.
Rockhill B, Colditz G, Rosner B. Bias in breast cancer analyses due to error in age at menopause.
Swanson CA, Brinton LA, Taylor PR, Licitra LM, Ziegler RG, Schairer C. Body size and breast cancer risk assessed in women participating in the Breast Cancer Detection Demonstration Project.
Sabatino SA, Burns RB, Davis RB, Phillips RS, Chen YH, McCarthy EP. Breast carcinoma screening and risk perception among women at increased risk for breast carcinoma: results from a national survey.
Vach W, Blettner M. Logistic regression with incompletely observed categorical covariates—investigating the sensitivity against violation of the missing at random assumption.
Benichou J, Byrne C, Capece LA, Carroll LE, Hurt-Mullen K, Pee DY, et al. Secular stability and reliability of measurements of the percentage of dense tissue on mammograms.
Freedman AN, Seminara D, Gail MH, Hartge P, Colditz GA, Ballard-Barbash R, et al. Cancer risk prediction models: a workshop on development, evaluation, and application.
Harvey JA, Bovbjerg VE. Quantitative assessment of mammographic breast density: relationship with breast cancer risk.
Weik JL, Lum SS, Esquivel PA, Tully RJ, Bae WC, Petersen FF, et al. The Gail model predicts breast cancer in women with suspicious radiographic lesions.
Weaver DL, Vacek PM, Skelly JM, Geller BM. Predicting biopsy outcome after mammography: what is the likelihood the patient has invasive or in situ breast cancer?
Lewis CM, Cler LR, Bu DW, Zochbauer-Muller S, Milchgrub S, Naftalis EZ, et al. Promoter hypermethylation in benign breast epithelium in relation to predicted breast cancer risk.

