


Abstract
Background: Although several studies have established a link between obesity and colon cancer risk, little is known about the effect of obesity on outcomes after diagnosis. We investigated the association of body mass index (BMI) with outcomes after colon cancer in patients from cooperative group clinical trials. Methods: The study cohort consisted of 4288 patients with Dukes B and C colon cancer who were accrued from July 1989 to February 1994 to National Surgical Adjuvant Breast and Bowel Project randomized trials. Risk of recurrence, second primary cancer, and mortality (overall and by likely cause) were evaluated in relation to BMI at diagnosis using statistical modeling. Median follow-up time was 11.2 years. All statistical tests were two-sided. Results: Very obese patients (BMI ≥ 35 kg/m 2 ) had greater risk of a colon cancer event (recurrence or secondary primary tumor; hazard ratio [HR] = 1.38, 95% confidence interval [CI] = 1.10 to 1.73) than normal weight patients (BMI = 18.5–24.9 kg/m 2 ). Mortality was greater for very obese (HR = 1.28, 95% CI = 1.04 to 1.57) and underweight (BMI < 18.5 kg/m 2 ) (HR = 1.49, 95% CI = 1.17 to 1.91) than for normal weight patients. The increased risk of mortality for underweight patients was dominated by non–colon cancer deaths (HR of such deaths compared with normal weight patients = 2.23, 95% CI = 1.50 to 3.31), whereas for the very obese, deaths likely due to colon cancer were increased (HR = 1.36, 95% CI = 1.06 to 1.73). Conclusions: Among colon cancer patients, a BMI greater than 35.0 kg/m 2 at diagnosis was associated with an increased risk for recurrence of and death from colon cancer. Further studies are needed to determine pathways between obesity and recurrence risk and whether weight reduction or related interventions would improve prognosis.
The prevalence of obesity (as determined by body mass index [BMI] ≥ 30 kg/m 2 ) and extreme obesity (BMI > 40 kg/m 2 ) continue to increase in the United States ( 1 ) . In recent years, obesity has come to be recognized as an important contributor to cancer risk. Two large prospective cohort studies have demonstrated that being obese confers an approximate 1.5-fold increased risk of developing colon cancer relative to being of normal weight (BMI = 18.5–24.9 kg/m 2 ) ( 2 , 3 ) . With respect to colon cancer mortality, the Cancer Prevention Study II, which prospectively followed more than 900 000 US adults, similarly found a 1.5- to 1.8-fold increased risk of dying from colon cancer for obese individuals, reflecting the increased incidence of colon cancer and perhaps the increased mortality from the disease once diagnosed ( 4 ) .
The influence of obesity on recurrence and survival after colon cancer diagnosis and treatment is less clear, with the few studies that have addressed this question showing somewhat disparate findings. In a small single-institution study, Tartter et al. ( 5 ) found that body weight was an important prognostic factor in patients with colon cancer; however, BMI appeared more strongly prognostic among women than men. In a much larger retrospective analysis of participants from a multicenter clinical trial for stage II and III colon cancer, Meyerhardt et al. ( 6 ) found a non–statistically significant 11% excess risk for both cancer recurrence and overall mortality among obese (BMI ≥ 30 kg/m 2 ) patients relative to a referent group with a BMI of 21.1–24.9 kg/m 2 . However, among women specifically, the association between obesity and mortality (34% relative excess) was stronger. A recent prospective cohort study among more than 40 000 Australians found that increased waist circumference, higher weight, and greater percent body fat were associated with increased mortality after a colon cancer diagnosis ( 7 ) . However, the authors of that study did not report a differential effect of these factors on outcomes between men and women.
In this study, we examined BMI in relation to outcomes among individuals who participated in multicenter randomized clinical trials of adjuvant chemotherapy for surgically resected colon cancer. We evaluated the association between BMI and colon cancer recurrence, second primary cancers, and mortality by likely cause and also explored whether BMI influenced adverse events and other aspects of chemotherapy treatment.
P ATIENTS AND M ETHODS
Study Population and Follow-up
The National Surgical Adjuvant Breast and Bowel Project (NSABP) is a National Cancer Institute–sponsored Cancer Cooperative Group with participating patient enrollment sites throughout North America. The study cohort consisted of participants in either of two NSABP randomized clinical trials that enrolled patients from July 1989 to February 1994. Details of the trial designs and primary findings have been published previously ( 8 , 9 ) . In brief, both trials enrolled patients with resected Dukes B (tumor–node–metastasis classification system T3/4N 0 M 0 ) or Dukes C (T1-4N1-3M 0 ) carcinoma of the colon. In the first trial (NSABP C-04), 2151 patients were randomly assigned between July 5, 1989, and December 31, 1990, to receive either 1) leucovorin-modulated 5-fluorouracil (5FU + LV), 2) 5-fluorouracil and levamisole (5FU + LEV), or 3) the combination of these (5FU + LV + LEV). Results showed a disease-free survival advantage for 5FU + LV over 5FU + LEV and no advantage for adding LEV to 5FU + LV ( 8 ) . In the second trial (NSABP C-05), 2176 patients were randomly assigned between October 1, 1991, and February 28, 1994, to receive 5FU + LV either with or without interferon alfa (IFN-α)2a. Primary findings indicated no disease-free survival or survival improvement with the addition of interferon treatment ( 9 ) . In both trials, computed body surface area (BSA) was “capped” at 2.0 m 2 for the purposes of determining chemotherapy doses. After completing the assigned chemotherapy, patients underwent routine history, physical, and laboratory analysis every 3 months, with carcinoembryonic antigen determinations every 6 months and a chest radiograph and barium enema or colonoscopy annually through the first 2 years. During follow-up years 3–5, physical examination and blood and serum assays were required every 6 months and chest radiograph and barium enema or colonoscopy were required yearly. After year 5, the status of disease was reported on a yearly basis. Institutional Review Boards at the study sites approved these trials, and the participants provided written informed consent before random assignment.
For the current analysis, we selected patients who were confirmed to have Dukes B or C cancer and who had follow-up information after randomization (98.5% of those enrolled), resulting in a cohort of 4288 patients. Findings in this analysis reflect information reported to the NSABP Biostatistical Center as of December 31, 2004. Median follow-up from surgery to last contact for patients still alive is 11.2 years.
Body Mass Index
BMI was calculated as weight in kilograms divided by the square of the height in meters (kg/m 2 ) on day 1 of chemotherapy. For this analysis, BMI was categorized as follows: less than 18.5 (underweight), 18.5–24.9 (normal weight), 25.0–29.9 (overweight), 30.0–34.9 (obese), and 35.0 or more (very obese), corresponding to the classification proposed by the World Health Organization ( 10 ) and used in the Cancer Prevention Study II ( 4 ) (these reports additionally partition those with a BMI ≥ 40). In statistical modeling, we also investigated BMI on a continuous scale as described below.
Study Endpoints
For NSABP clinical trials C-04 and C-05, primary endpoints were 1) disease-free survival, defined as time from surgery to either colon cancer recurrence, occurrence of second primary colon cancer, occurrence of other second primary cancer, or death before these events and 2) overall survival, defined as time from surgery to death from any cause. In this study, we analyzed several distinct disease-free survival endpoints: colon cancer failures, defined as either recurrence or occurrence of second primary cancer of the colon [this definition is consistent with that used in the previous study by Meyerhardt et al. ( 6 ) ]; other second primary cancers; or deaths occurring before colon cancer events or second primary cancers. For mortality, we divided all deaths into two groups: 1) colon cancer deaths, i.e., those that were preceded by either colon cancer recurrence or second primary colon cancer, and 2) other, non–colon cancer deaths (the remainder). Although assigning cause of death this way will result in some misclassification, using death certificate and patient chart information can be equally problematic, given the difficulties associated with ascertainment of cause of death in multicenter clinical trials.
Treatment-related toxicities were also examined. These were recorded and classified as part of the original follow-up using the National Cancer Institutes' Common Toxicity Criteria ( 11 ) .
Statistical Methods
Patient and disease characteristics were examined by BMI category and compared using chi-square or Fisher's exact tests, as appropriate. Similarly, frequencies by highest grade reached for each toxicity type were tabulated and compared among BMI categories.
Associations between BMI and event hazards were assessed using the Cox proportional hazards model to account for potential confounding by factors associated with both BMI and outcomes ( 12 ) . Initial models included the chemotherapy treatment arm only and were then expanded to include additional prognostic covariates. From the models, we obtained event hazard ratios (HRs) with 95% confidence intervals (CIs) for underweight, overweight, and obese groups relative to the normal weight group. Graphical checks and tests based on scaled Schoenfeld residuals ( 13 ) confirmed that the proportional hazards assumption was satisfied. We also examined the prognostic influence of BMI on a continuous scale, using the method of Grambsch et al. ( 14 ) to select the appropriate functional form for representing BMI in the models. Specifically, because it has been observed previously ( 6 ) and was anticipated in this analysis that the hazard over the range of BMI values might exhibit a quadratic shape (i.e., with both low and high values associated with greater hazard of failure), diagnostics were examined for models with a single term for BMI and then for a model in which BMI and its square (BMI 2 ) were included, and the parameterization with the superior fit was then selected. Models adjusting for other covariates included statistically significant predictors from among age at diagnosis, sex, race (white, black, or other/unknown), number of positive lymph nodes (negative, 1–4, or ≥5), performance status (0, 1, or 2), and presence of bowel obstruction (yes or no).
For events including disease-free survival and for cause-specific mortality, cumulative event probabilities over time were estimated using cumulative incidence estimators to correctly account for competing risks ( 15 ) . All reported P values are two-sided; P values less than .05 were considered statistically significant.
R ESULTS
BMI in Relation to Patient and Disease Characteristics
The BMI distribution in the study group was largely commensurate with the frequencies of overweight and obesity observed in the National Health and Nutrition Interview Survey III study ( 1 ) . BMI ranged from 14.4 to 51.9 kg/m 2 , with a mean of 26.1 kg/m 2 and a median of 25.5 kg/m 2 . Approximately 54% of patients had a BMI that classified them as overweight (BMI ≥ 25 kg/m 2 , according to the World Health Organization definition); 19.0% were obese (BMI ≥ 30 kg/m 2 ) and 5.5% had a BMI of 35 kg/m 2 or more.
We first cross-classified patient and disease characteristics by BMI category ( Table 1 ). Very obese patients were more likely than normal weight patients to be female and to have a poor performance status but were less likely to present with a bowel obstruction. Underweight patients were more likely than normal weight patients to be young and female and more like to have poor performance status and presence of bowel obstruction. Overall and among men specifically, blacks and whites did not differ with respect to distribution of BMI. However, black women had greater BMI than white women, with 62.2% of black women and 47.3% of white women being classified as overweight or obese. Neither lymph node status (negative or positive) nor the number of positive lymph nodes was associated with BMI.
Patient and disease characteristics by body mass index (BMI) among 4288 participants in randomized clinical trials for stage B and C colon cancer *
| % patients within each BMI category | ||||||||||||
|---|---|---|---|---|---|---|---|---|---|---|---|---|
| Characteristic | <18.5 kg/m 2 (n = 141) | 18.5–24.9 kg/m 2 (n = 1801) | 25.0–29.9 kg/m 2 (n = 1534) | 30.0–34.9 kg/m 2 (n = 575) | ≥35.0 kg/m 2 (n = 237) | All patients (n = 4288) | P* | |||||
| Age at diagnosis, y | <.001 | |||||||||||
| <40 | 15.3 | 8.5 | 5.0 | 4.8 | 5.4 | 6.8 | ||||||
| 40–49 | 13.9 | 15.8 | 12.2 | 14.3 | 19.7 | 14.5 | ||||||
| 50–59 | 23.6 | 26.5 | 28.7 | 32.1 | 34.3 | 28.4 | ||||||
| ≥60 | 47.2 | 49.2 | 54.2 | 48.7 | 40.6 | 50.3 | ||||||
| Female | 72.3 | 50.6 | 34.7 | 44.9 | 58.2 | 45.3 | <.001 | |||||
| Race | .47 | |||||||||||
| White | 81.6 | 85.8 | 87.4 | 87.9 | 88.2 | 86.7 | ||||||
| Black | 6.4 | 7.3 | 8.3 | 9.3 | 8.9 | 8.0 | ||||||
| Other/unknown | 12.1 | 6.9 | 4.2 | 2.8 | 3.0 | 5.3 | ||||||
| Lymph node status | .27 | |||||||||||
| Negative (Dukes B) | 45.4 | 43.6 | 41.7 | 41.6 | 40.1 | 42.5 | ||||||
| 1–4 positive | 40.4 | 43.4 | 44.0 | 41.7 | 41.4 | 43.2 | ||||||
| ≥5 positive | 14.2 | 13.0 | 14.3 | 16.7 | 18.6 | 14.3 | ||||||
| Performance status | <.001 | |||||||||||
| 0 | 76.6 | 87.8 | 87.7 | 85.4 | 83.1 | 86.8 | ||||||
| 1 | 21.3 | 11.8 | 12.1 | 13.9 | 16.9 | 12.8 | ||||||
| 2 | 2.1 | 0.3 | 0.3 | 0.7 | 0.0 | 0.4 | ||||||
| Presence of bowel obstruction | 17.7 | 14.8 | 11.0 | 9.9 | 8.0 | 12.5 | <.001 | |||||
| Presence of bowel perforation | 2.1 | 2.2 | 1.4 | 1.0 | 3.0 | 1.8 | .13 | |||||
| Location of tumor | .30 | |||||||||||
| Left colon | 19.9 | 20.2 | 18.7 | 19.0 | 20.1 | 19.5 | ||||||
| Right colon | 46.1 | 41.9 | 40.6 | 40.1 | 42.7 | 41.4 | ||||||
| Rectosigmoid | 30.5 | 34.7 | 37.6 | 37.1 | 33.1 | 35.8 | ||||||
| Multiple sites | 3.5 | 2.7 | 2.5 | 2.8 | 2.1 | 2.6 | ||||||
| Rectum/unknown | 0.0 | 0.5 | 0.6 | 1.0 | 2.1 | 0.7 | ||||||
Chi-square test (two-sided) of association between BMI and the characteristic.
Association of BMI With Outcomes
Events included in disease-free survival.
Disease-free survival differed among BMI categories, with very obese and underweight patients having the worst outcomes ( Fig. 1, A ). Very obese patients had 27% greater risk of a disease-free survival event than normal weight patients (HR = 1.27, 95% CI = 1.05 to 1.53; P <.001) ( Table 2 ). In analyses partitioned by event type, the cumulative incidence of both colon cancer events ( Fig. 2, A ) and other events ( Fig. 2, B ) differed across BMI categories. The excess risk of disease-free survival event failure was attributable to increased risks for both colon cancer events (HR = 1.38, 95% CI = 1.10 to 1.73) and deaths before colon cancer events or second primary cancers (HR = 1.51, 95% CI = 0.93 to 2.45) ( Table 2 ).
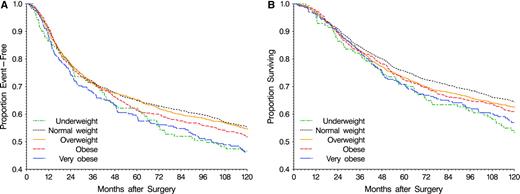
Disease-free and overall survival by body mass index (BMI) category in 4288 patients from National Surgical Adjuvant Breast and Bowel Project randomized clinical trials for Dukes B and C colon cancer. BMI classification corresponds to that proposed by the World Health Organization ( 10 ) . A ) Disease-free survival. At 10 years, the number of patients at risk and 95% confidence intervals on estimates are as follows: underweight (<18.5 kg/m 2 , green ), 52 patients, 0.382 to 0.549; normal weight (18.5–24.9 kg/m 2 , black ), 760 patients, 0.531 to 0.577; overweight (25.0–29.9 kg/m 2 , orange ), 623 patients, 0.521 to 0.572; obese (30.0–34.9 kg/m 2 , red ), 208 patients, 0.474 to 0.558; very obese (≥35.0 kg/m 2 , blue ), 81 patients, 0.399 to 0.528. B) Overall survival. At 10 years, the number of patients at risk and 95% confidence intervals on survival estimates are as follows: underweight, 62 patients, 0.457 to 0.625; normal weight, 891 patients, 0.623 to 0.668; overweight, 712 patients, 0.601 to 0.650; obese, 254 patients, 0.570 to 0.651; very obese, 98 patients, 0.504 to 0.633.
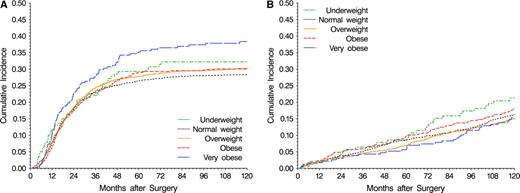
Cumulative incidence by body mass index category. A ) Colon cancer events (recurrence or second primary tumors). B ) other events (deaths before colon cancer events or other second primary cancers). At 10 years, 95% confidence intervals on cumulative incidence of colon cancer events and other events are as follows (numbers at risk are as given in Fig. 1 ): underweight, colon cancer 0.244 to 0.399, other 0.144 to 0.282; normal weight, colon cancer 0.262 to 0.304, other 0.146 to 0.181; overweight, colon cancer 0.280 to 0.326, other 0.132 to 0.169; obese, colon cancer 0.265 to 0.341, other 0.149 to 0.213; very obese, colon cancer 0.320 to 0.446, other 0.106 to 0.201.
Relative hazards for events comprising disease-free survival by body mass index (BMI) *
| Category | Disease-free survival (2074 events) | Colon cancer events (1286 events) | Second primary cancer (453 events) | Prior deaths † (335 events) |
|---|---|---|---|---|
| BMI ‡ | ||||
| Underweight | 1.42 (1.14 to 1.78) | 1.14 (0.84 to 1.55) | 1.96 (1.27 to 3.04) | 2.11 (1.26 to 3.52) |
| Normal weight | 1.00 (referent) | 1.00 (referent) | 1.00 (referent) | 1.00 (referent) |
| Overweight | 0.96 (0.87 to 1.06) | 1.08 (0.95 to 1.23) | 0.80 (0.64 to 0.99) | 0.81 (0.63 to 1.04) |
| Obese | 1.06 (0.93 to 1.21) | 1.04 (0.88 to 1.24) | 1.05 (0.79 to 1.40) | 1.29 (0.93 to 1.77) |
| Very obese | 1.27 (1.05 to 1.53) | 1.38 (1.10 to 1.73) | 0.97 (0.61 to 1.53) | 1.51 (0.93 to 2.45) |
| P : BMI § | <.001 | .004 | .11 | .018 |
Hazard ratios (with 95% confidence intervals) are from the Cox model, adjusted for treatment (leucovorin-modulated 5-fluorouracil [5FU + LV], 5-fluorouracil and levamisole [5FU + LEV], 5FU + LV + LEV, 5FU + LV and interferon α2a), age (continuous), sex, race (white, black, or other/unknown), performance status (0, 1, or 2), number of positive lymph nodes (0, 1–4, or ≥ 5), and presence of bowel obstruction (yes or no).
Deaths before colon cancer recurrence or occurrence of second primary cancer.
BMI categories: underweight, BMI less than 18.5 kg/m 2 ; normal weight, BMI = 18.5–24.9 kg/m 2 ; overweight, BMI = 25.0–29.9 kg/m 2 ; obese, BMI = 30.0–34.9 kg/m 2 ; very obese, BMI of 35.0 kg/m 2 or more; based on World Health Organization criteria ( 10 ).
Likelihood-ratio test (two-sided) for BMI term(s) for continuous functional form: BMI + BMI 2 for endpoints except second primary cancers, among which the linear term was sufficient.
Underweight patients had a 42% greater risk of a disease-free survival event than normal weight patients, due to greater risks of second primary cancers (HR = 1.96, 95% CI = 1.27 to 3.04) and of death before colon cancer failure or second primary cancer (HR = 2.11, 95% CI = 1.26 to 3.52) ( Table 2 ). Among underweight patients, second primary cancer sites were seen at many different sites, but they were most frequent in the respiratory system (39% of second primary cancers) (data not shown).
Overall and cause-specific survival.
Overall (all-cause) mortality also differed among BMI categories ( Fig. 1, B ). Compared with normal weight patients, both very obese patients (HR = 1.28, 95% CI = 1.04 to 1.57) and underweight patients (HR = 1.49, 95% CI = 1.17 to 1.91) had greater overall mortality hazards ( Table 3 ). Mortality was then examined by likely cause ( Table 3 , Fig. 3 ). Of 1697 deaths observed, 1159 (68%) were subsequent to colon cancer recurrence or second primary colon cancer. Among very obese patients, the poorer overall survival was reflected by an excess in the risk of death following colon cancer events (HR = 1.36, 95% CI = 1.06 to 1.73). Conversely, underweight patients had more than a twofold greater risk of non–colon cancer deaths (HR = 2.23, 95% CI = 1.50 to 3.31).
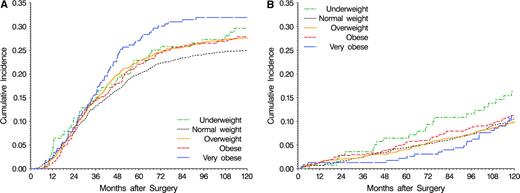
Cumulative incidence of mortality by body mass index category. A ) Deaths following colon cancer events. B ) other deaths. At 10 years, 95% confidence intervals on cumulative incidence of colon cancer deaths and other deaths are as follows (numbers at risk are as given in Fig. 1 ): underweight, colon cancer 0.220 to 0.373, other 0.099 to 0.227; normal weight, colon cancer 0.229 to 0.269, other 0.091 to 0.120; overweight, colon cancer 0.253 to 0.298, other 0.083 to 0.114; obese, colon cancer 0.241 to 0.316, other 0.086 to 0.139; very obese, colon cancer 0.258 to 0.380, other 0.069 to 0.154.
Relative hazards for mortality by body mass index (BMI) *
| Total mortality (1697 events) | Colon cancer deaths (1159 events) | Non–colon cancer deaths (538 events) | |
|---|---|---|---|
| BMI † | |||
| Underweight | 1.49 (1.17 to 1.91) | 1.22 (0.89 to 1.67) | 2.23 (1.50 to 3.31) |
| Normal weight | 1.00 (referent) | 1.00 (referent) | 1.00 (referent) |
| Overweight | 1.02 (0.91 to 1.14) | 1.12 (0.98 to 1.28) | 0.84 (0.68 to 1.02) |
| Obese | 1.11 (0.96 to 1.28) | 1.08 (0.90 to 1.30) | 1.23 (0.95 to 1.58) |
| Very obese | 1.28 (1.04 to 1.57) | 1.36 (1.06 to 1.73) | 1.25 (0.84 to 1.87) |
| P : BMI ‡ | .003 | .02 | .03 |
Hazard ratios (with 95% confidence intervals) are from the Cox model, adjusted for treatment (leucovorin-modulated 5-fluorouracil [5FU + LV], 5-fluorouracil and levamisole [5FU + LEV], 5FU + LV + LEV, 5FU + LV and interferon α2a), age (continuous), sex, race (white, black, or other/unknown), performance status (0, 1, or 2), number of positive lymph nodes (0, 1–4, ≥5), and presence of bowel obstruction (yes or no).
BMI categories: underweight, BMI less than 18.5 kg/m 2 ; normal weight, BMI = 18.5–24.9 kg/m 2 ; overweight, BMI = 25.0–29.9 kg/m 2 ; obese, BMI = 30.0–34.9 kg/m 2 ; very obese, BMI of 35.0 kg/m 2 or more; based on World Health Organization criteria ( 10 ).
Likelihood-ratio test (two-sided) for BMI term(s) for continuous functional form: BMI + BMI 2 .
Outcomes by sex.
Because a previous study found a statistically significant association between BMI and colon cancer outcome in females but not in males ( 6 ) , we investigated whether BMI was associated with outcome differently in men compared with women. Statistical tests evaluating a sex × BMI interaction in relation to hazard of recurrence, overall mortality, and colon cancer mortality did not provide evidence of a differential association of BMI and outcome between men and women. Furthermore, hazard ratios that were separately estimated by sex were similar for these endpoints, with very obese men as well as women being at increased risk of recurrence and death (data not shown). Finally, when we analyzed the NSABP data using BMI categories as defined in the study by Meyerhardt et al. ( 6 ) , (<21, 21–24.9 (normal weight), 25–27.49, 27.5–29.9, and ≥30 kg/m 2 ), we did not find a statistically significant difference in hazard ratios (obese versus normal weight individuals) between men and women ( Fig. 4 ).
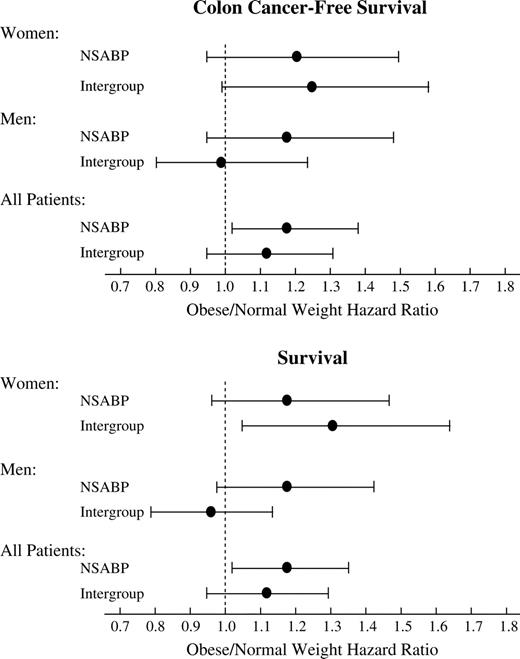
Comparison of findings from the National Surgical Adjuvant Breast and Bowel Project Study and the Intergroup study ( 6 ) with respect to outcomes for obese patients. The hazard ratios ( dots ) are for patients with a body mass index (BMI) of 30 kg/m 2 or more relative to those with a BMI of 21.1–24.9 kg/m 2 , the referent group used in the Intergroup study. Error bars indicate 95% confidence intervals.
Association Between BMI, Chemotherapy Toxicity, and Completion of Treatment
To examine whether mortality and recurrence hazard differences by BMI could be related to differences in treatment tolerance or completion, we examined whether BMI was associated with toxicity events from chemotherapy or the completion of the chemotherapy regimen. Obese and very obese patients had lower rates of neutropenia and stomatitis than patients of normal weight ( Table 4 ), and underweight patients had higher incidence of stomatitis. However, adverse events were not associated with BMI to a degree that would be considered clinically important.
Treatment adverse event experience (≥grade 3) by body mass index (BMI) category *
| % patients within each BMI category | ||||||||||||
|---|---|---|---|---|---|---|---|---|---|---|---|---|
| Adverse event | <18.5 kg/m 2 (n = 140) | 18.5–24.9 kg/m 2 (n = 1789) | 25–29.9 kg/m 2 (n = 1525) | 30–34.9 kg/m 2 (n = 572) | ≥35 kg/m 2 (n = 234) | All patients (n = 4260) | P† | |||||
| Overall, grade 3 or 4 | 45.0 | 50.0 | 49.1 | 49.3 | 46.6 | 49.2 | .90 | |||||
| Leucopenia | 0.7 | 2.9 | 2.6 | 2.3 | 1.3 | 2.5 | .38 | |||||
| Neutropenia ‡ | 21.8 | 25.7 | 21.7 | 18.6 | 6.6 | 21.9 | <.001 | |||||
| Infection | 1.4 | 2.0 | 2.2 | 1.9 | 2.6 | 2.1 | .92 | |||||
| Nausea | 9.3 | 8.9 | 7.3 | 5.4 | 8.5 | 7.8 | .09 | |||||
| Vomiting | 7.9 | 7.8 | 5.6 | 5.1 | 5.6 | 6.5 | .06 | |||||
| Diarrhea | 20.7 | 28.2 | 28.1 | 30.9 | 33.3 | 28.5 | .18 | |||||
| Stomatitis | 17.1 | 14.5 | 15.1 | 10.3 | 9.4 | 14.0 | .02 | |||||
Table entries are the percentage of patients for whom adverse event data were reported (n = 4260) who experienced the adverse event.
Chi-square test (two-sided) for difference in frequency across BMI categories.
Absolute neutrophil count less than 1000/μL (this information was available only for the NSABP C-05 trial).
We used several approaches to examine whether chemotherapy dose differences may have contributed to the apparent prognostic influence of BMI. First, we examined whether dose “capping” (calculating the dose using a maximum BSA of 2.0) was more frequent among obese patients and whether there were differences in outcomes between those with and without capped dose. Overall, 27.7% of patients had a capped dose. As expected, capping was more frequent among heavier patients, with 55% of the obese and 73% of the very obese having a capped dose compared with 7% of normal weight patients. However, when an indicator variable for dose capping was included in the models evaluating hazards for the various endpoints, the association of BMI with outcomes did not change materially nor was there a statistically significant association of the dose indicator variable with colon cancer recurrence or mortality. Second, we examined whether BMI was associated with the number of chemotherapy courses begun. Although fewer chemotherapy courses were initiated in underweight patients than in normal weight patients, obese and very obese patients were as likely as normal weight patients to begin all six courses. Finally, the proportion of the planned 5FU dose actually received was calculated and classified into categories of less than 65%, 65%–84%, and 85% or more of planned dose. Again, underweight patients were more likely than normal weight patients to receive less than the planned dose, whereas obese and very obese patients were not.
D ISCUSSION
Examining data from two large clinical trials, we have found evidence of an association between BMI at diagnosis and outcomes in patients treated for Dukes B and C colon cancer. Mortality risk was increased at both ends of the adiposity spectrum, that is, among both underweight (BMI < 18.5 kg/m 2 ) and very obese (BMI ≥ 35 kg/m 2 ) individuals, but the causes of death for each group were different. Although mortality in underweight patients was more often due to non-colon cancer–related causes than mortality in normal weight patients, the very obese had greater risk of colon cancer recurrence and deaths likely attributable to colon cancer. To put the potential clinical relevance of obesity on outcomes in perspective, the excess risk for colon cancer recurrence and death for obese relative to normal weight patients observed in this study is similar in magnitude to the difference in prognosis between patients receiving surgery alone and those receiving adjuvant chemotherapy in previous clinical trials in this patient population ( 16 , 17 ).
The mechanism by which obesity is associated with higher colon cancer incidence and, as this study suggests, a higher risk for colon cancer recurrence and death is not completely understood but could involve interactions among insulin, insulin-like growth factors (IGF), and IGF-binding proteins ( 18 – 25 ) . Specifically, obesity is a major determinant of insulin resistance ( 23 , 24 ) . Insulin, in turn, appears to be central to the regulation of IGF-I bioactivity and to the synthesis of IGF-binding proteins ( 25 ) . Insulin, IGF-I, and IGF-binding proteins have all been implicated in the development of colon cancer, possibly through their role as mitogens for the colonic mucosa. In a prospective case–control study nested within the Physicians' Health Study, Ma et al. ( 22 ) found that men in the highest quintile for IGF-1 had 2.5 times the risk of colorectal cancer as men in the lowest quintile. An analysis of the Nurses' Health Study cohort found a comparable risk increase among women (relative risk = 2.17 for those in the highest quartile of IGF-1 compared with those in the lowest) ( 26 ) . That study as well as an investigation by Kaaks et al. ( 18 ) and a more recent study by Ma et al. ( 27 ) also observed an increase in colorectal cancer risk with increasing levels of C-peptide, a marker of insulin production. An increase in the hormone leptin level, which is enhanced by high BMI ( 28 ) , has also been implicated in the connection between obesity and risk of colon cancer. A study of Norwegian men found a statistically significant increase in risk of colon cancer among those in the highest quartile of leptin compared with those in the lowest quartile ( 29 ) . Whether these pathways that may influence colon cancer risk also play a role in the deleterious effect of obesity on prognosis remains to be demonstrated.
The explanation for greater mortality among underweight colon cancer patients is less clear. It is possible that their lower weight might be reflective of underlying comorbidities that increase mortality risk but that are insufficient to rule out trial entry. Evidence for this hypothesis comes from the higher rates of second malignancies and non–colon cancer deaths in underweight patients ( Table 2 ). Increased mortality for both underweight and overweight individuals has been previously noted in studies examining obesity and health outcomes, and the degree to which thinness is a cause or a consequence of increased mortality risk is often not clear ( 30 ) . Our observation of increased incidence of second primary respiratory cancers among underweight patients is similar to that noted by Henley et al. ( 31 ) in their analysis of the Cancer Prevention II study. Those authors suggested that the association between leanness and lung cancer mortality, rather than being causal, actually reflects the effects of smoking and preexisting disease on body composition ( 31 ) . Unfortunately, information on smoking was not collected as part of the NSABP clinical trials data.
Our analysis would be further strengthened if we were able to distinguish between patients who were underweight but had stable weights over time and those who lost a substantial amount of weight during the period immediately before trial entry, suggesting the presence of concurrent morbidities. Although incidence of second primary cancers was higher in underweight than normal weight individuals, suggesting the possibility of latent cancers, patients entering the trial had not been satisfactorily determined to be free of other cancers per protocol eligibility requirements.
Our results initially appear to be at odds with those of a similarly conducted analysis ( 6 ) of 3438 participants from Intergroup 0089, a four-arm clinical trial for patients with high risk (i.e., stage II and III colon cancer) that compared regimens consisting of 5FU combined with LV (at two dose levels), LEV, or both. That study found a statistically significant 34% increase in the risk of mortality and a non–statistically significant 24% increase in the risk of disease recurrence among obese (BMI ≥ 30 kg/m 2 ) women than among women with a BMI of 21.1–24.9 kg/m 2 . No excess risk was seen in men, and the risk increases across the entire cohort were not statistically significant. The two studies yield very similar results for the overall cohorts when the NSABP data are analyzed according to the same BMI groups as in the Intergroup study ( Fig. 4 ). However when analyzed according to the Intergroup BMI categories, the NSABP data still do not demonstrate a differential effect of obesity by sex (although taking variability of the estimates into account, the NSABP and Intergroup studies do not differ with respect to hazard ratios within sex) ( Fig. 4 ). It is not known whether the Intergroup study would yield the deleterious effect of BMI on outcomes if the extremes of the BMI distribution were considered, as in our study. Given the increasing proportion of Americans with BMI greater than 35 kg/m 2 and the fact that these individuals may be overrepresented among colon cancer patients, this may be an important group to consider. Although we show results by BMI category for illustrative purposes in our study, our findings of greater failure risk as BMI increases did not depend strictly on how BMI is categorized. Specifically, when BMI was considered on a continuous scale, it remained statistically significantly associated with failure hazard.
One possible explanation for the increased risk of colon cancer recurrence and death in obese as compared with normal weight patients relates to how BSA was used to determine chemotherapy dose. Specifically, in both trials, BSA was capped at 2.0, meaning that all patients with a BSA of more than 2.0 received the same chemotherapy dose as a patient with a BSA of 2.0. Although some previous analyses have suggested that chemotherapy dose intensity is important for optimal benefit in colorectal cancer ( 32 , 33 ) , neither dose intensity nor dose density has been shown conclusively to affect treatment efficacy, unlike the case for other malignancies such as breast cancer. In our study, the amount of drug received did not appear to explain the less favorable outcomes among obese patients, again in contrast to what has been observed in breast cancer patients ( 34 ) .
The study has several potential limitations. First, although the endpoints used for this analysis were similar to the original trial endpoints and BMI data were collected prospectively, this study remains a retrospective analysis of data that were not collected for the purpose of understanding the role of obesity in colon cancer prognosis. Consequently, we lack information on factors such as diet, physical activity, and other health behaviors that may be related to BMI but that may have independent associations with colon cancer recurrence and mortality, as well as with risk for second primary cancers and deaths from other causes. Second, we were able to ascertain BMI only at the time of study entry and during the period of chemotherapy delivery (the latter was not used in the analysis). It may be that weight or changes in weight in the period leading up to the colon cancer diagnosis or following colon cancer treatment are more important than simply weight at diagnosis to the subsequent development of recurrent colon cancer. Third, BMI may not be the appropriate measure of adiposity; it has been suggested that measures of central obesity, such as waist-to-hip circumference may be more informative ( 7 ) . Because BMI is an imperfect measure of adiposity, then if indeed the deleterious effect of weight on prognosis is mediated by fat content, then the use of more direct adiposity measures would likely strengthen the link between obesity and colon cancer recurrence and death observed in this study.
A strength of using clinical trial data to investigate BMI and outcomes is that patient trial entry criteria, baseline tumor and patient characteristics, treatment, and patient follow-up histories are all standardized and documented. Using standardized trial information reduces the likelihood of an apparent prognostic effect of BMI that is due to one or more of these factors.
In conclusion, high BMI at diagnosis was associated with an increased risk of colon cancer recurrence and of both colon cancer–related and non-colon cancer–related mortality in patients with Dukes B and C colon cancer. Recent evidence suggests that physical activity may reduce the risk of colon cancer recurrence and death ( 7 , 35 ). Although further prospective studies that evaluate the possible benefits of weight reduction among colon cancer patients are needed, physicians might use the frequent encounters they have with these patients to counsel them regarding the possibility of modifying this risk with lifestyle changes. In any case, pending these further investigations, encouraging more colorectal cancer patients to modify their diets and exercise more regularly is likely to have ancillary benefits.
Funded by Public Health Service grants NCI-R03-CA-99508, NCI-P30-CA-14599, NCI-U10-CA-69651, and NCI-U10-CA-12027 from the National Cancer Institute, National Institutes of Health, US Department of Health and Human Services. The funding agency played no role in the design or conduct, the analysis of these data, or the presentation of the findings.
References
Flegal KM, Carroll MD, Ogden CL, Johnson CL. Prevalence and trends in obesity among US adults, 1999–2000.
Martinez ME, Giovannucci E, Spiegelman D, Hunter DJ, Willett WC, Colditz GA. Leisure-time physical activity, body size, and colon cancer in women. Nurses' Health Study Research Group.
Giovannucci E, Ascherio A, Rimm EB, Colditz GA, Stampfer MJ, Willett WC. Physical activity, obesity, and risk for colon cancer and adenoma in men.
Calle EE, Rodriguez C, Walker-Thurmond K, Thun MJ. Overweight, obesity, and mortality from cancer in a prospectively studied cohort of US adults.
Tartter PI, Slater G, Papatestas AE, Aufses AH Jr. Cholesterol, weight, height, Quetelet's index, and colon cancer recurrence.
Meyerhardt JA, Catalano PJ, Haller DG, Mayer RG, Bensen AB III, MacDonald JS, et al. Influence of body mass index on outcomes and treatment-related toxicity in patients with colon carcinoma.
Haydon AM, Macinnis RJ, English DR, Giles GG. Effect of physical activity and body size on survival after diagnosis with colorectal cancer.
Wolmark N, Bryant J, Smith R, Grem J, Allegra C, Hyams D, et al. Adjuvant 5-fluorouracil and leucovorin with or without interferon alfa-2a in colon carcinoma: National Surgical Adjuvant Breast and Bowel Project protocol C-05.
Wolmark N, Rockette H, Mamounas E, Jones J, Wieand S, Wickerham DL, et al. Clinical trial to assess the relative efficacy of fluorouracil and leucovorin, fluorouracil and levamisole, and fluorouracil, leucovorin, and levamisole in patients with Dukes' B and C carcinoma of the colon: results from National Surgical Adjuvant Breast and Bowel Project C-04.
Physical status: the use and interpretation of anthropometry. Report of a WHO Expert Committee.
National Cancer Institute Cancer Therapy Evaluation Program. Common Toxicity Criteria. Available at: http://ctep.cancer.gov/reporting/ctc.html . [Last accessed: July 24,
Prentice RL, Kalbfleisch JD, Peterson AV Jr, Flournoy N, Farewell VT, Breslow NE. The analysis of failure times in the presence of competing risks.
Grambsch PM, Therneau TM. Proportional hazards tests and diagnostics based on weighted residuals.
Grambsch PM, Therneau TM, Fleming TR. Diagnostic plots to reveal functional form for covariates in multiplicative intensity models.
Wolmark N, Fisher B, Rockette H, Redmond C, Wickerham DL, Fisher ER, et al. Postoperative adjuvant chemotherapy or BCG for colon cancer: results from NSABP protocol C-01.
Wolmark N, Rockette H, Wickerham DL, Fisher B, Redmond C, Fisher ER, et al. Adjuvant therapy of Dukes' A, B, and C adenocarcinoma of the colon with portal-vein fluorouracil hepatic infusion: preliminary results of National Surgical Adjuvant Breast and Bowel Project Protocol C-02.
Kaaks R, Toniolo P, Akhmedkhanov A, Lukanova A, Biessy C, Dechaud H, et al. Serum C-peptide, insulin-like growth factor (IGF)-I, IGF-binding proteins, and colorectal cancer risk in women.
Giovannucci E, Pollak MN, Platz EA, Willet WC, Stampfer MJ, Majeed N, et al. A prospective study of plasma insulin-like growth factor-1 and binding protein-3 and risk of colorectal neoplasia in women.
Manousos O, Souglakos J, Bosetti C, Tzonou A, Chatzidakis V, Trichopoulos D, et al. IGF-I and IGF-II in relation to colorectal cancer.
Schoen RE, Tangen CM, Kuller LH, Burke GL, Cushman M, Tracy RP, et al. Increased blood glucose and insulin, body size, and incident colorectal cancer.
Ma J, Pollak MN, Giovannucci E, Chan JM, Tao Y, Hennekens CH, et al. Prospective study of colorectal cancer risk in men and plasma levels of insulin-like growth factor (IGF)-I and IGF-binding protein-3.
Abate N. Insulin resistance and obesity. The role of fat distribution pattern.
Kaaks R, Lukanova A. Energy balance and cancer: the role of insulin and insulin-like growth factor-I.
Wei EK, Ma J, Pollak MN, Rifai N, Fuchs CS, Hankinson SE, et al. A prospective study of C-peptide, insulin-like growth factor-I, insulin-like growth factor binding protein-1, and the risk of colorectal cancer in women.
Ma J, Giovannucci E, Pollak M, Leavitt A, Tao Y, Gaziano JM, et al. A prospective study of plasma C-peptide and colorectal cancer risk in men.
Wauters M, Mertens I, Considine R, De Leeuw I, Van Gaal L. Are leptin levels dependent on body fat distribution in obese men and women?
Stattin P, Palmqvist R, Soderberg S, Biessy C, Ardnor B, Hallmans G, et al. Plasma leptin and colorectal cancer risk: a prospective study in Northern Sweden.
Katzmarzyk PT, Janssen I, Ardern CI. Physical inactivity, excess adiposity and premature mortality.
Henley JS, Flanders DW, Manatunga A, Thun MJ. Leanness and Lung Cancer Risk: Fact or Artifact?
Hryniuk WM, Figueredo A, Goodyear M. Applications of dose intensity to problems in chemotherapy of breast and colorectal cancer.
Focan C, Bury J, Beauduin M, Herman ML, Vindevoghel A, Lecompte M, et al. Importance of 5-fluorouracil dose-intensity in a double randomised trial on adjuvant portal and systemic chemotherapy for Dukes B2 and C colorectal cancer.
Colleoni M, Li S, Gelber RD, Price KN, Coates AS, Castiglione-Gertsch M, et al. Relation between chemotherapy dose, oestrogen receptor expression, and body-mass index.

