


Abstract
Epidemiologic findings are inconsistent concerning risk for breast cancer associated with low folate intake or blood folate levels. We performed a meta-analysis of prospective and case–control studies to examine folate intake and levels in relation to risk of breast cancer.
We searched MEDLINE for studies of this association that were published in any language from January 1, 1966, through November 1, 2006. Study-specific risk estimates were pooled by use of a random-effects model. All statistical tests were two-sided.
Folate intake in increments of 200 μg/day was not associated with the risk of breast cancer in prospective studies (estimated summary relative risk [RR] = 0.97, 95% confidence interval [CI] = 0.88 to 1.07, for dietary folate [eight studies; 302 959 participants and 8367 patients with breast cancer], and RR = 1.01, 95% CI = 0.97 to 1.05, for total folate [six studies; 306 209 participants and 8165 patients with breast cancer]) but was statistically significantly inversely associated with risk in case–control studies (estimated summary odds ratio [OR] = 0.80, 95% CI = 0.72 to 0.89, for dietary folate [13 studies; 8558 case patients and 10 812 control subjects], and OR = 0.93, 95% CI = 0.81 to 1.07, for total folate [three studies; 2184 case patients and 3233 control subjects]). High blood folate levels versus low levels were not statistically significantly associated with the risk of breast cancer in prospective studies (OR = 0.81, 95% CI = 0.59 to 1.10 [three studies]) or in case–control studies (OR = 0.41, 95% CI = 0.15 to 1.10 [two studies]). Among the two prospective studies and two case–control studies that stratified by alcohol consumption, high folate intake (comparing the highest with the lowest category) was associated with a statistically significant decreased risk of breast cancer among women with moderate or high alcohol consumption (summary estimate = 0.51, 95% CI = 0.41 to 0.63) but not among women with low or no alcohol consumption (summary estimate = 0.95, 95% CI = 0.78 to 1.15). Few studies examined whether the relation between folate intake and breast cancer was modified by intakes of methionine or vitamins B 6 and B 12 , and the findings were inconsistent.
No clear support for an overall relationship between folate intake or blood folate levels and breast cancer risk was found. Adequate folate intake may reduce the increased risk of breast cancer that has been associated with moderate or high alcohol consumption.
Reports of the association between risk of breast cancer and folate intake or blood levels have been inconsistent.
Meta-analysis of prospective cohort and retrospective case–control studies.
Dietary folate intake was statistically significantly inversely associated with risk of breast cancer in case–control studies but was not associated with risk in prospective studies. Blood folate levels were not associated with risk in either type of study.
No clear overall association between folate intake or folate blood levels and breast cancer risk was found. Prospective and retrospective studies can give different estimates for associations between dietary exposures and cancer risk.
Misclassification of folate intake may have been introduced in prospective studies that assessed dietary intake only at baseline because of the folate fortification of flour and cereal-grain products in the United States since 1998. Case-control studies may be affected by inaccurate recall of dietary intake.
Breast cancer is the most common malignancy among women in the United States and in other Western countries ( 1 ). Dietary factors may modulate the risk of this malignancy; yet, the only dietary factor that has been consistently associated with increased breast cancer risk is alcohol ( 2 – 4 ).
For the past two decades, a mounting body of epidemiologic and experimental studies has indicated that low folate intake or status was associated with elevated risk of several cancers, including breast cancer ( 5 – 7 ). The biologic mechanisms whereby folate deficiency may enhance carcinogenesis may be related to the role of this vitamin in one-carbon metabolism. In this role, folate provides one-carbon groups for the formation of S -adenosylmethionine (the molecule that is primarily responsible for DNA methylation) as well as for the de novo biosynthesis of nucleotides (purines and thymidylate) needed for DNA synthesis and repair ( 5 , 8 ). Other nutrients that are involved in one-carbon metabolism and thus might modify the association between folate and breast cancer risk include methionine (a one-carbon donor) and vitamins B 6 and B 12 (cofactors for one-carbon metabolism). Alcohol consumption can negatively influence folate absorption and metabolism ( 9 , 10 ). Several prospective studies have found that the increase in the risk of breast cancer that was associated with alcohol consumption may be reduced by adequate folate intake ( 11 – 16 ).
Results of epidemiologic studies that have examined the relationship between folate intake or folate levels in the blood and the risk of breast cancer have been inconsistent. The purpose of this review was to evaluate the epidemiologic evidence from prospective and case–control studies on folate and risk of breast cancer by summarizing it quantitatively with a meta-analytic approach. We also investigated whether the relation between folate and breast cancer risk was modified by intakes of alcohol, methionine, and vitamins B 6 and B 12 .
Methods
Search Strategy
Studies were identified by a literature search of MEDLINE (from January 1, 1966, through November 1, 2006) by use of the search terms “folate” or “folic acid” in combination with “breast cancer” or “breast neoplasm.” We also reviewed the reference lists of retrieved articles to identify additional studies. No language restrictions were imposed.
Study Selection
For inclusion, studies had to fulfill the following criteria: 1) have a prospective or case–control study design; 2) present data on breast cancer incidence or mortality; 3) report results on dietary folate intake (i.e., folate from foods only), total folate intake (i.e., folate from foods and supplements), or serum or plasma folate levels; and 4) provide relative risk (RR) estimates (or odds ratios [ORs] in case–control studies) with confidence intervals (CIs) or sufficient data to allow calculation of these effect measures.
Data Extraction
We extracted the following data from each publication: the first author's last name, the year of publication, the study design, the country in which the study was performed, the sample size, the age range of study participants, menopausal status, the measure of exposure, the range of exposure, the covariates controlled for in the analysis, and the risk estimates with corresponding confidence intervals for folate intake or blood folate levels. We extracted the risk estimates that reflected the greatest degree of control for potential confounders.
Statistical Analysis
We weighted the study-specific log relative risks for cohort studies and log odds ratios for case–control studies by the inverse of their variance to calculate a summary estimate and its 95% confidence interval. Studies were combined by use of the DerSimonian and Laird random-effects model, which considers both within- and between-study variation ( 17 ).
For the dose–response meta-analysis of folate intake, we used the method proposed by Greenland and Longnecker ( 18 ) and Orsini et al. ( 19 ) to compute study-specific slopes (linear trends) from the correlated log risk estimates across categories of folate intake. This method requires that the distributions of case patients and control subjects (or person-time) and the risk estimates with their variance estimates for three or more quantitative exposure categories be known. For three studies ( 20 – 22 ) that did not provide the distribution of case patients and control subjects by exposure category, we estimated the slopes by use of variance-weighted least squares regression models. For each study, the median or mean level of folate intake for each category of intake was assigned to each corresponding relative risk estimate. When the median or mean intake per category was not provided in the article, we assigned the midpoint of the upper and lower boundaries in each category as the average intake. If the lower boundary of the lowest category or the upper boundary of the highest category was not provided, we assumed that both boundaries had the same amplitude as the closest category.
We used the Q and I2 statistics ( 23 ) to examine statistical heterogeneity among studies. For the Q statistic, a P value of less than .1 was considered representative of statistically significant heterogeneity. I2 is the proportion of total variation contributed by between-study variation ( 23 ). Publication bias was evaluated with the use of funnel plots and with Egger's regression asymmetry test ( P <.1 was considered representative of statistically significant publication bias) ( 24 ). All statistical analyses were performed with Stata, version 9.0 (StataCorp, College Station, TX). All statistical tests were two-sided.
Results
Folate Intake
We identified nine prospective studies ( 11 – 16 , 20 , 25 , 26 ) ( Table 1 ) and 14 case–control studies ( 21 , 22 , 27 – 38 ) ( Table 2 ) of folate intake and risk of breast cancer. Five of the nine prospective studies were conducted in the United States, one was carried out in Canada, one in Australia, one in Denmark, and one in France. Of the 14 case–control studies, five were from the United States, five from Europe, one from Uruguay, one from China, one from Mexico, and one from Taiwan.
Characteristics of eight prospective studies included in the meta-analysis of folate intake and breast cancer risk *
| Study (reference) | Study participants; follow-up period | No. of case patients | Dietary assessment | Measure of exposure: exposure difference | Adjusted RR † (95% CI) | Adjustments |
|---|---|---|---|---|---|---|
| Zhang et al. 1999 ( 11 ) | 88 818 pre- and postmenopausal women aged 30–55 y in the United States (Nurses' Health Study); 1980–1996 | 3483 | Self-administered FFQs (61 items in 1980; 126 items in 1984, 1986, and 1990) | TF: ≥600 vs. 150–299 μg/day | 0.93 (0.83 to 1.03) 0.99 (0.79 to 1.23) pre ‡ 0.86 (0.76 to 0.98) post ‡ | Age, parity, age at first birth, age at menarche, age at menopause, PMH use, family history, history of benign breast disease, BMI, weight change, height, energy, β-carotene, alcohol |
| Rohan et al. 2000 ( 12 ) | 5382 pre- and postmenopausal women aged 40–59 y in Canada (Canadian National Breast Screening Study); 1980–1993 | 1336 | Self-administered 86-item FFQ | DF: >354 vs. <225 μg/day | 0.99 (0.79 to 1.25) 1.72 (0.97 to 3.06) pre ‡ 0.92 (0.71 to 1.20) post ‡ | Age, study area, age at menarche, parity, menopausal status, family history, practice of breast self-examination, randomization group, energy, alcohol |
| Sellers et al. 2001 ( 13 ) | 34 387 postmenopausal women aged 55–69 y in the United States (Iowa Women's Health Study); 1986–1997 | 1586 | Self-administered 127-item FFQ | DF: >294 vs. ≤172 μg/day TF: >351 vs. ≤186 μg/day | 0.83 (0.62 to 1.11) § 0.84 (0.63 to 1.11) § | Age, education, age at menarche, parity, age at first birth, age at menopause, OC use, PMH use, family history, BMI, waist-to-hip ratio, height, BMI at age 18 y, smoking, physical activity, B vitamins, alcohol |
| Feigelson et al. 2003 ( 25 ) | 66 561 postmenopausal women aged 40–87 y in the United States (American Cancer Society Cancer Prevention Study II Nutrition Cohort); 1992–1997 | 1303 | Self-administered 68-item FFQ | DF: >294 vs. <179 μg/day TF: >604 vs. <210 μg/day | 1.07 (0.91 to 1.27) 1.10 (0.94 to 1.29) | Age, race, education, age at menarche, parity, age at first birth, age at menopause, PMH use, family history of breast cancer, history of breast lump, mammographic history, physical activity, BMI, adult weight gain, multivitamin use, energy, methionine, alcohol |
| Cho et al. 2003 ( 20 ) | 90 655 premenopausal women aged 26–46 y in the United States (Nurses' Health Study II); 1991–1999 | 714 | Self-administered 130-item FFQ (diet was assessed in 1991 and 1995) | DF: 429 vs. 210 μg/day TF: 826 vs. 228 μg/day (median intakes) | 1.07 (0.82 to 1.38) 1.03 (0.81 to 1.32) | Age, height, parity, age at first birth, age at menarche, menopausal status, OC use, family history, history of benign breast disease, smoking, BMI, energy, animal fat, alcohol |
| Baglietto et al. 2005 ( 14 ) | 17 447 pre- and postmenopausal women aged 40–69 y in Australia (Melbourne Collaborative Cohort); 1990–2003 | 537 | Self-administered 121-item FFQ | DF: per 100 μg/day | 1.01 (0.93 to 1.10) | Age, energy |
| Tjønneland et al. 2005 ( 15 ) | Nested case–control study: 388 cancer-free postmenopausal women aged 50–65 y in Denmark (Diet, Cancer, and Health); 1994–1997 | 388 | Self-administered 192-item FFQ | DF: >400 vs. ≤250 μg/day TF: >400 vs. ≤300 μg/day | 0.80 (0.37 to 1.69) 0.60 (0.35 to 1.06) | Age, education, parity, age at first birth, history of benign breast cancer, BMI, energy, vitamin C |
| Stolzenberg-Solomon et al. 2006 ( 16 ) | 25 400 postmenopausal women aged 55–74 y in the United States (PLCO); 1993–2003 | 691 | Self-administered 137-item FFQ | DF: >411 vs. <261 μg/day TF: >853 vs. < 336 μg/day | 1.01 (0.80 to 1.27) 1.27 (1.00 to 1.62) | Age, education, age at menarche, parity, age at first birth, OC use, age at menopause, PMH use, mammography screening history, history of benign breast disease, family history, energy |
| Lajous et al. 2006 ( 26 ) | 62 739 postmenopausal women in France (French E3N cohort); 1993–2002 | 1812 | Self-administered 208-item FFQ | DF: 522 vs. 296 μg/day (median intakes) | 0.78 (0.67 to 0.90) | Age, region of residence, education, family history, history of benign breast disease, age at menarche, parity, age at first birth, breast-feeding, years since last use of OC, age at menopause, PMH use, mammography screening history, height, BMI, physical activity, vitamin supplement use, alcohol |
RR = relative risk; CI = confidence interval; FFQ = food-frequency questionnaire; TF = total folate (i.e., folate from foods and dietary supplements); PMH = postmenopausal hormone; BMI = body mass index; DF = dietary folate (i.e., folate from foods); OC = oral contraceptive; PLCO = Prostate, Lung, Colorectal, and Ovarian Cancer Screening Trial cohort.
Relative risk for highest versus lowest intake category.
Pre = among premenopausal women; post = among postmenopausal women.
Converted relative risk; the original one was for comparison of low versus high folate intake.
Characteristics of 14 case-control studies included in the meta-analysis of folate intake and breast cancer risk *
| Study (reference) | Country | No. of case patients † | No. of control subjects † | Age, y | Dietary assessment | Measure of exposure: exposure difference | Adjusted OR ‡ (95% CI) | Adjustments |
|---|---|---|---|---|---|---|---|---|
| Graham et al. 1991 ( 27 ) | United States | 439 (56.5) postmenopausal | 494 population-based (45.9) | 41–85 | Interview based on FFQ | DF: ≥451 vs. ≤289 μg/day | 0.70 (0.48 to 1.02) | Age, education, age at menarche, parity, age at first birth, family history, benign breast disease, BMI |
| Freudenheim et al. 1996 ( 28 ) | United States | 297 (66) premenopausal | 311 population-based (62) | 40–50 | Interview based on 172-item FFQ | DF: ≥460 vs. ≤304 μg/day | 0.76 (0.43 to 1.37) | Age, education, age at menarche, age at first birth, family history, benign breast disease, BMI, energy, total vegetables |
| Thorand et al. 1998 ( 29 ) | Germany | 43 (75) postmenopausal | 106 population-based ( 45 ) | 38–80 | Interview based on diet history | DF: ≥262 vs. ≤182 μg/day | 1.14 (0.73 to 1.79) | Age, SES, age at menarche, nulliparity, PMH use, smoking, BMI, energy |
| Potischman et al. 1999 ( 30 ) | United States | 568 (86.0) Premeno-pausal | 1451 population-based (76.9) | 20–44 | Self-administered 100-item FFQ | DF: ≥327 vs. <173 μg/day TF: ≥613 vs. <213 μg/day | 0.89 (0.7 to 1.2) 1.11 (0.8 to 1.5) | Age, study area, ethnicity, education, age at first birth, OC use, smoking, alcohol |
| Ronco et al. 1999 ( 31 ) | Uruguay | 400 (97.3) | 405 hospital-based (94.4) | 20–89 | Interview based on 64-item FFQ | DF: ≥207 vs. <132 μg/day | 0.98 (0.60 to 1.59) § | Age, residence, urban/rural, age at menarche, parity, menopausal status, family history, BMI, energy, total vegetables |
| Negri et al. 2000 ( 32 ) | Italy | 2569 (∼96) | 2588 hospital-based (∼96) | 20–74 | Interview based on 78-item FFQ | DF: highest vs. lowest quintile | 0.73 (0.60 to 0.88) 0.57 (0.41 to 0.78) pre ‖ 0.79 (0.62 to 0.99) post ‖ | Age, study area, education, parity, menopausal status, energy |
| Levi et al. 2001 ( 21 ) | Switzerland | 289 (85) | 442 hospital-based (81) | 23–74 | Interview based on 79-item FFQ | DF: 359 vs. 189 μg/day ¶ DF: per 170 μg/day DF: per 170 μg/day | 0.45 (0.27 to 0.74) 0.63 (0.30 to 1.32) pre ‖ 0.55 (0.35 to 0.86) post ‖ | Age, education, parity, menopausal status, BMI, energy, alcohol |
| Shrubsole et al. 2001 ( 33 ) | China | 1321 (91.1) | 1382 population-based (90.3) | 25–64 | Interview based on 76-item FFQ | DF: >345 vs. <194 μg/day | 0.62 (0.46 to 0.82) 0.78 (0.56 to 1.07) pre ‖ 0.66 (0.44 to 0.99) post ‖ | Age, education, age at menarche, parity, age at first birth, menopausal status, age at menopause, family history, history of fibroadenoma, waist-to-hip ratio, physical activity, energy, fruits and vegetables, total animal foods |
| Sharp et al. 2002 ( 34 ) | United Kingdom (Scotland) | 62 (81) postmenopausal | 66 population-based (59) | 50–69 | Self-administered FFQ | DF: >303 vs. <255 μg/day | 0.49 (0.20 to 1.20) | Energy |
| Zhu et al. 2003 ( 22 ) | United States | 304 (74.3) | 305 population-based (72.6) | 20–64 | Interview based on FFQ | DF: >612 vs. <326 μg/day | 0.58 (0.25 to 1.38) # | Age, education, age at menarche, parity, age at first birth, menopausal status, PMH use, family history, history of benign breast disease, smoking, weight, height, energy, vitamins B 2 , B 6 , B 12 , and C, other factors |
| Adzersen et al. 2003 ( 35 ) | Germany | 310 (NA) | 353 hospital-based (84) | 25–75 | Self-administered 161-item FFQ | DF: >147 vs. <77 μg/day | 0.47 (0.25 to 0.88) § | Age, age at menarche, age at first birth, age at menopause, PMH use, family history, history of benign breast disease, smoking, BMI, energy, alcohol |
| Chen et al. 2005 ( 36 ) | United States | 1481 (82.1) | 1518 population-based (62.7) | 20–98 | Interview based on FFQ | DF: >356 vs. ≤159 μg/day TF: >722 vs. ≤208 μg/day | 0.85 (0.64 to 1.14) § 0.95 (0.74 to 1.22) § | Age, education, family history, history of benign breast disease, BMI, energy |
| Lajous et al. 2006 ( 37 ) | Mexico | 475 (88) | 1391 population-based (90) | 18–87 | Interview based on 104-item FFQ | DF: 454 vs. 224 μg/day ¶ | 0.64 (0.45 to 0.90) 0.73 (0.42 to 1.27) pre ‖ 0.55 (0.35 to 0.86) post ‖ | Age, SES, parity, menopausal status, family history, BMI, energy, dietary fiber, carbohydrate, polyunsaturated fat |
| Chou et al. 2006 ( 38 ) | Taiwan | 135 (NA) | 264 hospital-based (NA) | 20–80 | Interview based on 31-item FFQ | TF: >507 vs. <335 μg/day | 0.51 (0.30 to 0.87) | Age, energy |
OR = odds ratio; CI = confidence interval; DF = dietary folate (i.e., folate from foods); BMI = body mass index; FFQ = food-frequency questionnaire; SES = socioeconomic status; PMH = postmenopausal hormone; TF = total folate (i.e., folate from foods and dietary supplements); OC = oral contraceptive; NA = information not available.
Values in parentheses are the response rates expressed as a percentage.
Odds ratio for highest versus lowest intake category.
The authors reported that the association between folate and breast cancer risk did not appreciably vary with menopausal status (odds ratios by strata of menopausal status were not provided in the article).
Pre = among premenopausal women; post = among postmenopausal women.
Median folate intake in the highest and lowest categories.
The odds ratio (and its 95% confidence interval) was obtained by pooling the odds ratios from stratified analyses by methylation status of the estrogen receptor genes. The odds ratio is converted; the original one was for comparison of low versus high folate intake.
Eight prospective studies ( 12 – 16 , 20 , 25 , 26 ) (including 302 959 participants and 8367 patients with breast cancer) and 13 case–control studies ( 21 , 22 , 27 – 37 ) (including 8558 case patients and 10 812 control subjects) provided results on dietary folate intake. The risk estimates of breast cancer for the highest versus the lowest category of dietary folate intake in individual prospective and case–control studies and summary estimates are shown in Fig. 1 . Only one of the eight prospective studies reported a statistically significant inverse association between dietary folate intake and risk of breast cancer. The summary relative risk for prospective studies was approximately 1.0, but there was some indication of heterogeneity among studies ( Fig. 1 ). Of the 13 case–control studies, five ( 21 , 32 , 33 , 35 , 37 ) found a statistically significant inverse relation between dietary folate intake and breast cancer risk. Overall, high versus low dietary folate intake was associated with a statistically significant 27% reduced risk of breast cancer in case–control studies; there was no statistically significant heterogeneity among studies ( Fig. 1 ). Egger's test suggested no statistically significant asymmetry of the funnel plot for prospective ( P = .63) or case–control ( P = .37) studies, indicating no evidence of substantial publication bias.
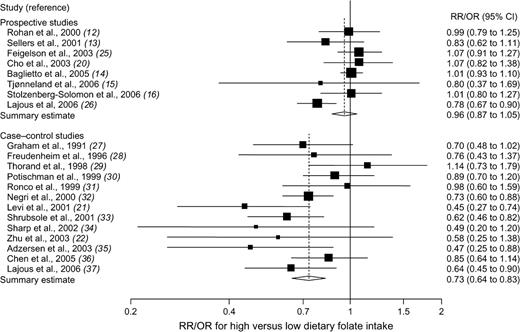
Relative risks (RRs; in prospective studies) or odds ratios (ORs; in case–control studies) of breast cancer comparing the highest with the lowest dietary folate intake categories. Squares indicate study-specific risk estimates ( size of the square reflects the study-specific statistical weight, i.e., the inverse of the variance); horizontal lines indicate 95% confidence intervals (CIs); diamond indicates summary estimate with its corresponding 95% confidence interval. Test for heterogeneity: prospective studies, Q = 12.65, P = .08, and I2 = 44.6%; case–control studies, Q = 16.61, P = .17, and I2 = 27.8%.
The association between total folate intake and breast cancer risk was examined in six prospective studies ( 11 , 13 , 15 , 16 , 20 , 25 ) (involving 306 209 participants and 8165 patients with breast cancer) and three case–control studies ( 30 , 36 , 38 ) (involving 2184 case patients and 3233 control subjects). Overall, no statistically significant association was observed between total folate intake and risk of breast cancer in either prospective or case–control studies; there was statistically significant heterogeneity among studies within each study design ( Fig. 2 ). There was no evidence of publication bias ( P = .82, for prospective studies, and P = .41, for case–control studies).
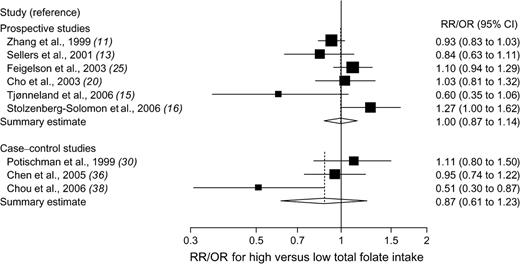
Relative risks (RRs; in prospective studies) or odds ratios (ORs; in case–control studies) of breast cancer comparing the highest with the lowest total folate intake categories. Squares indicate study-specific risk estimates ( size of the square reflects the study-specific statistical weight, i.e., the inverse of the variance); horizontal lines indicate 95% confidence intervals (CIs); diamond indicates summary estimate with its corresponding 95% confidence interval. Test for heterogeneity: prospective studies, Q = 11.62, P = .04, and I2 = 57.0%; case–control studies, Q = 6.14, P = .05, and I2 = 67.4%.
There was a large variation among studies in the difference in folate intake between the highest and lowest exposure categories ( Tables 1 and 2 ). To normalize this variability, for each study, we calculated a risk estimate for an increment of folate intake of 200 μg/day. Overall, we found that an increment of dietary folate intake of 200 μg/day was not associated with breast cancer risk among prospective studies (summary estimate = 0.97, 95% CI = 0.88 to 1.07) but was statistically significantly inversely associated with breast cancer risk among case–control studies (summary estimate = 0.80, 95% CI = 0.72 to 0.89); there was statistically significant heterogeneity among the prospective studies but not among the case–control studies ( Table 3 ). Stratified analysis (within each study design) by geographic region, menopausal status, or adjustment for alcohol intake did not show any statistically significant difference in summary estimates between strata ( Table 3 ). In case–control studies, the type of control group, the response rate among control subjects, and type of dietary assessment method did not statistically significantly affect the magnitude of the association between dietary folate intake and risk of breast cancer ( Table 3 ). Total folate was not associated with the risk of breast cancer in either prospective studies (for a folate intake increment of 200 μg/day, summary estimate = 1.01, 95% CI = 0.97 to 1.05) or in case–control studies (summary estimate = 0.93, 95% CI = 0.81 to 1.07); statistically significant heterogeneity was found among the prospective studies and among the case–control studies ( Table 3 ).
Summary relative risk (RR) or odds ratio (OR) estimates of the association between folate intake (in increments of 200 μg/day) and breast cancer risk for prospective and case-control studies *
| Heterogeneity test | |||||||
|---|---|---|---|---|---|---|---|
| Stratification group | References | RR/OR (95% CI) † | Q | P | I2 (%) ‡ | ||
| Prospective studies | |||||||
| Dietary folate, all studies | 12–16,20,25,26 | 0.97 (0.88 to 1.07) | 14.03 | .05 | 50.1 | ||
| Geographic region | |||||||
| United States | 13,16,20,25 | 1.04 (0.94 to 1.15) | 1.95 | .58 | 0 | ||
| Other § | 12,14,15,26 | 0.90 (0.77 to 1.05) | 6.37 | .10 | 52.9 | ||
| Menopausal status | |||||||
| Premenopausal | 12,20 | 1.16 (0.96 to 1.41) | 1.04 | .31 | 3.7 | ||
| Postmenopausal | 12,13,15,16,25,26 | 0.92 (0.82 to 1.03) | 8.39 | .14 | 40.4 | ||
| Adjusting for alcohol intake | |||||||
| No | 14–16 | 0.99 (0.87 to 1.13) | 2.10 | .35 | 4.9 | ||
| Yes | 12,13,20,25,26 | 0.97 (0.84 to 1.11) | 11.29 | .02 | 64.6 | ||
| Total folate, all studies | 11,13,15,16,20,25 | 1.01 (0.97 to 1.05) | 9.69 | .08 | 48.4 | ||
| Case–control studies | |||||||
| Dietary folate, all studies | 21,22,27–37 | 0.80 (0.72 to 0.89) | 14.65 | .26 | 18.1 | ||
| Geographic region | |||||||
| United States | 22,27,28,30,36 | 0.87 (0.78 to 0.98) | 2.21 | .70 | 0 | ||
| Europe | 21,29,32,34,35 | 0.68 (0.46 to 0.99) | 7.64 | .11 | 47.7 | ||
| Other ‖ | 31,33,37 | 0.72 (0.61 to 0.86) | 0.39 | .83 | 0 | ||
| Menopausal status | |||||||
| Premenopausal | 21,28,30,32,33,37 | 0.80 (0.68 to 0.96) | 6.44 | .27 | 22.4 | ||
| Postmenopausal | 21,27,29,32–34,37 | 0.75 (0.58 to 0.96) | 20.74 | .002 | 71.1 | ||
| Type of control group | |||||||
| Population-based | 22,27–30,33,34,36,37 | 0.83 (0.75 to 0.92) | 8.83 | .36 | 9.4 | ||
| Hospital-based | 21,31,32,35 | 0.67 (0.50 to 0.91) | 4.12 | .25 | 27.1 | ||
| Response rate among control subjects, % | |||||||
| <70 | 27–29,34,36 | 0.86 (0.74 to 1.00) | 3.41 | .49 | 0 | ||
| 70–89 | 21,22,30,35 | 0.74 (0.54 to 1.01) | 8.42 | .04 | 64.4 | ||
| ≥90 | 31–33,37 | 0.74 (0.64 to 0.86) | 0.86 | .83 | 0 | ||
| Dietary assessment method | |||||||
| Self-administered FFQ | 30,34,35 | 0.52 (0.19 to 1.42) | 6.08 | .05 | 67.5 | ||
| Interview based on FFQ | 21,22,27–29,31–33,36,37 | 0.79 (0.72 to 0.87) | 6.91 | .65 | 0 | ||
| Adjusting for alcohol intake | |||||||
| No | 22,27–29,31–35,37 | 0.76 (0.68 to 0.85) | 6.85 | .65 | 0 | ||
| Yes | 21,30,36 | 0.84 (0.66 to 1.08) | 5.12 | .08 | 60.9 | ||
| Total folate, all studies | 30,36,38 | 0.93 (0.81 to 1.07) | 6.28 | .04 | 68.1 | ||
CI = confidence interval; FFQ = food-frequency questionnaire. All statistical tests were two-sided.
Relative risk (in prospective studies) or odds ratio (in case–control studies) for an increment of folate intake of 200 μg/day.
I2 is interpreted as the proportion of total variation across studies that is due to heterogeneity rather than chance.
One study each in Canada, Australia, Denmark, and France.
One study each in Uruguay, Mexico, and China.
Blood Folate Levels
Of the three prospective studies (including two nested case–control studies) ( 39 – 41 ) and two case–control studies ( 38 , 42 ) of blood folate levels and breast cancer risk, two were carried out in the United States, two in Australia, and one in Taiwan ( Table 4 ). High blood folate levels versus low levels were not statistically significantly associated with the risk of breast cancer in prospective studies (summary estimate = 0.81, 95% CI = 0.59 to 1.10) or in case–control studies (summary estimate = 0.41, 95% CI = 0.15 to 1.10); there was statistically significant heterogeneity among the case–control studies but not among the prospective studies ( Fig. 3 ). The Egger's test for publication bias was not statistically significant ( P = .68, for prospective studies, and P = .72, for all studies).
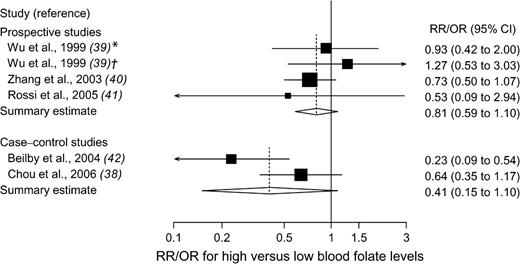
Relative risks (RRs; in prospective studies) or odds ratios (ORs; in case–control studies) of breast cancer comparing the highest with the lowest blood folate level categories. Squares indicate study-specific risk estimates ( size of the square reflects the study-specific statistical weight, i.e., the inverse of the variance); horizontal lines indicate 95% confidence intervals (CIs); diamond indicates summary estimate with its corresponding 95% confidence interval. Test for heterogeneity: prospective studies, Q = 1.66, P = .65, and I2 = 0%; case–control studies, Q = 3.45, P = .06, and I2 = 71.0%. * = 1974 cohort; † = 1989 cohort.
Characteristics of three prospective studies and two case–control studies included in the meta-analysis of blood folate levels and breast cancer risk *
| Study (reference) | Country | No. of case patients | No. of control subjects | Age, y | Measure of exposure: exposure difference | Adjusted RR/OR † (95% CI) | Adjustments |
|---|---|---|---|---|---|---|---|
| Prospective studies ‡ | |||||||
| Wu et al. 1999 ( 39 ) | United States | 133 § 110 ¶ | 133 § 110 ¶ | 18–90 | SF: Q5 vs. Q1 | 0.93 (0.42 to 2.00) §‖ 1.27 (0.53 to 3.03) ‖¶ | Age, race, menopausal status, date of blood donation |
| Zhang et al. 2003 ( 40 ) | United States | 712 | 712 | 43–69 | PF: >14.0 vs. <4.6 ng/mL | 0.73 (0.50 to 1.07) | Age, age at menarche, parity, age at first birth, age at menopause, PMH use, family history of breast cancer, history of benign breast disease, BMI, alcohol |
| Rossi et al. 2005 ( 41 ) | Australia | 15 ¶ | 1024 | 40–90 | SF: ≥6.0 vs. <3.0 μg/L | 0.53 (0.09 to 2.94) ‖ | Age, parity, menopausal status, OC use, smoking, BMI, alcohol |
| Case–control studies | |||||||
| Beilby et al. 2004 ( 42 ) | Australia | 141 | 109 | 30–84 | SF: >9.0 vs. <5.0 μg/L | 0.23 (0.09 to 0.54) | Age, MTHFR C677T genotype, age at menarche, parity, total fat, alcohol |
| Chou et al. 2006 ( 38 ) | Taiwan | 128 | 257 | 20–80 | PF: >13.3 vs. <9.0 ng/mL | 0.64 (0.35 to 1.17) | Age, duration of fasting |
RR = relative risk; OR = odds ratio; CI = confidence interval; SF = serum folate; Q = quintile; PF = plasma folate; PMH = postmenopausal hormone; BMI = body mass index; OC = oral contraceptive; MTHFR = methylenetetrahydrofolate reductase.
Relative risk (in prospective studies) or odds ratio (in case–control studies) for highest versus lowest category.
The studies by Wu et al. ( 38 ) and by Zhang et al. ( 39 ) were nested case–control studies within prospective cohorts.
1974 cohort (median folate concentration among controls = 3.6 ng/mL).
Converted odds ratio; the original one was for comparison of low versus high serum folate levels.
1989 cohort (median folate concentration among controls = 8.0 ng/mL).
Statistical Interaction of Folate and Alcohol
Two prospective studies ( 11 , 12 ) and two case–control studies ( 21 , 32 ) presented results on folate intake in relation to breast cancer risk that were stratified by alcohol consumption. In all four studies, there was a statistically significant reduction in breast cancer risk for high versus low folate intake among women who consumed moderate or high amounts of alcohol (summary estimate = 0.51, 95% CI = 0.41 to 0.63) but not among women with low or no alcohol consumption (summary estimate = 0.95, 95% CI = 0.78 to 1.15) ( Fig. 4 ). The association between folate intake and breast cancer risk did not vary by stratum of alcohol consumption in two other prospective studies ( 20 , 26 ) (these studies did not provide relative risk estimates by strata of alcohol consumption). The Egger's test provided no indication of publication bias ( P = .23, for the high alcohol intake strata; P = .59, for the low alcohol intake strata).
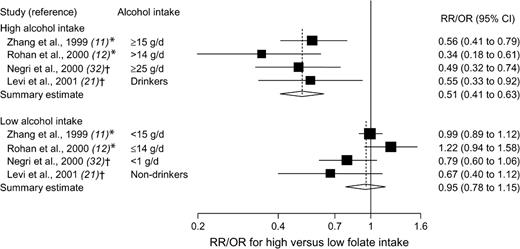
Relative risks (RRs; in prospective studies) or odds ratios (ORs; in case–control studies) of breast cancer comparing the highest with the lowest folate intake categories, stratified by alcohol consumption. Squares indicate study-specific risk estimates ( size of the square reflects the study-specific statistical weight, i.e., the inverse of the variance); horizontal lines indicate 95% confidence intervals (CIs); diamond indicates summary estimate with its corresponding 95% confidence interval. Test for heterogeneity: high alcohol, Q = 2.12, P = .55, and I2 = 0%; low alcohol, Q = 7.06, P = .07, and I2 = 57.5%. * = Prospective study; † = case–control study.
Whether the association between alcohol consumption and risk of breast cancer was modified by folate intake was investigated in five prospective studies ( 13 – 16 , 25 ). Four of these studies observed that the increased risk of breast cancer associated with alcohol consumption was greatest in or limited to women with low folate intake ( 13 – 16 ); one study observed no interaction between folate and alcohol intake ( 25 ).
Statistical Interaction of Folate and Other Nutrients
Three prospective studies ( 11 , 12 , 25 ) and one case–control study ( 33 ) have examined whether the association between folate intake and risk of breast cancer is modified by methionine intake. In the Nurses' Health Study ( 11 ), total folate intake was statistically significantly inversely associated with breast cancer risk among women in the two lowest quintiles of methionine intake ( Ptrend = .03, for quintile 1, and Ptrend = .01, for quintile 2) but was not associated with risk among women in the three highest quintiles of methionine intake ( Ptrend = .88, for quintile 3; Ptrend = .23, for quintile 4; and Ptrend = .63, for quintile 5). In contrast, in a case–control study in China ( 33 ), the inverse association between dietary folate intake and breast cancer risk was stronger among women in the highest tertile of methionine intake than among those in the lowest tertile; however, a test for interaction was not statistically significant ( P = .15). There was no interaction between folate and methionine intake in relation to breast cancer in two other prospective studies ( 12 , 25 ).
One prospective study ( 26 ) and two case–control studies ( 33 , 37 ) have evaluated the association between dietary folate intake and risk of breast cancer by strata of intakes of vitamin B 6 and/or vitamin B 12 . Two studies ( 26 , 37 ) found that folate intake was statistically significantly inversely associated with breast cancer risk among women with high vitamin B 12 intake but not among those with low vitamin B 12 intake; the test for interaction between intakes of folate and vitamin B 12 was statistically significant in one of these studies ( Pinteraction <.001) ( 37 ) but not in the other ( Pinteraction = .28) ( 26 ). No statistically significant interaction was observed between folate and vitamin B 6 intake in relation to breast cancer risk ( 12 , 25 ).
Discussion
In this meta-analysis, we found no clear support for an overall relationship between folate intake or blood folate levels and breast cancer risk. We also found that there were discrepancies between the summary results of prospective and case–control studies regarding the association between dietary folate intake and breast cancer risk. Although summary results of prospective studies did not support an overall association between dietary folate intake and risk of breast cancer, those of case–control studies indicated that an increase of 200 μg/day in dietary folate intake was associated with a statistically significant 20% lower risk of breast cancer. The two types of studies are in agreement in not finding a statistically significant association of total folate intake or blood folate levels with breast cancer risk, but there was heterogeneity among studies within each study design. Findings from two prospective studies and two case–control studies indicated that high folate intake might be associated with a reduced risk of breast cancer in women with moderate or high consumption of alcohol. Likewise, results from four of five prospective studies indicated that adequate folate intake may attenuate the increased risk of breast cancer associated with alcohol consumption. The few studies that have investigated whether the relationship between folate intake and breast cancer risk is modified by intakes of methionine or vitamins B 6 and B 12 have yielded inconclusive results.
As a meta-analysis of observational studies, our findings have several limitations. First, this type of meta-analysis is susceptible to potential bias inherent in the original studies. The reason for the disparate results from prospective and case–control studies on the association of dietary folate intake with breast cancer risk is unclear. However, it is possible that the inverse associations reported from the case–control studies may have been overstated because of recall or interviewer bias and, possibly, because early symptoms in patients may have resulted in a change in dietary habits. Furthermore, selection bias is a problem in the studies with low response rates among control subjects ( 27 – 29 , 34 , 36 ) because those who agree to participate are likely to be more health conscious and, therefore, may consume more folate-rich foods (e.g., fruits, vegetables, and whole-grain cereals) than those who do not participate. Nevertheless, we did not detect any appreciable difference between summary results from case–control studies with low versus high response rates among control subjects.
Second, a meta-analysis is not able to solve problems with confounding factors that could be inherent in the included studies. Inadequate control for confounders may bias the results in either direction, toward exaggeration or underestimation of risk estimates. However, most studies in this meta-analysis adjusted for other known and potential risk factors for breast cancer.
Third, heterogeneity may be introduced because of methodologic differences among studies, including different exposure levels for the lowest and highest folate intake category, range of exposure, and dietary assessment methods. If only very low folate intakes are related to increased risk of breast cancer, no association between folate intake and breast cancer would be expected in studies in which the population being studied has an adequate folate intake. The estimated intakes of folate that are based on different questionnaires and different nutrient databases may not be comparable. Dietary intake was assessed with a self-administered food-frequency questionnaire in all prospective studies, whereas interviewer-administered questionnaires were used in 11 of the 14 case–control studies. Using an interviewer to administer a questionnaire may reduce error by increasing the subjects' participation and motivating them to respond more accurately. However, interviewers may also introduce error if they affect the subjects' responses. The difference in risk estimates from prospective and case–control studies could theoretically be related to different extent of errors in the measurement of folate intake and confounders. In a multivariable model with more than one variable measured with error, correlation between variables and their errors could bias the results in either direction.
Fourth, only two ( 11 , 20 ) of the eight prospective studies updated the information about diet during follow-up. Misclassification of folate intake may have been introduced in the six prospective studies ( 12 – 16 , 25 ) that assessed dietary intake at baseline only, which could lead to an underestimation of the risk estimates. Since 1998, flour and cereal-grain products in the United States have been fortified with folic acid. This could have introduced misclassification of long-term folate intake in the US studies that covered both pre- and postfortification periods ( 16 , 20 ).
Finally, inherent in any review process of published studies is the possibility of publication bias. In this meta-analysis, we found no evidence of substantial publication bias.
An increased risk of breast cancer associated with moderate alcohol consumption has been consistently observed in epidemiologic studies ( 2 – 4 ). Elevated estrogen and androgen concentrations in women who drink alcohol have been suggested as the most likely mechanisms underlying the relation between alcohol intake and breast cancer risk ( 3 ). The effect of high alcohol consumption on breast cancer risk may also partly be related to the negative influence of alcohol on folate absorption and metabolism ( 9 , 10 ).
In addition to alcohol consumption, functional polymorphisms in genes encoding folate-metabolizing enzymes may modify the relation between folate and risk of breast cancer. Methylenetetrahydrofolate reductase (MTHFR) is a central enzyme in one-carbon metabolism. A recent meta-analysis ( 43 ) showed no overall association between two functional polymorphisms of the MTHFR (C677T and A1298C) gene and breast cancer risk; however, the 677TT (variant) genotype, compared with the CC genotype, was associated with a statistically significant increased risk of breast cancer among premenopausal women, but this finding was based on only five studies ( 43 ). Of three studies that have investigated the potential interaction between folate and the MTHFR C677T polymorphism in relation to breast cancer risk ( 36 , 44 , 45 ), two found that the increase in breast cancer risk associated with low folate intake was stronger among women with the 677TT genotype ( 44 , 45 ).
Two prospective studies have examined folate intake in relation to breast cancer risk according to estrogen receptor (ER) status of the tumor ( 46 , 47 ). In the Nurses' Health Study, high total folate intake was associated with a statistically significantly reduced risk of developing ER-negative, but not ER-positive, breast cancer ( 47 ). The inverse association between folate intake and ER-negative breast cancer was primarily present among women who consumed alcohol at 15 g/day or more. In the Iowa Women's Health Study ( 46 ), there was no overall association of dietary or total folate intake with ER-negative or ER-positive breast cancer, but there was a statistically significant increased risk of ER-negative tumors among women who had a low total folate intake and high alcohol consumption.
Although most epidemiologic studies included in this meta-analysis have reported either an inverse or no association between dietary folate intake or blood folate levels and breast cancer risk, one prospective study found a statistically significant increased risk of breast cancer of approximately 30% associated with high total folate intake (from foods and supplements) ( 16 ). In a study of women involved in a trial of folic acid supplementation in pregnancy with more than 30 years of follow-up ( 48 ), women who had been randomly assigned to the highest folic acid dose (5 mg/day) had a nonstatistically significant twofold elevated risk of breast cancer (RR = 2.02, 95% CI = 0.88 to 4.72) compared with women in the placebo group. Moreover, studies in rodents have demonstrated that mild dietary folate deficiency suppresses chemically induced mammary cancer ( 49 – 51 ).
In summary, findings from this meta-analysis show an inverse association between dietary folate intake and risk of breast cancer in case–control studies but no association in prospective studies. Nevertheless, there was evidence from prospective studies that adequate folate intake may attenuate the increased risk of breast cancer associated with alcohol consumption. Large prospective studies that investigate interactions between folate and other nutrients involved in one-carbon metabolism, alcohol consumption, and functional polymorphisms in genes encoding folate-metabolizing enzymes are needed to further clarify the role of folate in breast cancer etiology. Future studies should also examine whether the relation between folate and breast cancer risk varies according to the ER status of the tumor.
This study was supported by research grants from the Swedish Cancer Society and the Swedish Research Council/Longitudinal Studies. The study sponsors had no role in the design, collection, analysis, or interpretation of the data or in the writing or decision to submit the manuscript.
References
Parkin DM, Bray F, Ferlay J, Pisani P. Global cancer statistics, 2002.
Smith-Warner SA, Spiegelman D, Yaun SS, van den Brandt PA, Folsom AR, Goldbohm RA, et al. Alcohol and breast cancer in women: a pooled analysis of cohort studies.
Singletary KW, Gapstur SM. Alcohol and breast cancer: review of epidemiologic and experimental evidence and potential mechanisms.
Key J, Hodgson S, Omar RZ, Jensen TK, Thompson SG, Boobis AR, et al. Meta-analysis of studies of alcohol and breast cancer with consideration of the methodological issues.
Kim YI. Folate and carcinogenesis: evidence, mechanisms, and implications.
Prinz-Langenohl R, Fohr I, Pietrzik K. Beneficial role for folate in the prevention of colorectal and breast cancer.
Larsson SC, Giovannucci E, Wolk A. Folate intake, MTHFR polymorphisms, and risk of esophageal, gastric, and pancreatic cancer: a meta-analysis.
Choi SW, Mason JB. Folate status: effects on pathways of colorectal carcinogenesis.
Hillman RS, Steinberg SE. The effects of alcohol on folate metabolism.
Halsted CH, Villanueva JA, Devlin AM, Chandler CJ. Metabolic interactions of alcohol and folate.
Zhang S, Hunter DJ, Hankinson SE, Giovannucci EL, Rosner BA, Colditz GA, et al. A prospective study of folate intake and the risk of breast cancer.
Rohan TE, Jain MG, Howe GR, Miller AB. Dietary folate consumption and breast cancer risk.
Sellers TA, Kushi LH, Cerhan JR, Vierkant RA, Gapstur SM, Vachon CM, et al. Dietary folate intake, alcohol, and risk of breast cancer in a prospective study of postmenopausal women.
Baglietto L, English DR, Gertig DM, Hopper JL, Giles GG. Does dietary folate intake modify effect of alcohol consumption on breast cancer risk? Prospective cohort study.
Tjønneland A, Christensen J, Olsen A, Stripp C, Nissen SB, Overvad K, et al. Folate intake, alcohol and risk of breast cancer among postmenopausal women in Denmark.
Stolzenberg-Solomon RZ, Chang SC, Leitzmann MF, Johnson KA, Johnson C, Buys SS, et al. Folate intake, alcohol use, and postmenopausal breast cancer risk in the Prostate, Lung, Colorectal, and Ovarian Cancer Screening Trial.
DerSimonian R, Laird N. Meta-analysis in clinical trials.
Greenland S, Longnecker MP. Methods for trend estimation from summarized dose-response data, with applications to meta-analysis.
Orsini N, Bellocco R, Greenland S. Generalized least squares for trend estimation of summarized dose-response data.
Cho E, Spiegelman D, Hunter DJ, Chen WY, Zhang SM, Colditz GA, et al. Premenopausal intakes of vitamins A, C, and E, folate, and carotenoids, and risk of breast cancer.
Levi F, Pasche C, Lucchini F, La Vecchia C. Dietary intake of selected micronutrients and breast-cancer risk.
Zhu K, Davidson NE, Hunter S, Yang X, Payne-Wilks K, Roland CL, et al. Methyl-group dietary intake and risk of breast cancer among African-American women: a case-control study by methylation status of the estrogen receptor alpha genes.
Higgins JP, Thompson SG. Quantifying heterogeneity in a meta-analysis.
Egger M, Davey Smith G, Schneider M, Minder C. Bias in meta-analysis detected by a simple, graphical test.
Feigelson HS, Jonas CR, Robertson AS, McCullough ML, Thun MJ, Calle EE. Alcohol, folate, methionine, and risk of incident breast cancer in the American Cancer Society Cancer Prevention Study II Nutrition Cohort.
Lajous M, Romieu I, Sabia S, Boutron-Ruault MC, Clavel-Chapelon F. Folate, vitamin B12 and postmenopausal breast cancer in a prospective study of French women.
Graham S, Hellmann R, Marshall J, Freudenheim J, Vena J, Swanson M, et al. Nutritional epidemiology of postmenopausal breast cancer in western New York.
Freudenheim JL, Marshall JR, Vena JE, Laughlin R, Brasure JR, Swanson MK, et al. Premenopausal breast cancer risk and intake of vegetables, fruits, and related nutrients.
Thorand B, Kohlmeier L, Simonsen N, Croghan C, Thamm M. Intake of fruits, vegetables, folic acid and related nutrients and risk of breast cancer in postmenopausal women.
Potischman N, Swanson CA, Coates RJ, Gammon MD, Brogan DR, Curtin J, et al. Intake of food groups and associated micronutrients in relation to risk of early-stage breast cancer.
Ronco A, De Stefani E, Boffetta P, Deneo-Pellegrini H, Mendilaharsu M, Leborgne F. Vegetables, fruits, and related nutrients and risk of breast cancer: a case-control study in Uruguay.
Negri E, La Vecchia C, Franceschi S. Re: dietary folate consumption and breast cancer risk.
Shrubsole MJ, Jin F, Dai Q, Shu XO, Potter JD, Hebert JR, et al. Dietary folate intake and breast cancer risk: results from the Shanghai Breast Cancer Study.
Sharp L, Little J, Schofield AC, Pavlidou E, Cotton SC, Miedzybrodzka Z, et al. Folate and breast cancer: the role of polymorphisms in methylenetetrahydrofolate reductase (MTHFR).
Adzersen KH, Jess P, Freivogel KW, Gerhard I, Bastert G. Raw and cooked vegetables, fruits, selected micronutrients, and breast cancer risk: a case-control study in Germany.
Chen J, Gammon MD, Chan W, Palomeque C, Wetmur JG, Kabat GC, et al. One-carbon metabolism, MTHFR polymorphisms, and risk of breast cancer.
Lajous M, Lazcano-Ponce E, Hernandez-Avila M, Willett W, Romieu I. Folate, vitamin B(6), and vitamin B(12) intake and the risk of breast cancer among Mexican women.
Chou YC, Lee MS, Wu MH, Shih HL, Yang T, Yu CP, et al. Plasma homocysteine as a metabolic risk factor for breast cancer: findings from a case-control study in Taiwan.
Wu K, Helzlsouer KJ, Comstock GW, Hoffman SC, Nadeau MR, Selhub J. A prospective study on folate, B12, and pyridoxal 5′-phosphate (B6) and breast cancer.
Zhang SM, Willett WC, Selhub J, Hunter DJ, Giovannucci EL, Holmes MD, et al. Plasma folate, vitamin B6, vitamin B12, homocysteine, and risk of breast cancer.
Rossi E, Hung J, Beilby JP, Knuiman MW, Divitini ML, Bartholomew H. Folate levels and cancer morbidity and mortality: prospective cohort study from Busselton, Western Australia.
Beilby J, Ingram D, Hahnel R, Rossi E. Reduced breast cancer risk with increasing serum folate in a case-control study of the C677T genotype of the methylenetetrahydrofolate reductase gene.
Zintzaras E. Methylenetetrahydrofolate reductase gene and susceptibility to breast cancer: a meta-analysis.
Shrubsole MJ, Gao YT, Cai Q, Shu XO, Dai Q, Hebert JR, et al. MTHFR polymorphisms, dietary folate intake, and breast cancer risk: results from the Shanghai Breast Cancer Study.
Le Marchand L, Haiman CA, Wilkens LR, Kolonel LN, Henderson BE. MTHFR polymorphisms, diet, HRT, and breast cancer risk: the multiethnic cohort study.
Sellers TA, Vierkant RA, Cerhan JR, Gapstur SM, Vachon CM, Olson JE, et al. Interaction of dietary folate intake, alcohol, and risk of hormone receptor-defined breast cancer in a prospective study of postmenopausal women.
Zhang SM, Hankinson SE, Hunter DJ, Giovannucci EL, Colditz GA, Willett WC. Folate intake and risk of breast cancer characterized by hormone receptor status.
Charles D, Ness AR, Campbell D, Davey Smith G, Hall MH. Taking folate in pregnancy and risk of maternal breast cancer.
Kotsopoulos J, Medline A, Renlund R, Sohn KJ, Martin R, Hwang SW, et al. Effects of dietary folate on the development and progression of mammary tumors in rats.
Kotsopoulos J, Sohn KJ, Martin R, Choi M, Renlund R, McKerlie C, et al. Dietary folate deficiency suppresses N-methyl-N-nitrosourea-induced mammary tumorigenesis in rats.

