


ABSTRACT
This study proposes a quality assurance (QA) method incorporating radiobiological factors based on the QUANTEC-determined tumor control probability and the normal tissue complication probability (NTCP) of head-and-neck intensity-modulated radiation therapy (HN-IMRT). Per-beam measurements were conducted for 20 cases using a 2D detector array. Three-dimensional predicted dose distributions within targets and organs at risk were reconstructed based on the per-beam QA results derived from differences between planned and measured doses. Under the predicted dose distributions, the differences between the physical and radiobiological gamma indices (PGI and RGI, respectively) based on the relative seriality (RS) model were evaluated. The NTCP values in the RS and Niemierko models were compared. The dose covers 98% (D98%) of the clinical target volume (CTV) decreased by 3.2% (P < 0.001), and the mean dose of the ipsilateral parotid increased by 6.3% (P < 0.001) compared with the original dose. RGI passing rates in the CTV and brain stem were greater than PGI ones by 5.8% (P < 0.001) and 2.0% (P < 0.001), respectively. The RS model’s average NTCP values for the ipsilateral and contralateral parotids under the original dose were smaller than those of the Niemierko model by 9.0% (P < 0.001) and 7.0% (P < 0.001), respectively. The 3D predicted dose evaluation with RGI based on the RS model was introduced for QA of HN-IMRT, leading to dose evaluation for each organ with consideration of the radiobiological effect. This method constitutes a rational way to perform QA of HN-IMRT in clinical practice.
INTRODUCTION
Intensity-modulated radiation therapy (IMRT) allows for the delivery of high doses of radiation to targets with steep dose gradients while minimizing doses to organs at risk (OARs). IMRT for head-and-neck (HN) cancer patients contributes to reducing toxicity without compromising target dose coverage [1]. Treatment plans for this therapy have become very complex in order to achieve appropriate dose constraints.
To evaluate whether such complex irradiation schemes deliver the correct doses to patients, patient-specific quality assurance (QA) should be performed. The QA results are evaluated using physical gamma analysis [2]; a dose difference of 3% and a distance to agreement of 3 mm (3%/3 mm) constitute the commonly adopted criteria for an acceptable passing rate [3, 4].
However, several groups have demonstrated that the gamma passing rate does not always reflect the clinically relevant dose to the targets and/or OARs. Nelms et al. demonstrated that even with high gamma passing rates in a 2D measurement (i.e. 95%), clinically unacceptable differences were observed between planned and measured doses to the targets and OARs, suggesting the need to evaluate the organ doses predicted based on the QA results [5]. Several other groups have also proposed methods for predicting 3D doses from the measurement results; these techniques are collectively known as the measurement-guided dose-reconstruction (MGDR) approach [6–8]. This approach implies that there is significant error in the predicted dose distribution when it is evaluated with respect to each organ. Thus, QA of the delivered dose distribution is very important. A recent survey of IMRT QA further showed that there were substantial variations in reactions to situations that fail to meet acceptance criteria. For example, ~50% of institutions change their plan, if necessary, and ~40% of institutions change their criteria to obtain a higher passing rate [4]. The QA evaluation methods and their reactions are based only on physical terms and do not consider radiobiological terms such as tumor control probability (TCP) and normal tissue complication probability (NTCP). These problems imply that radiobiological considerations should be introduced to IMRT QA in order to evaluate its results [9, 10].
Here, we propose a new method for evaluating IMRT QA results, which introduces radiobiological parameters based on the most up-to-date clinical data; this method is known as quantitative analysis of normal tissue effects in the clinic (QUANTEC) [11], and it uses the relative seriality (RS) model [12, 13] as a radiobiological gamma index (RGI) [9]. To introduce TCP to RGI, Sumida et al. defined the weight factor n, which increased when the predicted dose was both larger and smaller than the actual dose [9]. TCP was clearly improved by the increase in dose. In this research, therefore, the definition of n is renewed based on the concept of TCP. In addition, we show the feasibility of our method for head-and-neck intensity-modulated radiation therapy (HN-IMRT) treatment plans, which include both serial organs and parallel organs near the target.
MATERIALS AND METHODS
Per-beam QA was performed using a 2D diode array (MapCHECK, Sun Nuclear Corporation, Melbourne, FL). Then, the 3D predicted dose distribution (defined as predicted dose) was reconstructed based on the results of difference between 2D measured dose distribution and 2D planned dose distribution described in the following section. The 3D gamma analysis [14] was conducted, and the TCP, NTCP and dose–volume histogram (DVH) parameters for targets and OARs were evaluated. Figure 1 indicates the process of dose prediction and evaluation.
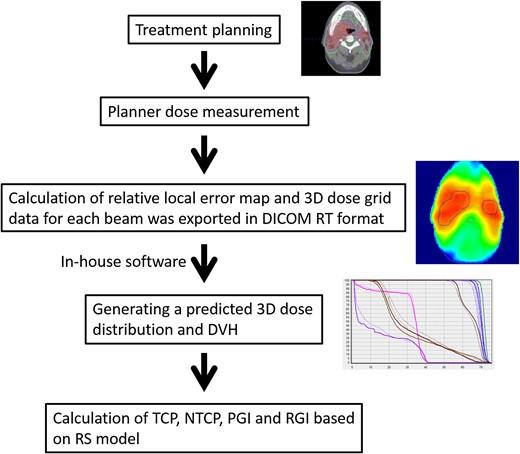
Process of dose prediction and evaluation.
Treatment planning
Twenty HN-IMRT treatment plans were made using the XiO treatment-planning system (TPS; Elekta, Stockholm AB, Sweden). Flattening filter-free (FFF) 7-MV X-ray beams from the ARTISTE linear accelerator (Siemens Medical Systems, Concord, CA) equipped with a 160 multileaf collimator (MLC) with leaves 5-mm wide were used. Fixed gantry step-and-shoot IMRT was used for beam delivery. Targets and OARs (including brain stem, spinal cord and parotid glands) were contoured. The prescribed doses were 70 Gy/35 fractions (fx) for the high-risk planning target volume (PTV), 63 Gy/35 fx for the intermediate-risk PTV and 54 Gy/35 fx for the low-risk PTV (using the simultaneous integrated boost (SIB) method). A convolution/superposition algorithm with a 2.0-mm grid resolution was used for dose calculation. Dose constraints for the targets and OARs were set as follows:
The dose received for 1% volume of the high-risk PTV (D1%) was <75 Gy.
The maximum doses for brain stem and spinal cord were <54 Gy and <45 Gy, respectively.
The percentage volume receiving 26 Gy (V26Gy) for parotids was <50%.
These constraints were determined based on the literature [11].
The 3D predicted dose reconstruction and evaluation
The 3D predicted dose distributions were reconstructed as indicated by Sumida et al. [8]. To summarize, the planned dose (defined as original dose) distribution in the coronal plane was exported with a 1-mm grid resolution. The 2D measurements using a 2D diode array were conducted for individual beams at a gantry angle of 0° with a 5-mm grid resolution, as described in [15]. Then, comparisons of the measured and original doses were evaluated by gamma analysis with 3% global/3 mm criteria, and the relative local error maps with a 5-mm grid resolution were calculated using in-house software for each beam. Then, the 3D dose grid data for each beam were exported with DICOM-RT format. The ray from the source to each dose grid was defined, and the intersection point on the relative local error map located in the isocentral plane was calculated. The intersection point was calculated by 2D linear interpolation. The relative error was applied to each dose grid along the ray. Thus, the 3D predicted dose distribution was reconstructed. Figure 2 shows representative distributions of the original dose, the predicted dose, and the difference between the two.
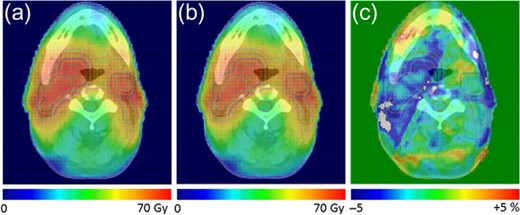
Dose distributions of a representative case. (a) Original dose distribution; (b) predicted dose distribution; and (c) the difference between the original and predicted doses.
where is the original or predicted dose of the i-th voxel, is the dose required to obtain 50% TCP and is the normalized tumor dose–response slope at [16].
Biological parameters used to calculate TCP and NTCP
| Organ | Niemierko RS | a | s | TCD50/TD50 (Gy) D50 (Gy) | γ | Endpoint | Reference |
|---|---|---|---|---|---|---|---|
| GTV | −13 | 63.43 | 2.66 | [21] | |||
| CTV | –13 | 50.44 | 1.83 | [21] | |||
| PTV | −13 | 50.44 | 1.83 | ||||
| Spinal cord | 7.4 | 66.50 | 4 | Myelitis | [20] | ||
| 4 | 68.60 | 1.9 | [22] | ||||
| Brain stem | 7.0 | 65.00 | 3 | Necrosis | [20] | ||
| 1 | 65.10 | 2.4 | [22] | ||||
| Ipsilateral parotid | 2.2 | 28.40 | 1 | Xerostomia | [20] | ||
| 0.01 | 26.30 | 0.73 | [17] | ||||
| Contralateral parotid | 2.2 | 28.40 | 1 | Xerostomia | [20] | ||
| 0.01 | 26.30 | 0.73 | [17] | ||||
In this research, the TCP tolerance value was determined from the average TCP value of the 20 treatment plans approved, and was observed to be 0.77. The NTCP tolerance values were set to 0.05 based on a TD5/5 concept (where TD5/5 is the probability of a 5% complication within 5 years of treatment) [23, 24]. However, these TCP and NTCP tolerance values could be changed in accordance with a physician’s treatment policy.
Statistical analysis
For the statistical analysis, the normality of data was verified by the Shapiro–Wilk test followed by the two-tailed paired t-test or the Wilcoxon signed rank test in response to the results of the normality check. For the correlation analysis, Pearson’s or Spearman’s correlation coefficient was calculated on the basis of the results of normality test. The boundary value for judging whether there was significant difference was set to 5.0% (0.05). JMP ver. 12 (SAS, Cary, NC, USA) was used as the software for performing this statistical analysis.
RESULTS
DVH based on the predicted dose and each parameter
The 3D predicted dose distributions in targets and OARs were reconstructed from the measurement results. Figure 3a shows the DVH curves of the original (solid line) and predicted (dashed line) doses for a representative patient. In this case, large differences were observed between the original and predicted doses in the PTV (~70 Gy) and in both parotids (a volume of ~50%), although there was almost no difference in GTV. Figure 3b, c and d show the difference (between predicted data and original data) for each parameter in various ranges of P. All mean differences of the DVH parameters in both the GTV and CTV were below zero. The difference of D98% (the near-minimum absorbed dose [25], and Dxx% means the dose covering a volume of xx%) values in GTV, CTV and PTV were approximately −1.3 Gy (range: −2.6 Gy to −0.3 Gy), −2.1 Gy (range: −3.2 Gy to −1.0 Gy) and −2.4 Gy (range: −4.6 Gy to −1.3 Gy) on average, respectively. In particular, the differences of the mean doses in both parotids varied widely; they were approximately 2.0 Gy (range: −1.9 to 5.4 Gy) and 1.6 Gy (range: −0.2 to 4.9 Gy) on an average in the ipsilateral and contralateral parotids, respectively. Moreover, the difference of the D2% (the near-maximum absorbed dose [25]) value in the brain stem was approximately −1.2 Gy on average (range: from −4.4 to 2.5 Gy). Consequently, almost all parameters other than the D2% value of the spinal cord exhibited significant differences.
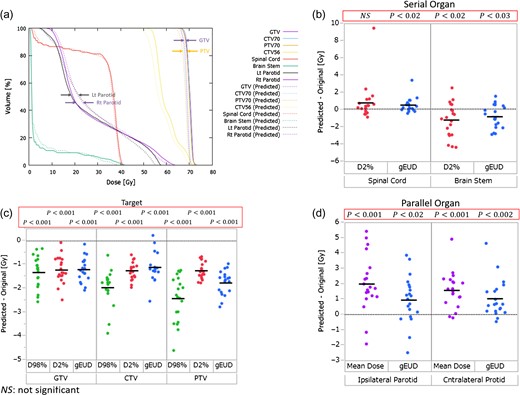
(a) DVH curves of the original and predicted doses for a representative patient. The solid lines denote the DVHs of the original doses, and dashed lines denote the DVHs of the predicted doses. (b), (c) and (d) The difference (subtracting predicted from original) of each parameter in various ranges of P. The black crossbars show the mean values of each dataset.
Comparison of PGI and RGI
Figure 4a and b show correlations between the PGI and RGI passing rates for targets and OARs, respectively. The line y = x corresponds to the situation where the PGI passing rate is equal to the RGI passing rate. Figure 4c and d show the differences between the RGI and PGI passing rates, and Fig. 4e and f show the results of correlation analysis between the RGI passing rates and D2% of the spinal cord and brain stem, respectively.
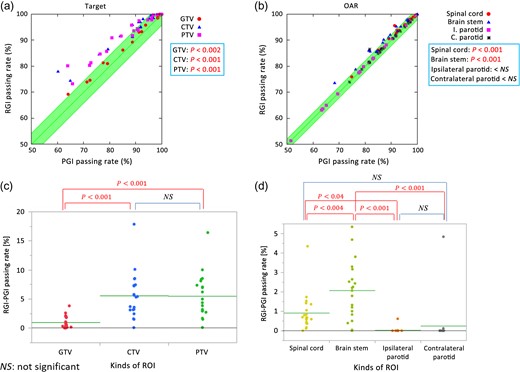
(a), (b) Correlations between PGI and RGI passing rates for targets and OARs. I. Parotid = ipsilateral parotid and C. Parotid = contralateral parotid. (c), (d) RGI – PGI passing rate subtractions. The green crossbars show the means of each dataset. (e), (f) The results of correlation analysis between RGI passing rates and D2% of spinal cord and brain stem, respectively.
As shown in Fig. 4a and c, the RGI passing rates were greater than the PGI passing rates for the CTV and the PTV for almost all cases, implying that the predicted doses for the CTV and the PTV were >95% of the prescribed doses. Although the RGI passing rates were also greater than the PGI passing rates in the GTV for almost all cases, the differences were as small as 1% or lower in many cases. Figure 4b and d show that the RGI passing rates of the spinal cord and the brain stem were also greater than the corresponding PGI passing rates in almost all cases. In contrast, small differences were observed between the PGI and RGI passing rates in the ipsilateral and contralateral parotids, with average mean doses of 32 Gy and 28 Gy, respectively. These values exceeded D50 = 26.3 Gy (Table 1) in the parotids, which was the dose at which became 0.5.
Figure 4c and d show the results of statistical analysis for the passing rate difference (given by RGI passing rate minus PGI passing rate). Because the PGI passing rate in the GTV was higher than that in the CTV and the PTV, the difference between the PGI and the RGI passing rates for the GTV was small. The predicted dose to the brain stem was lower than the tolerance dose of 50.5 Gy; this value was calculated from the value, which was equal to the tolerated NTCP of 0.05, unlike the doses to the parotids. A similar observation can be made about the spinal cord as well. Thus, the difference between the PGI and the RGI passing rates in the brain stem and spinal cord were larger those in the parotids.
As indicated in Fig. 4e and f, a significant negative correlation was found between the RGI passing rate and D2% of the spinal cord (P < 0.001), whereas a low negative correlation was found between the RGI passing rate and D2% of the brain stem.
NTCP comparison between the RS and Niemierko models
For OARs, the NTCP value was calculated based on both the RS and Niemierko models (Fig. 5). Although the difference due to model variation in the original dose of the spinal cord was statistically significant, the actual NTCP variation was within 0.0002 (0.02%, Fig. 5a). Regarding the brain stem, there was no significant difference between the models shown in Fig. 5.
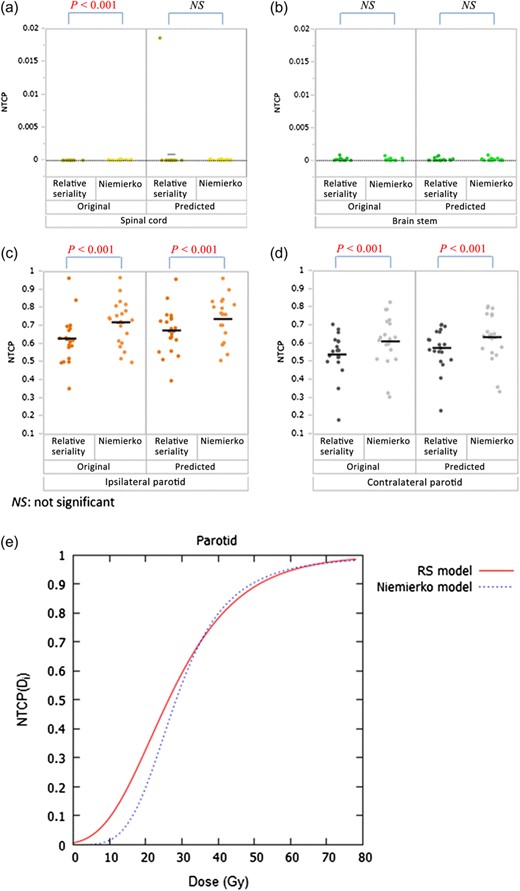
(a)–(d) NTCP results based on both the RS and Niemierko models. The black crossbars show the means of each dataset. (e) The curves of the parotids, calculated using both models.
In contrast, large NTCP differences due to model variation were observed in the ipsilateral and contralateral parotids. The average NTCP differences in the original dose were approximately 0.09 (9.0%) and 0.07 (7.0%) for the ipsilateral and contralateral parotids, respectively (Fig. 5c and d). Maximum NTCP differences in the original dose were 0.17 (17%) and 0.15 (15%) for the ipsilateral and contralateral parotids, respectively.
Figure 5e shows the calculated results of the parotid based on the RS and Niemierko models. As representative values, were calculated for certain doses, , including the original mean doses, original gEUDs, and 26 Gy, which was used as a constraint at planning (V26Gy < 50%), for the ipsilateral and contralateral parotids. The values calculated by different models are listed on Table 2. For the mean dose in the contralateral parotid, the value of the RS model was greater than that of the Niemierko model by ~10%.
calculation results for the ipsilateral and contralateral parotids subjected to original mean dose, original gEUD and 26 Gy
| Tissue | Dosimetric parameter | [Gy] | Model | |
|---|---|---|---|---|
| Ipsilateral parotid | Average of original mean dose | 32.3 | RS | 0.644 |
| Niemierko | 0.626 | |||
| Average of original gEUD | 37.0 | RS | 0.734 | |
| Niemierko | 0.742 | |||
| Contralateral parotid | Average of original mean dose | 28.5 | RS | 0.556 |
| Niemierko | 0.504 | |||
| Average of original gEUD | 31.9 | RS | 0.635 | |
| Niemierko | 0.614 | |||
| Parotid | Constraint on planning | 26.0 | RS | 0.492 |
| Niemierko | 0.413 |
DISCUSSION
We developed and implemented a new biologically based QA evaluation method for HN-IMRT cases based on TCP and NTCP derived from QUANTEC data using the RS model. First, we demonstrated that 2D planar QA results did not always reflect organ-dose errors, as has already been proved by Nelms et al. [5]. Figure 3a shows an example of how the predicted DVH can be significantly different from original DVH even if all 2D planar QA results are below the tolerance. Second, we proposed RGI by introducing the NTCP based on an RS model to PGI; RGI was used to evaluate the 3D predicted dose. The RGI passing rates in both targets and serial organs were observed to be greater than the PGI passing rates; this suggests that our method, which considers radiobiological factors, provides more appropriate reactions when the physical results of HN-IMRT QA exceed the criteria.
Recently, several groups have suggested methods of evaluating IMRT QA results through radiobiological as well as physical considerations [9, 10]. Sumida et al. proposed a method that introduced radiobiological effects by means of TCP and NTCP based on the application of the Niemierko model to physical gamma analysis [9]. Although their methods are conceptually useful for IMRT QA evaluation, the parameters in the Niemierko model, as shown in Table 2, were derived from a report by Emami et al. published in 1991 [24]. Because of the recent developments in radiation therapy, including 3D conformal radiotherapy and a sophisticated dose-calculation algorithm, the data of Emami et al. is not always applicable. Recently, an alternative NTCP dataset based on 3D dose–volume information for various organs has been made available (QUANTEC) [26]. Stathakis et al. suggested a new index called gamma plus (by introducing radiobiological information to the gamma index) and applied it to a lung cancer IMRT [10]. In this method, the radiobiological effect was based on the RS model, which was based on QUANTEC, and the planar dose distributions were evaluated using the biologically effective uniform dose. This method also had the advantage of having a high spatial resolution of measurement because of the use of film. However, the evaluation using this method stayed the 2D dose evaluation with calculating dose–area histograms [27] derived from the information of contours from the TPS was imported and was overlaid on the film. Since the evaluation approach of that method was limited in the 2D evaluation, it was difficult to verify the dose distribution accurately where both targets and OARs were complicated in 3D. Especially for HN-IMRT, many OARs are present in the neighborhood of the target; therefore, evaluation of the 3D dose, including the biological effect, was considered important. In the present study, we used the RS model to obtain NTCP for the OARs for the calculation of RGI, and the 3D dose evaluation was performed along with it. To the best of our knowledge, this is the first report that has demonstrated the usefulness of evaluating the HN-IMRT QA method incorporating an RS model–based NTCP.
We calculated the NTCPs for OARs using both models. In the spinal cord and brain stem, the NTCPs were barely affected owing to the differences between the models (Fig. 5a and b). Because their dose constraints were satisfied regardless of the introduction of dose errors, there was relatively little NTCP difference due to variation of the models. In contrast, NTCP differences between the two models were observed to be >15% in the parotids (Fig. 5c and d). This finding is consistent with the report of Zhao et al., which held that the NTCP for the parotids changed by ~3% owing to differences between the NTCP calculation models [28]. As shown in Fig. 5e, the parotid curves based on the RS and Niemierko models differed significantly. When the results shown in Table 2 were examined, the NTCP of the contralateral parotid calculated by the RS model was predicted to become worse than that calculated by the Niemierko model. However, the NTCP of the contralateral parotid calculated using the RS model seemed to become better than that calculated by the Niemierko model, as shown in Fig. 5d. This is because the RS model introduces the seriality of organs, and the methods for considering the volume effect for parallel organs were differed between the models: the RS model considers the volume effect with a voxel base as noted in Equation (8), whereas the Niemierko model considers it using gEUD and calculates NTCP of a whole organ. These results suggest that the introduction of the RS model allows for organ characteristics to be considered for correct evaluation of the NTCP, leading to a more appropriate IMRT QA evaluation than that obtained by the Niemierko model.
Finally, we investigated the feasibility of our method. Our data revealed that the 3D gamma passing rates changed significantly for the target and serial organs, as shown in Fig. 4a–d. In the GTV, the RGI passing rate was not significantly different from that of the PGI. By considering set-up error, the margin for the CTV was set; the GTV is located on the inside of CTV. A previous study revealed that a 10-mm margin reduces TCP loss by <1%, even if the rotation error has been contained [29]. Thus, the dose distribution in the GTV was relatively insensitive to the delivered dose error compared with in the CTV, and the PGI passing rates in the GTV were higher than those in the CTV in almost all cases. Consequently, the differences in the TCP were small, and the differences between the PGI and the RGI passing rates were small. In the CTV and the PTV, the RGI passing rates became higher than the PGI passing rates in almost all cases, indicating that the required doses for these structures, >95% of the prescribed dose, were ensured for many of their voxels, even when the predicted dose was significantly different from the original dose. Concerning the spinal cord and brain stem, the RGI passing rate also became higher than the PGI passing rate in almost all cases, indicating that dose errors in the brain stem were almost always below the tolerance, and that the dose to the spinal cord satisfied its tolerance despite the presence or absence of dose errors. In contrast, small differences were observed between the PGI and RGI passing rates in the ipsilateral and contralateral parotids, with average mean doses of 32 Gy and 28 Gy, respectively. These values are almost equal to those obtained at other institutions [9, 30], and exceed D50 = 26.3 Gy (Table 1) in the parotids, which is the dose at which becomes 0.5. Therefore, it is likely that most of the cases exceeded the tolerance dose of the parotids, and there was almost no difference between the PGI and RGI passing rates. In addition, as shown in Fig. 4e, a significant negative correlation (P < 0.001) was found between the RGI passing rate and D2% of the spinal cord. Therefore, it was suggested that the method using the RGI passing rate can provide superior evaluation. However, as indicated by Fig. 4f, a weak negative correlation was found between the RGI passing rate and D2% of the brain stem. One of the reasons considered for this was that the PRV was set to the brain stem in our planning, and it was reported that the use of the PRV could limit the volume of the normal tissue that exceeded the tolerance dose, even if there were a few millimeters of allowable set-up error [31]. Thus, for more accurate evaluation, the RGI values are required for providing increased sensitivity.
To address the limitations of the research, MapCHECK, which has low spatial detector resolution (especially for regions outside of a cm2 field), was used for measurement, and the 3D predicted dose was generated on the basis of the measurement data. The dose distributions of the region where the dose gradients were steep may not be accurately measured because of the low detector resolution; therefore, the 3D predicted dose distribution may not be accurately generated. Vance et al. [32] indicated that there was no substantial difference between standard resolution and high resolution DVH-based QA metrics for all ROIs and that the high resolution measurement using MapCHECK 2 is recommended for small targets (i.e. PTV < 5 cm3); the high resolution was generated by doubling the detector density. For a case where the error between the original and the predicted dose was not acceptable, the maximum predicted dose for the spinal cord exceeded 50 Gy, though the 2D planar QA result of each beam achieved the tolerance in gamma analysis. Thus, doubling the detector density technique with MapCHECK or detectors with higher spatial resolution as electronic portal imaging devices (EPID) are needed for more accurate dose predictions and evaluations in HN-IMRT QA.
In conclusion, we proposed a new method for HN-IMRT QA using the RS model considering radiobiological terms. The predicted dose was changed from the original dose, and the evaluation was changed significantly by the introduction of radiobiological effects. Differences in NTCP arising from the variation of the models were also indicated. Our results suggest the feasibility and usefulness of RGI based on the RS model for evaluating the QA results of HN-IMRT in a rational way.
FUNDING
There was no fund to do this research.
CONFLICT OF INTEREST
The authors state that there are no conflicts of interest.
REFERENCES
