


Abstract
Tumor suppressor genes (TSGs) are guardian genes that play important roles in controlling cell proliferation processes such as cell-cycle checkpoints and inducing apoptosis. Identification of these genes and understanding their functions are critical for further investigation of tumorigenesis. So far, many studies have identified numerous TSGs and illustrated their functions in various types of tumors or normal samples. Furthermore, accumulating evidence has shown that non-coding RNAs can act as TSGs to prevent the tumorigenesis processes. Therefore, there is a growing demand to integrate TSGs with large-scale experimental evidence (e.g. gene expression and epigenetic signatures) to provide a comprehensive resource for further investigation of TSGs and their molecular mechanisms in cancer. To achieve this goal, we first developed a comprehensive literature-based database called TSGene (tumor suppressor gene database), freely available at http://bioinfo.mc.vanderbilt.edu/TSGene/. In the current release, TSGene contains 716 human (637 protein-coding and 79 non-coding genes), 628 mouse and 567 rat TSGs curated from UniProtKB, the Tumor Associated Gene database and 5795 PubMed abstracts. Additionally, the TSGene provides detailed annotations for each TSG, such as cancer mutations, gene expressions, methylation sites, TF regulations and protein–protein interactions.
INTRODUCTION
Cancer is characterized by uncontrolled cell growth that arises from the progressive acquisition of a small number of point mutations or aneuploidy related to cell proliferation, differentiation, apoptosis and cell-to-cell communication (1,2). Tumor suppressor genes (TSGs) generally refer to a class of cancer genes that preserve genomic stability. It has long been acknowledged that TSGs have significant roles in the initiation and progression of various cancers (3). The prominent role of protein-coding TSGs in cancer pathogenesis is highlighted by the frequent somatic mutations on gene TP53 in various cancer types with that frequency ranging from 5% to 80% (4,5). Current studies have shown that the key roles of TSGs in the development of cancers exhibit at both the genetic and epigenetic levels. In a normal cell, as ‘the guardians of the cell,’ TSGs play critical roles in establishing cell-cycle checkpoints, DNA damage, inducing apoptosis and metabolic regulation (3). Genetic inactivation or diminished function of TSGs are often regarded as driver point mutations to confer a growth advantage upon the tumor cells (3). In addition, TSGs have been widely reported to occur in the deletion regions of copy number aberration in the genome (6). At the epigenetic level, many classical TSGs were transcriptionally silenced via hypermethylation that prevents abnormal cell growth in tumors (7). Moreover, recent accumulating evidence has shown that non-protein-coding RNAs, such as microRNAs (miRNAs), long non-coding RNAs (lincRNAs) and small Misc RNAs (miscRNAs), can act as TSGs to regulate cell proliferation and apoptosis at the post-transcriptional level during neoplasm development (8–11).
Recently, an increased number of TSGs were identified in various cancer syndromes using high-throughput technologies (12–16). Moreover, rediscovery of TSGs accumulated in previous small-scale studies could provide a landscape of cancer genes at the genome, transcriptome and proteome levels for genome-wide high-throughput screens (17). To keep pace with the growing demand for integrating TSGs with large-scale experimental evidence, the first step is to carefully catalog known TSGs from abundant and diverse literature and evaluate their consistency. For TSG database, there was a previous one called TSGDB (18). However, the data in TSGDB were not comprehensive (i.e. simply extracted from literature) and have not been available to the community for several years. Therefore, we performed a comprehensive collection and review of peer-reviewed, published literature from databases such as UniProtKB (19), the Tumor Associated Gene (TAG) database (http://www.binfo.ncku.edu.tw/TAG/) and PubMed abstracts (http://www.ncbi.nlm.nih.gov/pubmed/). We then manually checked and collected a total of 716 human (637 protein-coding and 79 non-coding genes), 628 mouse and 567 rat TSGs. To provide quick access to gene information, we created a database called TSGene to integrate detailed annotations for each TSG, such as COSMIC (somatic mutations from Catalogue of Somatic Mutations in Cancer) (20), gene expressions from hundreds of tumor and normal samples from BioGPS (Gene Portal System) (21), and methylation sites from DiseaseMeth database (22). The online TSGene interface with browsing and searching functionalities is available at http://bioinfo.mc.vanderbilt.edu/TSGene/.
As currently the only available database for TSGs, TSGene provides not only a comprehensive resource of TSGs for the cancer research community to further experimental design but also provides a comprehensive TSG catalog for advanced systems biology-based analyses. For example, we observed that the 637 human protein-coding TSGs were very significantly enriched in cancer-related pathways to regulate cell proliferation activities such as cell cycle, apoptosis, P53 signaling, Wnt signaling and TGF-beta signaling pathways. Based on our curated 79 human non-coding TSGs, we discovered that the majority of these non-coding TSGs' target genes were functionally represented in ‘regulation of cellular biosynthetic process.’ These results provide complementary evidence for TSGs' critical roles in fundamental cellular functions such as metabolism regulation.
DATA COLLECTION
Data integration and literature search
The primary aim of our TSGene database is to collect and maintain a high quality TSG database, which serves as a comprehensive, fully classified and accurately annotated TSG knowledgebase. The database provides extensive cross-references and querying interfaces. It is freely accessible to the public and assists the cancer research community to improve its ability to diagnose, treat and prevent cancer. Thus, we first collected known TSGs from two public databases, UniProtKB and the TAG database, and integrated them together. From UniProtKB, we retrieved 187 (human), 125 (mouse) and 66 (rat) proteins with the keyword ‘tumor suppressor’ (UniProtKB keyword KW-0043, http://www.uniprot.org/keywords/43) on 28 January 2012. From the TAG database, 170 known human TSGs were downloaded on 29 March 2012. However, the two TSG data sets only had 41 genes overlapped by mapping them to Entrez gene symbols (Supplementary Figure S1). Additionally, neither data source provides original literature to support TSG roles.
To provide a detailed and precise TSG resource with literature evidence, we first performed an extensive literature query of PubMed on 17 April 2012 using the search expression: ‘tumor suppressor’ [Title] NOT (P53 [Title] OR TP53 [Title]) with a return of 4864 PubMed abstracts. To obtain comprehensive literature evidence, we next extracted 2043 sentences with both the words ‘tumor’ and ‘suppressor’ from 1430 PubMed abstracts from the GeneRIF data file on 17 April 2012 (23). GeneRIF (Gene Reference Into Function) is a collection of short statements about gene function in the Entrez Gene database (24). Combining two exhaustive searches together, a total of 5795 PubMed abstracts were collected and downloaded in a Medline format for further manual review and curation.
Curation of TSGs from literature included three major steps as follows: grouping all 5795 PubMed abstracts by topic using the ‘Related Articles’ function in Entrez (This allowed us to quickly and easily assess if and how the described genes in several topic-related literature are TSGs. Furthermore, the results from this step may provide cross-checking between different publications for the following curation steps.); extracting descriptions of TSGs from grouped abstracts; manually curating gene names from the descriptions of the TSGs and mapping the gene names to Entrez gene IDs (This allowed us to quickly and easily assess whether several topic-related literatures supported the described genes as TSGs and provided cross-checking between different literatures). Here, we used Entrez gene IDs for TSGs to serve as the initial information to crosslink the same genes from different public databases. To gain precise Entrez gene IDs, much care is taken regarding the synonyms of gene symbols. For example, in the sentence ‘potential tumor suppressor activity of CCS-3 may be mediated by its interaction with PLZF (25),’ the gene CCS-3 was one of the synonyms of EEF1A1 in the current Entrez gene database. After carefully checking manually, we pinpointed 716 human TSGs and retrieved their orthologs in mouse and rat using orthology data downloaded from Mouse Genome Informatics (MGI) (26).
Finally, we consolidated 716 human (637 protein-coding and 79 non-coding genes), 628 mouse and 567 rat TSGs from UniProtKB, the TAG database, and 5795 PubMed abstracts.
Functional annotations of protein-coding TSGs
To better understand the function of these TSGs in our database, we collected their extensive functional information. The representative annotations in the TSGene database are summarized in Table 1. Basic gene information is included, such as gene names from the Entrez gene database (24) and orthologs among human, mouse and rat from MGI (26). Crosslinks to the miRNA database miRbase (27), text mining server iHOP (28) and literature databases PubMed and GeneRIF (23) were also provided. For functional annotations, we retrieved the pathways that the genes are involved in from BioCyc (29), KEGG Pathway (30), PID Curated (31), PANTHER (32) and Reactome (33); we also extracted possible association with diseases from KEGG Disease (30), Fundo (34,35), GAD (36), NHGIR (37) and OMIM (24) using the functional annotation server KOBAS (38). Details of these databases can be found through the cited references as well as from TSGene. Additionally, possible post-translational modifications (PTMs) and transcription factor regulation information were collected from dbPTM (39) and the TRANSFAC database (40), respectively. Digital gene expressions for 184 tumor samples and 84 normal tissues were integrated from BioGPS (21). Information about genomic variants, methylation sites and protein–protein interactions were integrated from COSMIC (20), DiseaseMeth (22) and Pathway Commons (41) databases, respectively.
Annotation entry statistics for 716 human TSGs
| Data category | Related entries | Annotated TSGs | Content/sources |
|---|---|---|---|
| General information | |||
| Human TSGs | 716 | 716 | Gene names, full name, genomics position, synonym, definition from Entrez gene database |
| Mouse TSGs | 628 | 628 | Mouse TSGs mapped from MGI Human Mouse Orthologs |
| Rat TSGs | 567 | 567 | Rat TSGs mapped from MGI Human Rat Orthologs |
| Literature | 2559 | 710 | Literature evidence for TSGs |
| Function and regulation | |||
| Pathway | 2989 | 396 | KEGG and BioCyc database, etc. |
| Disease | 3000 | 315 | GAD and OMIM database, etc. |
| Transcription factor regulation | 8708 | 549 | Regulatory reactions with TFs from TRANSFAC |
| Post-translational modification | 2295 | 328 | Experimental verified data PTMs from dbPTM |
| Target genes for non-coding TSGs | 5453 | 57 | Target predicted byTargetScan |
| Expression and methylation | |||
| Tumor samples | 680 | 458 | Expression in 184 tumor samples from BioGPS database |
| Normal tissues | 1970 | 542 | Expression in 84 normal tissues from BioGPS database |
| Methylation | 6163 | 592 | Promoter methylation profiles from DiseaseMeth database |
| Genomic variation | |||
| Substitutions | 27 358 | 535 | Point mutations |
| Insertions/deletions | 12 279 | 108 | Deletions and insertions |
| Other mutations | 9480 | 72 | Non-stop and others mutations |
| Functional interaction | |||
| Physical interactions | 58 705 | 541 | Physical interactions from high-throughput data |
| Metabolic interactions | 385 | 91 | Consecutive metabolic reactions |
| Signaling interactions | 9862 | 217 | Signaling transduction partners |
TSG, tumor suppressor gene; MGI, mouse genome informatics; PTM, post-translationalmodification.
Biological features of 637 protein-coding TSGs in humans
As the majority of TSGs are protein-coding genes (637 human protein-coding TSGs in Supplementary Table S1), we performed the pathway enrichment and disease association analyses to obtain general insight into their biological features using the KOBAS server. Over-represented pathways and significantly associated diseases were determined by an adjusted P-value <0.05 calculated by the hypergeometric test followed by the Benjamini–Hochberg method (38). As shown in Supplementary Table S2, majority of the enriched pathways, such as ‘P53 signaling pathway,’ ‘Cell cycle,’ ‘Wnt signaling pathway’ and ‘TGF-beta signaling pathway,’ are cancer relevant. Among the 32 significantly associated diseases, 27 various types of cancer were on the enriched list, including ‘cancers of the digestive system,’ ‘hepatocellular carcinoma,’ ‘prostate cancer,’ ‘colorectal cancer’ and ‘breast cancer.’
To assess the functional distribution of gene ontology (GO) and protein domains, we conducted enrichment tests on 637 human protein-coding genes using the online tool DAVID (42). We selected those GO terms or protein domains with an adjusted P-value <0.05 as calculated by the hypergeometric test followed by the Benjamini–Hochberg method (43). Using the complete human genes as background, 637 protein-coding TSGs were over-represented in negative regulation of cell proliferation, and positive regulation of apoptosis according to GO Biological Processes terms (Table 2). In total, 66.88% of the reported protein-coding TSGs were involved in biological regulation, and 32.18% of the 637 TSGs were negative regulators for cellular processes (Supplementary Table S3). In addition, the most commonly represented InterPro domains were frequently related to DNA binding or kinase activities such as ‘Winged helix repressor DNA-binding,’ ‘Insulin-like growth factor-binding protein, IGFBP,’ ‘DEATH-like’ and ‘Zinc finger, PHD-type.’ These results highlight fundamental roles of protein-coding TSGs on controlling cell growth (Supplementary Table S3).
Top 20 enriched GO biological processes of the 637 protein-coding TSGs
| GO term | P-value | Benjamini–Hochberg corrected P-value |
|---|---|---|
| Negative regulation of cell proliferation | 7.77E−57 | 2.45E−53 |
| Negative regulation of cellular process | 1.71E−53 | 2.70E−50 |
| Negative regulation of biological process | 3.30E−47 | 3.48E−44 |
| Regulation of cell proliferation | 2.41E−43 | 1.90E−40 |
| Regulation of cellular process | 1.13E−39 | 7.16E−37 |
| Regulation of biological process | 8.28E−36 | 4.35E−33 |
| Positive regulation of cellular process | 5.86E−35 | 2.64E−32 |
| Developmental process | 1.48E−33 | 5.85E−31 |
| Biological regulation | 5.22E−33 | 1.83E−30 |
| Positive regulation of biological process | 6.45E−32 | 2.04E−29 |
| Regulation of apoptosis | 6.79E−32 | 1.95E−29 |
| Regulation of programmed cell death | 1.67E−31 | 4.40E−29 |
| Regulation of cell death | 2.34E−31 | 5.68E−29 |
| Anatomical structure development | 2.67E−31 | 6.03E−29 |
| Multicellular organismal development | 5.87E−31 | 1.24E−28 |
| System development | 1.19E−30 | 2.34E−28 |
| Positive regulation of apoptosis | 1.74E−29 | 3.23E−27 |
| Positive regulation of programmed cell death | 2.81E−29 | 4.93E−27 |
| Positive regulation of cell death | 3.86E−29 | 6.41E−27 |
| Organ development | 1.92E−28 | 3.03E−26 |
Biological features of predicted targets of TSG miRNAs in humans
Among the 79 human non-coding TSGs (Supplementary Table S4), 70 belong to miRNAs. We retrieved their predictive targets from popular miRNA target database TargetScan (version 5.2, February 2011) (44–46). We required that miRNA-target relationships were evolutionarily conserved in four species (human, mouse, rat and dog) and had a total context score higher than −0.30 (47,48). The context score quantitatively represents an overall target prediction efficacy (44,45). This process generated 5453 target genes from 57 miRNA TSGs. To obtain more reliable targets, we extracted 277 target genes for further functional analysis that were regulated by at least 20 miRNA TSGs (Supplementary Table S5). According to the enriched GO terms identified by DAVID (42), regulators for the macromolecule metabolic process are over-represented in these 277 target genes (Table 3). In addition, 39.71% of the target genes locate in the nucleus (Supplementary Table S6). These results are the first to highlight non-coding TSGs as metabolic regulators, which is consistent with regulatory roles of important protein-coding TSGs on cellular metabolism (49).
Top 20 enriched GO terms of the predicted 277 target genes of non-coding TSGs
| GO term | P-value | Benjamini–Hochberg corrected P-value |
|---|---|---|
| Regulation of cellular metabolic process | 1.50E−09 | 7.89E−07 |
| Regulation of macromolecule metabolic process | 2.04E−09 | 8.05E−07 |
| Regulation of cellular biosynthetic process | 2.74E−09 | 8.65E−07 |
| Regulation of biosynthetic process | 3.74E−09 | 9.85E−07 |
| Regulation of primary metabolic process | 1.39E−09 | 1.10E−06 |
| Regulation of macromolecule biosynthetic process | 5.80E−09 | 1.31E−06 |
| Regulation of metabolic process | 1.21E−09 | 1.91E−06 |
| Regulation of gene expression | 4.93E−08 | 9.74E−06 |
| Macromolecule metabolic process | 1.30E−06 | 2.29E−04 |
| Cellular macromolecule metabolic process | 1.61E−06 | 2.54E−04 |
| Regulation of nucleobase, nucleoside, nucleotide and nucleic acid metabolic process | 3.02E−06 | 4.34E−04 |
| Regulation of nitrogen compound metabolic process | 4.18E−06 | 5.50E−04 |
| Intracellular | 1.73E−05 | 1.56E−3 |
| Regulation of transcription | 1.43E−05 | 1.74E−3 |
| Intracellular part | 1.37E−05 | 1.86E−3 |
| Binding | 1.24E−05 | 2.59E−3 |
| Nucleic acid binding | 6.28E−06 | 2.62E−3 |
| Nucleus | 1.36E−05 | 3.67E−3 |
| Primary metabolic process | 3.43E−05 | 3.86E−3 |
| Negative regulation of biological process | 3.98E−05 | 4.18E−3 |
GO, gene ontology.
DATABASE INTERFACE
We set up a MySQL relational database to store all the data. A user-friendly web interface for browsing and searching was implemented by Perl CGI and JavaScript.
Representative entry in TSGene
A typical TSGene gene entry is shown in Figure 1. Annotations of each gene can be obtained by clicking the label ‘General information,’ ‘Expression,’ ‘Regulation,’ ‘Mutation’ and ‘Interaction’ on the top. In the ‘General information’ page, gene name, pathway, disease, nucleotide sequence and protein sequence can be found in a tabular view (Figure 1A). Highlighted summaries of support literature and data sources are provided (Figure 1B). In the ‘Expression’ page, gene expressions from 84 normal tissues and 184 tumor samples are provided through a bar view with the sample name and normalized expression scores (Figure 1C), which is useful to acquire an overview for tissue specificity of each TSG among normal and tumor samples. Take gene CDKN2A as an example: the expression bar view showed that it expressed relatively higher in liver, lung, ovary and gastroesophageal cancer (Supplementary Figure S2). Three of the four tumor tissues were confirmed by literature-based gene expression data from HPRD (Human Protein Reference Database); only gastroesophageal cancer was not included in the HPRD database, but the database also reported data in gastric adenocarcinoma and esophageal squamous cell carcinoma (50,51). Moreover, classified mutation types such as substitution, insertion and deletion from the COSMIC database can be found in the ‘Mutation’ page. Interactions with transcription factors, abundance of PTM information and methylation information for each TSG are represented in the ‘Regulation’ page. To view the interaction partners, users can click on ‘Interaction’ to expand different interaction categories, including physical interactions from high-throughput experiments, metabolic and signaling interactions from known pathway databases (41).
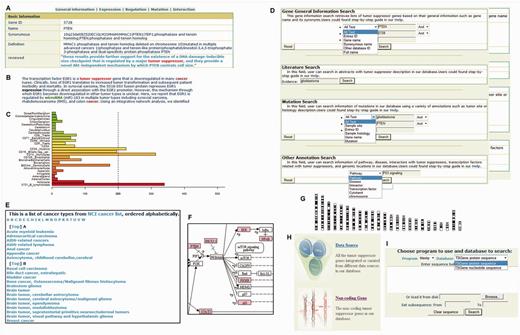
Web interface of the TSGene database. (A) Basic gene information in the TSGene database. (B) A typical highlighted literature with supporting keywords. (C) Gene expression profile. (D) Query interface. (E) Browser for various cancer types. (F) KEGG pathway mapped with TSGs (color-marked). (G) Browsing TSGs using Chromosome location. (H) Browsing TSGs by data source and gene types (protein-coding and non-coding). (I) BLAST interface for sequence searching in TSGene database.
Text and sequence searching
TSGene supports both text query and sequence search. Users can find a quick search box on the top right of each page to search by Entrez gene symbol or gene ID. An advanced search option is provided to search TSG information, including the gene symbol, Entrez gene ID, genomic location, disease and pathway. Furthermore, a query interface to access TSGs-related literatures provided a window for users to find more comprehensive TSG descriptions from original literature sources. Logical operators are provided for other annotations that allow users to build more sophisticated queries on mutations, tumor types, interactors, transcription factors and regulatory information (Figure 1D). Moreover, users can utilize an online BLAST interface to input an interesting sequence in FASTA format and search against all TSG nucleotide or protein sequences in our TSGene database (Figure 1I). For advanced bioinformatics users, TSG lists and annotation, including nucleotide and protein sequences, gene expressions and literatures, are available to download.
Online browsing
Users can browse TSGs in our database using data source, cancer type, graphically represented pathway, protein-coding, non-coding and genomic location (Figure 1E–H). In total, there are 53 types of cancer with reported TSGs in our database (The statistics are in Supplementary Table S7). In the cancer type browser page, users can click on the hyperlinks of the specific cancer type to view all the reported TSGs with literature evidence in the given cancer type (Figure 1E). To give overviews of the TSGs within their involved pathways, we marked 169 human KEGG pathways with all human TSGs in striking color (Figure 1F). Clicking on the highlighted TSGs in the pathway map allows users to access corresponding entries in our database. Using the chromosome browser, users can obtain TSG lists that include a summary of the genes and hyperlinks to detailed gene evidence and annotation pages (Figure 1G). Additionally, to provide better accessibility for non-coding TSGs and various data sources, we compiled all the protein-coding and non-coding TSGs from different data sources together for users to browse (Figure 1H).
CONCLUSION AND FUTURE PERSPECTIVES
TSGene is the first attempt to establish a literature-based resource of tumor suppressor by integrating genomic data of mutations, gene expressions, regulations, methylations and interactions. It is a valuable resource for better understanding tumorigenic mechanisms related to tumor suppressors and developing useful information for clinical application. We will continue on collection and curation of TSGenes, especially non-protein-coding RNAs. Additionally, using our curated TSG list, dictionary-based text mining tools will be developed to enhance specificity in TSG annotations.
FUNDING
Funding for open access charge: National Institutes of Health [R01LM011177 and P30CA68485].
Conflict of interest statement. None declared.
ACKNOWLEDGEMENTS
We thank Drs Peilin Jia and Qingguo Wang for assistance with the web interface. We also appreciate Ms. Rebecca Hiller Posey for improving the English of an earlier draft of the manuscript. The content is solely the responsibility of the authors and does not necessarily represent the official views of the National Institutes of Health.

Comments
Conflict of Interest:
None declared