


Abstract
Background. A decrease in blood volume is thought to play a role in dialysis‐related hypotension. Changes in relative blood volume (RBV) can be assessed by means of continuous haematocrit measurement. We studied the variability of RBV changes, and the relation between RBV and ultrafiltration volume (UV), blood pressure, heart rate, and inferior caval vein (ICV) diameter.
Methods. In 10 patients on chronic haemodialysis, RBV measurement was performed during a total of one hundred 4‐h haemodialysis sessions. Blood pressure and heart rate were measured at 5‐min intervals. ICV diameter was assessed at the start and at the end of dialysis using ultrasonography.
Results. The changes in RBV showed considerable inter‐individual variability. The average change in RBV ranged from −0.5 to −8.2% at 60 min and from −3.7 to −14.5% at 240 min (coefficient of variation (CV) 0.66 and 0.35 respectively). Intra‐individual variability was also high (CV at 60 min 0.93; CV at 240 min 0.33). Inter‐individual as well as intra‐individual variability showed only minor improvement when RBV was corrected for UV. We found a significant correlation between RBV and UV at 60 (r= −0.69; P<0.001) and at 240 min (r= −0.63; P<0.001). There was a significant correlation between RBV and heart rate (r= −0.39; P<0.001), but not between RBV or UV and blood pressure. The level of RBV reduction at which hypotension occurred was also highly variable. ICV diameter decreased from 10.3±1.7 mm/m2 to 7.3±1.5 mm/m2. There was only a slight, although significant, correlation between ICV diameter and RBV (r= −0.23; P<0.05). The change in ICV‐diameter showed a wide variation.
Conclusions. RBV changes during haemodialysis showed a considerable intra‐ and inter‐individual variability that could not be explained by differences in UV. No correlation was observed between UV or changes in RBV and either blood pressure or the incidence of hypotension. Heart rate, however, was significantly correlated with RBV. Moreover, IVC diameter was only poorly correlated with RBV, suggesting a redistribution of blood towards the central venous compartment. These data indicate that RBV monitoring is of limited use in the prevention of dialysis‐related hypotension, and that the critical level of reduction in RBV at which hypotension occurs depends on cardiovascular defence mechanisms such as sympathetic drive.
Introduction
Intradialytic hypotension is a common complication in patients on chronic haemodialysis. Many factors have been implicated in its pathogenesis, including autonomic dysfunction, cardiac dysfunction and a reduction in effective blood volume [1,2]. Changes in effective blood volume can be measured by radioisotope dilution techniques [3], but these methods are complicated and not easily applied on a routine basis. Changes in relative blood volume (RBV), however, can be estimated by means of continuous haematocrit measurement [4–6]. Monitoring RBV during haemodialysis and discontinuing ultrafiltration when a critical level of RBV reduction is reached has been advocated in order to improve haemodynamic stability during dialysis [7,8]. For this it is essential that the critical level of RBV reduction can be predicted in individual cases. Therefore we studied the intra‐ and inter‐individual variability of RBV measurement and the correlation of RBV with blood pressure (BP), heart rate (HR), and inferior caval vein (ICV) diameter.
Subjects and methods
Patients and haemodialysis treatments
Ten patients on regular haemodialysis were asked to participate in this study. This study was approved by the ethical committee of the University Hospital Rotterdam–Dijkzigt, and informed consent was obtained from all patients. Age, sex, and dialysis data are given in Table 1. Haemodialysis treatments were performed using bicarbonate buffered dialysate (sodium 138 mmol/l, potassium 2.0 mmol/l, bicarbonate 34 mmol/l), polysulphone membranes (F60, Fresenius, Bad Homburg, Germany) and Fresenius 4008 E haemodialysis monitors. Blood flow ranged from 200 to 250 ml/min, and dialysate flow was 500 ml/min. Treatments were performed on a thrice‐weekly basis for 4 h. Only subjects requiring at least 1000 ml of ultrafiltration volume (UV) during each treatment were included.
Food and fluid intake was withheld prior to each investigative dialysis sessions. One hour after starting, one cup of tea and a snack were served. One hour later, another cup of tea was provided.
Characteristics of the patients
| Age (years) | 65.5±11.9 |
| Male/female | 5/5 |
| Dry weight (kg) | 63.8±11.8 |
| Time on dialysis (years) | 5.3±2.5 |
| Cardiac index (l/m2) | 2.3±1.1 |
| EA ratio | 0.9±0.3 |
| Age (years) | 65.5±11.9 |
| Male/female | 5/5 |
| Dry weight (kg) | 63.8±11.8 |
| Time on dialysis (years) | 5.3±2.5 |
| Cardiac index (l/m2) | 2.3±1.1 |
| EA ratio | 0.9±0.3 |
Blood pressure, inferior caval vein diameter, and cardiac output measurements
During dialysis, BP and HR was measured at 5‐min intervals by means of the Accutor 3 oscillometric device (Datascope Co., Montreal NJ, USA). Hypotension was defined as a systolic blood pressure ≤90 mmHg. To estimate hydration status before and after haemodialysis, ICV measurements were performed using ultrasonography (Aloka SDD 1100, 3.75 MHz probe, Aloka Co., Tokyo, Japan). Real‐time, two‐dimensional ultrasonography was used, with simultaneous ECG monitoring. The longitudinal axis of the ICV was used to measure its diameter at inspiration and at end‐expiration, exactly 2 cm below the diaphragm. Using a cine loop memory containing 10 images, an image just before the P wave on the ECG tracing was taken for measurement. In all patients, cardiac function was previously analysed using precordial ultrasonography. Cardiac output was determined by calculating the stroke volume using the bi‐plane discs method. Diastolic left ventricular function was assessed by Doppler evaluation of left ventricular filling. After measuring early (E) and atrial (A) flow over the mitral valve, the E/A ratio was calculated. Diastolic dysfunction was present in all patients.
Relative blood volume measurement
RBV measurement was performed by continuous optical measurement of the haematocrit using the Crit‐line device (In‐line Diagnostics Co., Riverdale, Utah, USA). Patients were placed in a supine position 30 min before starting RBV measurements, and this position was maintained throughout the investigative dialysis sessions. To ensure an adequate baseline haematocrit without mixture of rinsing saline, RBV measurement was started 5 min after the onset of haemodialysis. RBV measurement was performed during 10 consecutive weeks on the same weekday.
Data collection
Data from the Crit‐line device and the Accutor 3 were sent to a personal computer and recorded by a data acquisition program. During the data collection, the occurrence of symptoms and/or changes in the dialysis treatment parameters was instantly recorded.
Statistics
For RBV, means of 10‐min periods at 60, 120, 180, and 240 min were used for comparison. Similarly, means of RBV values over a range of 10 ml at 500, 1000, and 1500 ml ultrafiltration volumes were taken. Differences in BP, HR, ICV diameter, and RBV were analysed using ANOVA for repeated measurements followed by the Newman–Keuls test for multiple comparisons. Differences between patients were analysed using two‐way ANOVA. Variability was assessed by calculating the coefficient of variance. Correlation was assessed using linear correlation by calculating Pearson's correlation coefficient. All data are presented as mean±standard deviation. A P value of <0.05 was assumed to indicate statistical significance.
Results
Ultrafiltration volume
Measurements were performed in 100 haemodialysis sessions. UV after 4 h was 2438±457 ml. With a mean body weight of 65.9±9.3 kg; this represents 3.7% of the total body weight. The mean UV corrected for body surface area (BSA) was 1428±311 ml/m2 (Table 2). In 19 sessions, ultrafiltration was temporarily stopped because of hypotension or other symptoms.
Weight gain, ICV measurement, blood pressure, RBV, and ultrafiltration volume (mean of all sessions)
| Time (minutes) | Start | 60 | 120 | 180 | 240 | F | P |
| UV (ml/m2) | 386±118 | 746±184 | 1098±254 | 1428±311 | |||
| ICVD‐exp. (mm/m2) | 10.3±1.7 | 7.3±1.5 | <0.001 | ||||
| SAP (mmHg) | 151.4±20.6 | 151.1±14.1 | 150.5±18.6 | 148.1±18.9 | 140.0±17.3 | 2.4 | <0.05 |
| DAP (mmHg) | 84.0±7.1 | 82.7±7.7 | 83.8±6.5 | 83.6±7.9 | 79.8±7.7 | 6.2 | <0.001 |
| HR (b.p.m.) | 73.9±7.9 | 74.9±10.1 | 76.9±9.2 | 80.0±9.2 | 81.3±10.2 | 33.7 | <0.001 |
| RBV (%) | −3.8±2.5 | −5.4±2.8 | −8.0±3.2 | −10.3±3.6 | 314.5 | <0.0001 |
Blood pressure
Mean systolic blood pressure (SAP) decreased from 151.4±20.6 mmHg at the start of haemodialysis to 140.0±17.3 mmHg at the end (P<0.05; Figure 1). Diastolic blood pressure (DAP) decreased from 84.0±7.1 to 79.8±7.7 mmHg (P<0.001), while the heart rate increased from 73.9±7.9 to 81.3±10.2 b.p.m. (P<0.001).
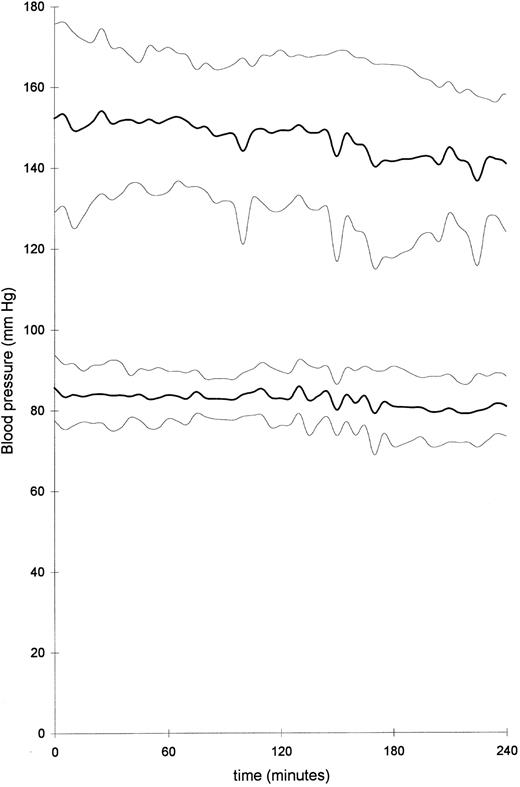
Systolic and diastolic blood pressure during 4 h of haemodialysis in 10 patients (thick lines, mean of all patients; thin lines, ±standard deviation).
ICV measurement
At the start of dialysis, mean ICV diameter at end‐expiration and at inspiration were 10.3±1.7 mm/m2 and 8.2±2.2 mm/m2 respectively. At the end of dialysis, mean ICV diameters had decreased to 7.3±1.5 mm/m2 at end‐expiration and 5.3±1.5 mm/m2 at inspiration (P<0.001; Table 2).
Blood volume monitoring
Changes in RBV showed marked inter‐individual variability (Figure 2a). For all patients, the change in RBV was −3.8±2.5% at 60 min and −10.3±3.6% at the end of dialysis (Table 2). At 60 min, mean RBV of 10 single patients varied between −0.51% and −8.17% (P<0.001), and at the end of dialysis, RBV varied between −3.71% and −14.55% (P<0.001; Table 3). The coefficients of variability demonstrate a wide variation in RBV after 60, 120, 180, and 240 min between different patients (CV 0.66, 0.52, 0.41, and 0.35 respectively; Table 3). Within individual patients, changes in RBV were also highly variable. Mean coefficients of intra‐individual variability ranged from 0.66 after 60 min to 0.35 at the end of dialysis (Table 3).
When changes in RBV were plotted against UV corrected for BSA, inter‐individual variability remained considerable (Figure 2b). Coefficients of variation ranged from 0.48 to 0.23 (Table 4). Intra‐individual variability was also marked (mean intra‐individual CV 0.95 to 0.37; Table 4).
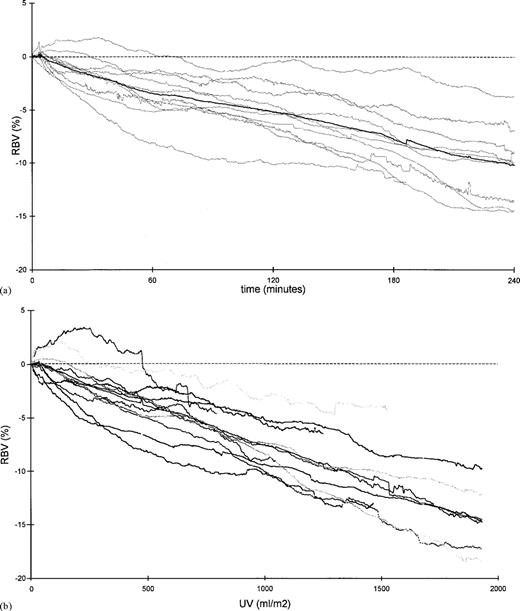
Mean changes in relative blood volume of 10 patients in 10 haemodialysis sessions (thin lines), and mean of all patients (thick line), plotted (a) against time and (b) against ultrafiltration volume.
Relative blood volume of 10 patients (mean of 10 haemodialysis sessions) at 60, 120, 180, and 240 min of dialysis
| RBV at | CV | RBV at | CV | RBV at | CV | RBV at | CV | |
| 60 min | 120 min | 180 min | 240 min | |||||
| Patient 1 | −4.24 | 0.57 | −6.70 | 0.32 | −10.15 | 0.33 | −13.71 | 0.19 |
| Patient 2 | −2.43 | 0.67 | −3.00 | 0.74 | −5.35 | 0.33 | −6.98 | 0.30 |
| Patient 3 | −2.27 | 0.68 | −5.20 | 0.46 | −7.96 | 0.38 | −9.99 | 0.31 |
| Patient 4 | −0.51 | 3.65 | −0.52 | 6.41 | −1.20 | 2.83 | −3.71 | 0.87 |
| Patient 5 | −1.37 | 1.58 | −3.51 | 0.76 | −6.12 | 0.55 | −8.23 | 0.37 |
| Patient 6 | −4.12 | 0.43 | −7.13 | 0.35 | −11.23 | 0.22 | −14.55 | 0.23 |
| Patient 7 | −8.17 | 0.29 | −10.05 | 0.27 | −10.94 | 0.25 | −8.64 | 0.42 |
| Patient 8 | −7.48 | 0.29 | −8.68 | 0.27 | −11.27 | 0.16 | −12.84 | 0.17 |
| Patient 9 | −2.77 | 0.70 | −3.89 | 0.74 | −6.44 | 0.59 | −9.73 | 0.20 |
| Patient 10 | −4.51 | 0.40 | −5.41 | 0.59 | −9.02 | 0.37 | −14.51 | 0.22 |
| Mean | −3.79 | 0.93 | −5.41 | 1.09 | −7.97 | 0.60 | −10.29 | 0.33 |
| Inter‐individual CV | 0.66 | 0.52 | 0.41 | 0.35 |
CV, coefficient of variation.
Relative blood volume of 10 patients (mean of 10 haemodialysis sessions) at 500, 1000, and 1500 ml of ultrafiltration volume/m2 of body surface area
| RBV at | CV | RBV at | CV | RBV at | CV | |
| 500 ml UV | 1000 ml UV | 1500 ml UV | ||||
| Patient 1 | −4.40 | 0.60 | −7.57 | 0.36 | −11.56 | 0.24 |
| Patient 2 | −2.15 | 0.80 | −5.59 | 0.55 | — | — |
| Patient 3 | −3.22 | 0.64 | −7.36 | 0.30 | −10.16 | 0.29 |
| Patient 4 | −0.60 | 5.24 | −3.03 | 0.98 | −3.96 | 1.34 |
| Patient 5 | −3.52 | 0.52 | −8.95 | 0.30 | — | — |
| Patient 6 | −6.76 | 0.22 | −9.39 | 0.12 | −12.38 | 0.08 |
| Patient 7 | −5.04 | 0.27 | −10.04 | 0.24 | −14.63 | 0.17 |
| Patient 8 | −8.20 | 0.28 | −10.27 | 0.26 | — | — |
| Patient 9 | −3.31 | 0.47 | −5.15 | 0.32 | −8.58 | 0.29 |
| Patient 10 | −4.86 | 0.48 | −8.40 | 0.23 | −14.47 | 0.08 |
| Mean | −4.20 | 0.95 | −7.57 | 0.37 | −10.81 | 0.37 |
| Inter‐individual CV | 0.48 | 0.31 | 0.23 |
CV, coefficient of variation.
Correlation between relative blood volume, ultrafiltration volume, heart rate, blood pressure, and inferior caval vein measurement
The change in RBV was highly correlated with ultrafiltration volume both at 60 min (r= −0.69; P<0.001), and at 240 min (r= −0.63; P<0.0001; Figure 3a). Interestingly, there was no significant correlation between the change in RBV and either systolic or diastolic blood pressure, at 60 min and at 240 min (Figure 3b). Ultrafiltration volume was not correlated with either systolic or diastolic blood pressure. The change in heart rate was correlated with change in RBV at 240 min (r=−0.39; P<0.0001; Figure 3c), but not with ultrafiltration volume. Although there was a marginally significant correlation between the change in RBV and ICV diameter (r=−0.23; P<005), there was a considerable variation in the decrease in ICV diameter (Figure 3d).
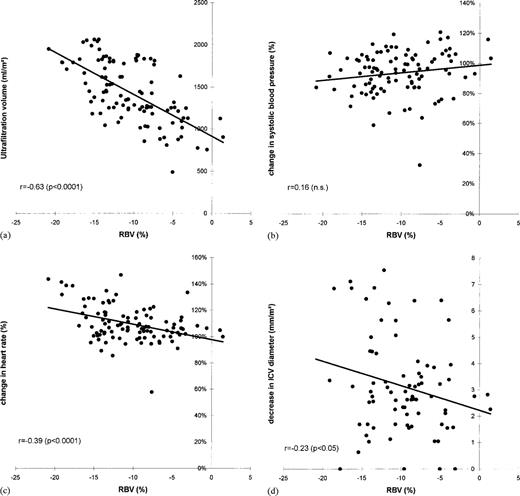
(a) RBV (%) vs ultrafiltration volume after 240 min of haemodialysis. (b) RBV (%) vs change in systolic blood pressure after 240 min of haemodialysis. (c) RBV (%) vs change in heart rate (%) after 240 min of haemodialysis. (d) RBV (%) vs decrease in ICV diameter (end‐expiration; mm/m2) after 240 min of haemodialysis.
Incidence of hypotension, and corresponding relative blood volume and haematocrit
The incidence of hypotensive episodes was relatively low. Hypotension occurred in seven haemodialysis sessions, all in two patients. Systolic blood pressure ranged from 63 to 89 mmHg in patient 1 (four sessions), and from 84 to 89 in patient 7 (three sessions). In six sessions, hypotension was accompanied by a heart rate of 60 b.p.m. or less. In both patients, RBV at which hypotension occurred, varied markedly (patient 1, −9.2 to −16.0%; patient 7, −1.4 to −16.5%). In addition, the corresponding haematocrit values showed considerable variation (patient 1, 0.27 to 0.31; patient 7, 0.32 to 0.37). Change in ICV diameter was not significantly different from sessions without hypotensive episodes.
Discussion
In this paper, the variability of RBV changes during haemodialysis is reported for the first time. We observed a considerable inter‐and intra‐individual variability of RBV changes during haemodialysis, even when corrected for UV. Although there was a significant correlation between RBV and ultrafiltration volume, a correlation between RBV and blood pressure was not found. Ultrafiltration volume was not correlated with blood pressure or heart rate. There was, however, a significant correlation between RBV and heart rate, and a slight correlation between RBV and ICV‐diameter.
It is not surprising that we observed high inter‐individual variability of RBV changes as differences in body composition, hydration state, and the cardiovascular status are known to affect the course of RBV during dialysis [1,2,9]. However, we found that the intra‐individual variability was equally high. In our study, this variability could not be explained by differences in food and fluid intake during dialysis, as these were restricted according to a standardized time and quantity schedule. Also, medication was not changed during the 10‐week trial period, and intercurrent changes in the cardiovascular status such as the occurrence of myocardial ischaemia or systemic infection were not observed.
It is tempting to assume that the observed intra‐individual variability in RBV changes was caused by differences in ultrafiltration volume, as there was a significant correlation between UV and RBV. However, when the RBV curves were plotted against UV instead of time, we found only a minor improvement of the variation coefficients. Thus, differences in ultrafiltration rate are unlikely to account for the day‐to‐day variation of the blood volume response to haemodialysis, and other factors must be involved.
There was no correlation between RBV and blood pressure, which is contrary to other observations [6,10,11]. However, a discrepancy between blood pressure and blood volume has been reported before [12]. Blood pressure was also not dependent on UV. There was, however, a significant correlation between RBV and heart rate. This suggests that a reduction in RBV, through ultrafiltration, stimulates the autonomic nervous system, which prevents a decrease in blood pressure by an increase in heart rate. In patients who did develop hypotension during dialysis, we were unable to determine a critical level of RBV reduction. Moreover, in six out of seven hypotensive dialysis sessions, patients were bradycardic instead of tachycardic, indicating that in these patients hypotension was caused rather by a failing cardiovascular response than by critical level of blood volume reduction.
In our study, ICV diameter decreased significantly during dialysis. However, when we studied the relation between the change in ICV diameter and the change in RBV during dialysis, the correlation proved to be poor. This means that filling of the central venous compartment, which is assumed to be represented by the ICV diameter [13], does not change in parallel to changes in RBV. Therefore a redistribution of blood within the vascular compartment must be assumed. This most probably results from cardiovascular defence mechanisms such as peripheral and/or venous vasoconstriction, or a change in cardiac output.
We conclude that RBV changes have a considerable intra‐ and inter‐individual variability, not only in time but also when plotted against UV. No correlation was observed between UV or changes in RBV and either blood pressure or the incidence of hypotension. Heart rate, however, was significantly correlated with RBV. Moreover, IVC diameter was only poorly correlated with RBV, suggesting a redistribution of blood towards the central venous compartment. These data indicate that RBV monitoring is of limited use in the prevention of dialysis‐associated hypotension. The critical level of reduction in RBV at which hypotension occurs may depend more on cardiovascular defence mechanisms such as sympathetic drive, than on the reduction in RBV.
Correspondence and offprint requests to: H. P. Krepel, Department of Internal Medicine I, University Hospital Rotterdam–Dijkzigt, PO Box 2040, 3000 CA Rotterdam, The Netherlands.
References
Veillon C, Patterson KY, Nagy DA, Tehan AM. Measurement of blood volume with an enriched stable isotope of chromium (53Cr) and isotope dilution by combined gas chromatography‐mass spectrometry.
McMahon MP, Campbell SB, Shannon GF, Wilkinson JS, Fleming SJ. A non‐invasive continuous method of measuring blood volume during hemodialysis using optical techniques.
Vries de JP, Olthof CG, Visser V et al. Continuous measurement of blood volume during hemodialysis by an optical method.
Steuer RR, Harris DH, Conis JM. A new optical technique for monitoring hematocrit and circulating blood volume: its application in renal dialysis.
Santoro A. Mancine IE, Paolini F, Zucchelli P. Blood volume monitoring and control.
Mann H, Stelanitis I, Reinhart B, Stiller S. Prevention of haemodynamic risks by continuous blood volume measurement and control.
Dorhout Mees EJ, Özbasli Ç, Akçiçek F. Cardiovascular disturbances in hemodialysis patients: the importance of volume overload.
Lins LE, Hedenborg G, Jacobson SH et al. Blood pressure reduction during hemodialysis correlates to intradialytic changes in plasma volume.
Stiller S, Wirtz D, Waterbär F, Gladziwa U, Dakshinamurty KV, Mann H. Less symptomatic hypotension using blood volume controlled ultrafiltration.
Pizzarelli F, Dattolo P, Piacenti M et al. Non‐invasive monitoring of hemodynamic parameters during hemodialysis.


Comments