


Abstract
Background. Taurine, which is the major intracellular free β‐amino acid, is known to be an endogenous antioxidant and a membrane‐stabilizing agent. In this study, we wished to know whether taurine altered the concentration of gentamicin in kidney tissue and could protect against gentamicin‐induced acute proximal tubular injury.
Methods. Wistar albino rats of both sexes were assigned to three groups, which all received one of the following daily intraperitoneal injections for 8 days: (i) 0.9% sodium chloride (NaCl) alone at the same volume as gentamicin treated rats (group C; n=8); (ii) 100 mg/kg/day gentamicin alone (group G; n=8, four male, four female); or (iii) 100 mg/kg/day gentamicin plus 7.5 ml/kg/day taurine (group G+T; n=9, five male, four female). Urine was collected for 24 h for the determination of urine volume and creatinine. Intracardiac blood was collected for blood urea nitrogen (BUN) and serum creatinine determination. The kidneys were removed, weighed, and the left kidneys were subjected to biochemical analysis for the determination of thiobarbituric acid‐reactive substance (TBARS) and lactate levels, and glutathione peroxidase (Gpx) and superoxide dismutase (SOD) activities. The right kidneys were divided vertically in half. The upper halves were used for histopathological examination, by light and electron microscopy. The lower halves were used to detect the gentamicin concentration within the kidney tissue, by high‐performance liquid chromatography (HPLC). Changes in body weight and normalized kidney weight were recorded.
Results. Taurine treatment reduced gentamicin‐induced increases in serum creatinine, 24 h urine volume, BUN and tissue lactate and TBARS levels (0.57±0.02 vs 1.06±0.08 mg/dl, P<0.001; 9.00±1.46 vs 20.9±2.73 ml, P<0.001; 25.3±1.87 vs 54.1±6.99 mg/dl, P<0.001; 2.56±0.10 vs 3.44±0.08 μmol/g wet tissue, P<0.001; and 66.4±3.41 vs 79.5±5.07 nmol/g wet tissue, P>0.05, respectively). Taurine reduced the accumulation of gentamicin within the kidney tissue (233±29 vs 494±93 μg/g wet tissue, P<0.05). Taurine treatment also prevented body weight loss due to gentamicin administration (17.8±1.64 vs −10.0±7.08 g, P<0.01) and normalized reduced Gpx and SOD activities (3.46±0.16 vs 2.37±0.15 U/g wet tissue, P<0.01; and 15577±377 vs 12662±577 U/g wet tissue, P<0.01, respectively). Light microscopic examination of the renal tissues from gentamicin‐treated rats revealed severe histopathological changes, whereas specimens obtained from taurine‐treated rats revealed only mild changes. This finding was supported by electron microscopic examination.
Conclusions. Our observations suggest that taurine treatment attenuates the accumulation of gentamicin within kidney tissue and counteracts the deleterious effect of gentamicin on renal tubular function. They may have potentially important clinical implications.
Introduction
Taurine (2‐aminoethanesulfonic acid) is the major intracellular free β‐amino acid which is normally present in most mammalian tissues [1]. Although taurine is not a constituent of any structural mammalian protein, it plays various important physiological roles including osmoregulation, bile acid conjugation, modulation of the functioning of the central nervous system, cell proliferation, viability and prevention of oxidant‐induced injury in many tissues [1,2]. The beneficial effects of taurine as an antioxidant in biological systems have been attributed to its ability to stabilize biomembranes [3], scavenge reactive oxygen species [4] and reduce the production of malondialdehyde (MDA), an end‐product of lipid peroxidation, from the unsaturated membrane lipids [2]. A lot of studies about the antioxidant effect of taurine in the lung [5], heart [6] and liver [7] tissues have been performed, but there are a few reports about the beneficial effect of taurine in kidney tissue.
Aminoglycoside antibiotics, including gentamicin, are widely used in the treatment of Gram‐negative infections. A major complication of gentamicin treatment is nephrotoxicity, accounting for 10–15% of all cases of acute renal failure. Because of their highly basic charge, aminoglycosides poorly penetrate cell membranes. However, out of all the tissues in the body, the proximal tubule cells of renal cortex stand alone in their ability to concentrate aminoglycosides several fold more than plasma levels. Gentamicin appears to bind to anionic phospholipids of the cell membrane, particularly to phosphatidylinositol 4,5‐bisphosphate, and gains access to the cell interior. After internalization, gentamicin binds to subcellular organelles or is taken up into lysosomes. Accumulation of aminoglycosides within the renal cortex is known to be related intimately to the pathogenesis of nephrotoxicity. Although the mechanism of gentamicin‐induced cell injury and cell death is still unclear, interactions with the cell membrane, mitochondria, lysosomes and microsomes are likely to be involved [8]. The ability of gentamicin to alter mitochondrial respiration has been well documented by both in vivo and in vitro [9,10] studies. In vivo administration of gentamicin increased MDA levels in the renal cortex of rats [11]. Nevertheless, the role of free radicals in the pathogenesis of aminoglycoside nephrotoxicity remains to be established. Although in vivo and in vitro models suggest the role of free radical production in gentamicin nephrotoxicity, the studies designed to assess whether free radical scavengers protect against gentamicin nephrotoxicity have given conflicting results [8].
In this study, we hypothesized that taurine protects the kidney tissue against gentamicin‐induced acute proximal tubular cell injury.
Materials and methods
Animals
Wistar‐albino rats of both sexes (150–300 g, 13 male, 12 female) were used. Experiments were performed with the permission of the local ethics committee. All rats were kept under observation for 1 week prior to the experiments to permit the animals to adjust to the environment. All animals were fed standard rat chow and were provided tap water to drink ad libitum. They were housed in a facility with 12–12 h light–dark cycle that is maintained at 22–25°C. All animals were weighed before the injections.
Experimental protocol
Rats were assigned randomly to three groups. Control animals (C) were injected intraperitoneally (i.p.) with 0.9% (w/v) NaCl, at the same volume as gentamicin‐treated rats, for a period of 8 days (n=8, four male, four female). The second group of animals (G) were injected with gentamicin (gentamicin sulfate, Schering Co.) in 0.9% NaCl at a dose of 100 mg/kg/day (2.5 ml/kg, i.p.), for 8 days (n=8, four male, four female). The third group of animals (G+T) were injected with the same dose of gentamicin and, additionally, taurine (10% aqueous solution, 7.5 ml/kg/day, i.p., Sigma Chemical Co., St Louis, MO) for 8 consecutive days (n=9, five male, four female). The injections were carried out between 9.00 and 9.30 a.m. to minimize the circadian variation in gentamicin‐induced nephrotoxicity [12]. After the last injection, animals were kept individually in metabolic cages for 24 h urine collection and urine creatinine determination. Rats had free access to water and food during the period that they were kept in the metabolic cages. At the end of this period, all rats were weighed to determine the body weight changes.
Surgical procedure
The animals were anaesthetized with ether inhalation. Bilateral perilumbal vertical incisions were made. Blood samples were collected with cardiac puncture for blood urea nitrogen (BUN) and serum creatinine determination. Right and left kidneys were removed quickly and weighed. The left kidneys were stored in liquid nitrogen until tissue studies began. The right kidneys were divided vertically in half. The upper halves were fixed for light and electron microscopic examination. The lower halves, obtained from group G and group G+T, were used for high‐performance liquid chromatography (HPLC) analysis, to detect the amount of gentamicin accumulated within the kidney tissue. The whole procedure (beginning with the intracardiac blood collection to the end of tissue fixation) was completed in 2 min.
Biochemical studies
BUN, plasma and urine creatinine levels were measured by an automated analyser (Hitachi 747 Automatic Analyzer). Creatinine clearance was calculated by the standard equation and was expressed as ml/min/100 g body weight.
Tissue studies
Thiobarbituric acid‐reacting substances (TBARS) of lipid peroxidation, lactic acid levels, and glutathione peroxidase (Gpx) and superoxide dismutase (SOD) activities were determined in the left kidneys. Tissues were homogenized in 150 mM ice‐cold potassium chloride (KCl) to make a 10% homogenate, using a glass Teflon homogenizer. All of the biochemical determinations were carried out on this homogenate. Two ml of the homogenate was immediately pipetted into a tube containing 2 ml of cold 8% (v/v) perchloric acid (HClO4). The mixture was shaken vigorously and kept cold until centrifugation.
Determination of lipid peroxides
The levels of lipid peroxides in tissues were determined by the method of Uchiama and Mihara [13]. Three ml of 1% phosphoric acid (H3PO4) and 1 ml of 0.6% TBA solution were added to 0.5 ml of 10% tissue homogenate and pipetted into a tube. The mixture was heated in boiling water for 45 min. After cooling, the coloured complex was extracted into 4 ml of n‐butanol and the absorbance was measured at 532 nm (ε=1.56×10⁵/M/cm). The amount of lipid peroxides was calculated as TBAR products of lipid peroxidation and expressed as nmol/g of wet tissue.
Determination of lactic acid
The tissue concentration of lactate was determined enzymatically using lactate dehydrogenase (LDH) and nicotinamide adenine dinucleotide (NAD). Lithium lactate was used as the lactate standard. The absorbance of blank, standards and samples was studied under identical conditions and measured at 340 nm. The tissue lactate level, as μmol/g of wet tissue, was calculated by comparing the absorbance of samples with lactate standards [14].
Determination of glutathione peroxidase
Tissue Gpx activity was determined by the method described by Beutler [15]. Enzyme activity was measured in 100 mM phosphate buffer containing reduced glutathione (GSH; 1 mM), ethylene diamine tetraacetic acid (EDTA; 4 mM), sodium azide (NaN3; 4 mM), nicotinamide adenine dinucleotide phosphate (NADPH; 0.2 mM) and glutathione reductase. A 0.05 ml aliquot of the tissue homogenate supernatant was added to the mixture. The reaction was started by the addition of 0.05 ml of hydrogen peroxide (H2O2; 1 mM). The reaction rate was measured by a recording spectrophotometer. Optic density changes per minute were determined. NADPH oxidized in 1 min was measured by using the molar absorbance of NADPH at 340 nm (ε=6220). The enzyme activity was expressed as U/g of wet tissue.
Determination of superoxide dismutase
The reaction was initiated by the addition of xanthine oxidase and 50 μl of homogenate supernatant. The inhibition, by superoxide dismutase (SOD), of the reduction of cytochrome c, was recorded spectrophotometrically at 550 nm. The amount of SOD that inhibits the reduction of cytochrome c by 50% was accepted as 1 U, and tissue SOD activity was expressed as U/g of wet tissue [16].
Determination of tissue gentamicin level
The bottom halves of the vertically divided right kidneys from groups G and G+T were used in these experiments. An HPLC method, described by Strife and Jardine [17], was used for determination of the gentamicin concentration in rat kidney. The kidney tissue was homogenized in 3 ml of Tris buffer [2% (w/v) Sigma] at 4°C. After centrifugation, a 50 μl aliquot of the supernatant was used immediately for gentamicin determination. Then, 150 μl of Tris buffer [2% (w/v)] and 400 μl of acetonitrile were added and vortex mixed. After centrifugation, 400 μl of supernatant was transferred into an ampoule. The derivatives of gentamicin, C1a, C1 and C2, were produced by mixing 40 μl of 2,4‐dinitrofluorobenzene (Sigma, 170 g/l in acetonitrile). The ampoule was closed and placed in a water bath at 77°C for 45 min. Samples of 100 μl were injected immediately into the column.
Chromatography
The chromatographic system consisted of a Model 9002 HPLC pump (Varian, Walnut Creek, CA), a Model 9100 Autosampler (Varian), a UV/Vis Absorbance Detector 486 and a Model 746 data module (Waters, Milford, MA). The separation was performed on a μBondopak, C18 column (300×3.9 mm i.d., particle size 10 μm), (Waters) and a pre‐column (C18). The mobile phase consisted of 1 g/l of Tris (hydroxymethyl) aminomethane in water 30% (w/v), adjusted with 5 M HCl to pH 7, and acetonitrile 70% [(v/v) HPLC grade, Baker, Phillipsburg, NJ] at a flow rate of 1.2 ml/min at ambient temperature. The UV detector was set to 365 nm and AUFS 0.01.
Although gentamicin has three major components, only two peaks, with retention times of 7.80 and 8.71 min, were obtained. Components C1 and C2 were not resolved and they had the same retention time, 8.71 min; C1a had a retention time of 7.80 min. A stock solution of gentamicin (1 mg/ml) was prepared in distilled water. Calibration curves of the components were prepared in a drug‐free supernatant of the renal homogenates and were linear over the concentration range 50–400 μg/ml. The day‐to‐day reproducibility was <9%.
Histological studies
The upper halves of the right kidneys were examined for histopathological changes. All the kidney specimens were examined by light microscopy, and one specimen, randomly selected from each group, was examined by electron microscopy. The kidneys were sectioned and fixed in 10% formalin and then embedded in paraffin wax for light microscopy. Sections were cut at 7 μm and stained with haematoxylin–eosin. The light microscopic examination of the kidney sections was done according to Houghton et al. [18]. The changes were limited to the tubulointerstitial areas and were graded as follows: 0=normal; 1=areas of focal granulovacuolar epithelial cell degeneration and granular debris in the tubular lumina with or without evidence of desquamation in small foci (<1% of total tubule population involved by desquamation); 2=tubular epithelial necrosis and desquamation easily seen but involving less than half of the cortical tubules; 3=more than half of the proximal tubules showing necrosis and desquamation, but intact tubules are easily identified and 4=complete or almost complete proximal tubular necrosis.
Tissues for electron microscopy were fixed in 2% glutaraldehyde for 24–48 h at room temperature. They were post‐fixed in 2% osmium tetroxide for 1 h, dehydrated and embedded in araldite. Sections were cut with a Reichert Om u3 ultramicrotome stained with lead citrate and uranyl acetate, and examined in a Jeol 100C electron microscope.
Statistical analysis
Statistical differences between groups were computed by one‐way analysis of variance followed by Bonferroni's multiple comparison test. Tissue gentamicin concentrations of group G and group G+T were compared by the Student's t‐test (two‐tailed) for unpaired data. All values were reported as the mean±SEM. The experimental findings were considered statistically significant if P<0.05.
Results
All animals were weighed before and after the experiments. The difference between these weights was expressed as body weight change. In group G, gentamicin caused a severe loss in body weight (P<0.001 vs control), that was inhibited by taurine administration in group G+T (P<0.01 vs group G; Table 1).
For standardization, total kidney weight was normalized as the percentage of total body weight [100×(right kidney weight+left kidney weight)/total body weight]. Normalized kidney weights were higher both in group G and group G+T than in the control group (for both P<0.05 vs control; Table 1). The 24 h urine volume in group G was significantly higher than in group C (P<0.01), indicating the presence of gentamicin‐induced polyuria, whereas in group G+T it was not different from that in group C, pointing out the protective role of taurine against acute tubular necrosis (Table 1).
Gentamicin administration produced a significant increase in serum creatinine (P<0.001 vs control) which was avoided by taurine treatment (P<0.001 vs group G; Table 1). For standardization, the creatinine clearance value [(urine creatinine×24 h urine volume)/(plasma creatinine×1440)] was normalized per 100 g of body weight. The normalized creatinine clearance in group G was significantly lower than that in group C (P<0.01). The gentamicin‐induced decline in the normalized creatinine clearance was partly, but non‐significantly, inhibited by taurine treatment (Table 1).
Gentamicin administration caused an increase in BUN concentration (P<0.001 vs control), which was improved by taurine treatment (P<0.001, Table 1).
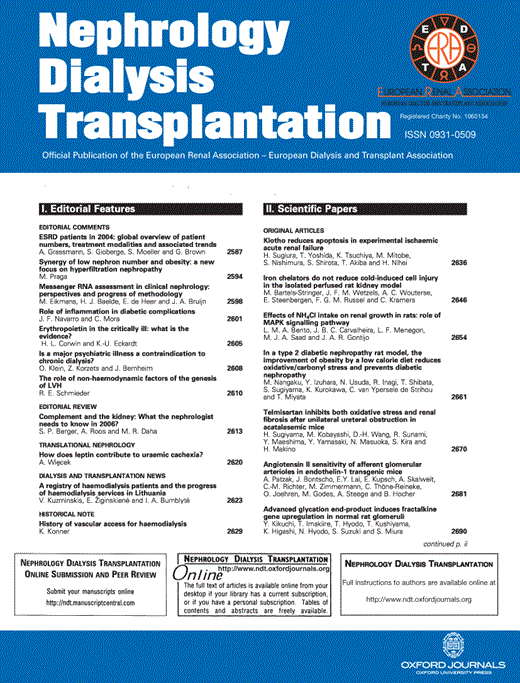
Lipid peroxidation in the renal cortex, as assessed by the accumulation of TBARS, was augmented by gentamicin administration (79.55±5.07 vs 60.68±1.81 nmol/g of wet tissue, control; P<0.01) but could not be inhibited by taurine treatment (66.46±3.41 nmol/g of wet tissue; NS vs group G). However, the TBARS accumulation in the gentamicin+taurine group was also not significantly different from control (Figure 1).
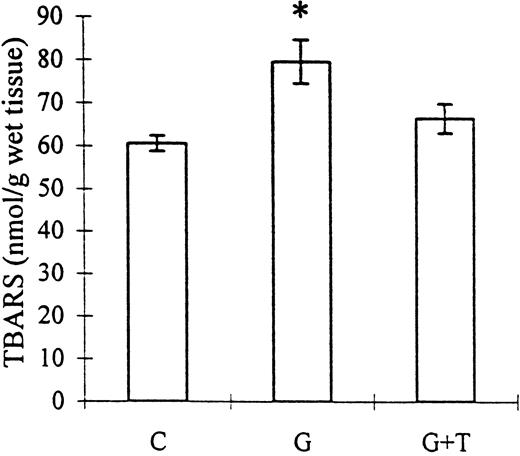
Kidney tissue lactate level, as an indicator of hypoxia, was also increased by gentamicin administration (3.44±0.08 vs 2.87±0.06 μmol/g of wet tissue, control; P<0.001) and decreased by taurine treatment (2.56±0.10 μmol/g of wet tissue; P<0.001 vs group G; Figure 2).
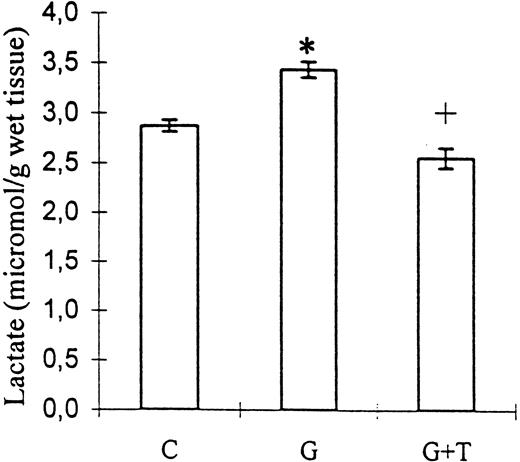
Gpx activity, suppressed by gentamicin administration (2.37±0.15 vs 3.40±0.15 U/g of wet tissue, control; P<0.01), was improved by taurine treatment (3.46±0.16 U/g of wet tissue; P<0.001 vs group G; Figure 3).
SOD activity was decreased in group G but increased in group G+T (12662±577 and 15577±377 U/g of wet tissue, respectively; P<0.01), but neither of these values was significantly different from the control (Figure 4).
HPLC analysis demonstrated that taurine treatment significantly decreased the gentamicin concentration in kidney tissue (Table 2). Although gentamicin has three major components, only two peaks were obtained. Components C1 and C2 were not resolved and both had the same retention time; 8.71 min, whereas C1a had a retention time of 7.80 min. C1a+C1+C2 concentrations in groups G and G+T were 494±93 μg/g wet tissue; n=8 and 233±29 μg/g wet tissue; n=9, respectively (P<0.05; Table 2).
The light microscopic appearance of the proximal tubular injury was graded by the criteria defined by Houghton et al. [18]. In order to support the light microscopic findings, one kidney specimen was selected randomly from each group and was processed for examination by electron microscopy. The light microscopic examination of seven out of eight kidney tissue specimens revealed normal histology, and some desquamation limited to a few tubules was observed in one of the specimens from group C (Table 3). In the randomly selected specimens from group C, normal tubule cells were observed by electron microscopy. There was no mitochondrial swelling or degeneration. Light microscopic examination of the specimens from group G revealed four with grade 2 and four with grade 3 histological changes; but neither of them had total or almost total tubular necrosis areas (Table 3). The necrotic areas, seen particularly in the superficial cortex of these specimens, were apparent in at least half of the tubules and were surrounded by intact and histologically normal tubules (Figure 5A). Additionally, desquamated epithelial cells were observed widely in these necrotic areas. Some vacuolizations were observed in the intact tubular epithelial cells. The findings of light microscopy were supported by the electron microscopic examination of the randomly selected specimens from group G, revealing many myeloid bodies which are seen particularly at the progressive stages of the injury. These myeloid bodies were apparent in the proximal tubular epithelial cells. In addition, mitochondrial swelling and irregular cytoplasm were observed (Figure 5B). Grade 1 histological changes in five, and grade 2 in the other four rats, were detected by the light microscopic examination of the specimens from group G+T (Table 3). Tubular necrotic areas were markedly few and focal compared with those of group G (Figure 5C). Epithelial cellular desquamation and vacuolization were also apparent in this group. By electron microscopy, almost no myeloid bodies were detected compared with group G; however, mitochondrial swelling was observed in group G+T (Figure 5D).
The effect of taurine treatment on gentamicin‐induced TBARS production by rat renal mitochondria. C, control; G, gentamicin; T, taurine. Bars represent the SEM. *P<0.01 vs group C. n=8 for groups C and G, n=9 for group G+T.
The effect of taurine treatment on kidney tissue lactate levels in gentamicin‐induced acute tubular necrosis. C, control; G, gentamicin; T, taurine. Bars represent the SEM. *P<0.001 vs C, +P<0.001 vs group G. n=8 for groups C and G, n=9 for group G+T.
The effect of taurine treatment on kidney tissue Gpx activity in gentamicin‐induced acute tubular necrosis. C, control; G, gentamicin; T, taurine. Bars represent the SEM. *P<0.01 vs group C, #P<0.01 vs group G. n=8 for groups C and G, n=9 for group G+T.
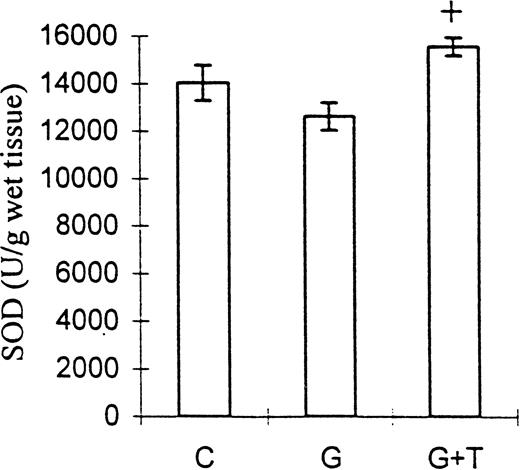
The effect of taurine on kidney tissue SOD activity in gentamicin‐induced acute tubular necrosis. C, control; G, gentamicin; T, taurine. Bars represent the SEM. +P<0.01 vs group G. n=8 for groups C and G, n=9 for group G+T.
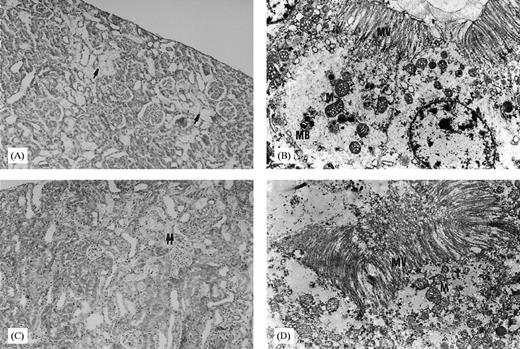
(A) Light microscopy section of the kidneys from rats receiving gentamicin alone (↑: areas of diffused tubular necrosis, haematoxylin–eosin×10). (B) Electron microscopy section of the kidney from a rat receiving gentamicin alone (M; mitochondria; MV; microvilli; MB; myeloid body; lead citrate and uranyl acetate ×6600). (C) Light microscopy section of the kidneys from rats receiving gentamicin+taurine (↑↑: areas of focal tubular necrosis, haematoxylin–eosin×10). (D) Electron microscopy section of the kidney from a rat receiving gentamicin+taurine (M, mitochondria; MV, microvilli; lead citrate and uranyl acetate ×6600).
General animal and laboratory data
| C (n=8) | G (n=8) | G+T (n=9) | |
| Body weight changes (g) | 45.00±2.83 | −10.00±7.08a | 17.89±1.64be |
| Kidney weight/100 g body weight (mg) | 0.82±0.03 | 1.02±0.06c | 1.01±0.04c |
| 24 h urine volume (ml) | 8.81±0.82 | 20.94±2.73b | 9.00±1.46d |
| Serum creatinine (mg/dl) | 0.53±0.02 | 1.06±0.08a | 0.57±0.02d |
| Creatinine clearance (ml/min/100 g body weight) | 0.34±0.02 | 0.21±0.02b | 0.27±0.02 |
| Blood urea nitrogen (BUN) (mg/dl) | 18.88±1.09 | 54.13±6.99a | 25.33±1.87d |
Values represent mean±SEM. C, control; G, gentamicin; T, taurine. aP<0.001, bP<0.01, cP<0.05 vs group C, dP<0.001, eP<0.01 vs group G.
Kidney tissue gentamicin concentrations
| G (n=8) | G+T (n=9) | |
| C1a (μg/g wet tissue) | 289±62.7 | 125±19.4a |
| C1+C2 (μg/g wet tissue) | 205±31.3 | 107±10.1b |
| C1a+C1+C2 (μg/g wet tissue) | 494±93.9 | 233±29.5a |
| G (n=8) | G+T (n=9) | |
| C1a (μg/g wet tissue) | 289±62.7 | 125±19.4a |
| C1+C2 (μg/g wet tissue) | 205±31.3 | 107±10.1b |
| C1a+C1+C2 (μg/g wet tissue) | 494±93.9 | 233±29.5a |
Values represent mean±SEM. G, gentamicin; T, taurine. C1a, C1 and C2 are the components of gentamicin.
aP<0.05, bP<0.01, vs group G.
Histopathological grading obtained from the light microscopic analysis of the kidney sections
| Group | Grade | ||||||||
| 0 | I | II | III | IV | |||||
| C | 7 (87.5%) | 1 (12.5%) | |||||||
| G | 4 (50%) | 4 (50%) | |||||||
| G+T | 5 (55.6%) | 4 (44.4%) | |||||||
| Group | Grade | ||||||||
| 0 | I | II | III | IV | |||||
| C | 7 (87.5%) | 1 (12.5%) | |||||||
| G | 4 (50%) | 4 (50%) | |||||||
| G+T | 5 (55.6%) | 4 (44.4%) | |||||||
C, control; G, gentamicin; T, taurine. Numbers indicate the specimens having the same respective grading criteria in each group; percentages in parentheses indicate the ratio of the respective number to the total.
Discussion
Taurine is a β‐amino acid naturally found in the kidneys [1]. It has been shown that taurine has a protective effect in several tissues [5–7], and serves as an antioxidant agent [2]. In the present study, we aimed to investigate the effect, and to elucidate the mechanism of action of taurine on gentamicin‐induced proximal tubular necrosis, in order to gain new insights into the prophylaxis of gentamicin nephrotoxicity which is a common problem limiting the use of this drug.
Several dosage schemes have been reported for gentamicin administration. We administered gentamicin at the dose of 100 mg/kg/day for 8 days i.p., which is the dosage scheme reported to cause marked nephrotoxicity [10]. Taurine is usually administered to rats orally by adding it to the drinking water [19] or to mice parenterally. Gentamicin causes loss of appetite, and rats may differ in their drinking habits. Therefore, oral intake of taurine can be underestimated. In two studies evaluating the effects of taurine on doxorubicin‐induced cardiotoxicity and carbontetrachloride hepatotoxicity, taurine was administered at the dose of 25 ml/kg i.p. using a 5% solution [20]. In the present study, we preferred to administer taurine 7.5 ml/kg i.p. using a 10% solution, since it is known in renal failure that volume overload could alter the results [21].
Increased catabolism, seen in acute renal failure, results in acidosis which is accompanied by anorexia. Hence, oral food intake decreases and this causes body weight loss [22]. Taurine treatment improved the gentamicin‐induced loss in body weight. However, body weight gain in the G+T group was less than that in control group, suggesting that supplementary energy must be added to the diet.
The increase in the normalized kidney weight of gentamicin‐treated rats probably resulted from the oedema that was caused by drug‐induced acute tubular necrosis. Taurine failed to prevent the oedema caused by gentamicin administration. This finding was also confirmed by the histopathological examination. Electron microscopy examination revealed persistence of mitochondrial swelling and cytoplasmic degeneration in the kidney tissues of taurine‐treated rats. However, there were almost no myeloid bodies compared with the kidney tissues of gentamicin‐treated rats. The light microscopic examination of the specimens from the taurine‐treated rats revealed mild histological changes. Although taurine failed to prevent oedema formation, it appears to be beneficial since it protects the tissue from necrosis. In gentamicin‐treated rats, it can be suggested that taurine protects the subcellular membranes even more than the cellular membrane. Binding of gentamicin to biological membranes is affected by several factors. For example, ischaemia enhances this binding [8], while Ca2+ inhibits it competitively [23,24]. Gentamicin also interacts with the subcellular membranes and structures such as mitochondria, lysosomes and microsomes [8]. Gentamicin also affects membrane fluidity; however, the mechanism of this effect is still unclear. It has been suggested that taurine stabilizes the cell membrane by altering the membrane's cation‐binding characteristics and interacts uniquely with neutral phospholipids of biological membranes [8]. In the present study, we demonstrated that taurine treatment decreased the gentamicin concentration within the kidney tissue, probably by stabilizing the cell membrane and decreasing the amount of gentamicin entering the cell. To our knowledge, this is the first evidence indicating that taurine reduces accumulation of gentamicin within kidney tissue. The beneficial effect of taurine in gentamicin‐induced acute tubular necrosis can be partly explained by this mechanism. On the other hand, Ca2+ has been suggested to prevent critical cellular derangement induced by gentamicin, within the renal tubular cell rather than on its cell surface, and to have a major subcellular effect in preventing gentamicin‐induced renal cell injury [24]. There is considerable evidence that taurine modulates many Ca2+‐dependent processes, and it has been suggested that the taurine–Ca2+ interaction is the main mechanism for the protective effect of taurine. The action of taurine on Ca2+ influx is a pharmacological action which requires higher concentrations of taurine than occur extracellularly [2]. However, the action of taurine on the Ca2+‐releasing intracellular pool is a physiological action which occurs at concentrations of Ca2+ found naturally in the cell [2]. Therefore, we propose that the protective effect of taurine occurs predominantly on the membranes of subcellular organelles, such as lysosomes and mitochondria, as well as on the cytoplasmic membrane.
In the present study, the serum creatinine concentration of gentamicin‐treated rats was significantly higher than that of the control and gentamicin+taurine‐treated rats. In addition, taurine treatment markedly decreased BUN concentration, probably by protecting the kidney tissue from destruction. Creatinine clearance and BUN are used commonly as markers of kidney function. Plasma concentration and 24 h urinary excretion of creatinine are almost constant and not affected by dietary changes, metabolic rate and urine excretion rate. Therefore, serum creatinine concentration, as a marker, is more significant than the BUN level in the earlier phases of kidney disease. On the other hand, BUN begins to rise only after a marked renal parencymal injury occurs. These findings indicate that taurine ameliorates the gentamicin‐induced decrease in kidney function. However, it should be noted that creatinine clearance, rather than of serum creatinine concentration, provides a more reliable evaluation of kidney function, particularly of glomerular filtration. Creatinine clearance should also be normalized to the body weight. Taurine treatment reversed the gentamicin‐induced decrease in the normalized creatinine clearance value; however, this increment was not statistically significant. Nevertheless, the normalized creatinine clearance value of taurine‐treated rats was not different from that of the controls.
A previous study has reported that taurine reduces the increased amount of tissue MDA seen in puromycin aminonucleoside (PAMN)‐induced chronic kidney failure, and protects kidney function [25]. The authors suggested that taurine might lessen oxidizing stress either by forming chloramines, known to be more stable and less reactive molecules, with HOCl and HOCl‐metalloproteins, or by binding to or complexing the sulfonic acid group (
The histopathological findings of this study indicated the tissue protective role of taurine in gentamicin‐induced acute tubular necrosis. By HPLC analysis, we demonstrated that taurine attenuates the amount of gentamicin accumulated within the kidney tissue. The decrease in gentamicin concentration may explain most of the findings of the present study.
In conclusion, we suggest that taurine plays a protective role in gentamicin‐induced acute tubular necrosis by attenuating the concentration of gentamicin accumulated within the kidney tissue and by membrane protection. Additionally, taurine may cause protection through various possible mechanisms: as an organic osmolite; it may increase tissue osmolarity and keep water as a hydroxyl radical scavenger; it may bind free metal ions such as Fe2+ by its sulfonic acid group and form complexes; it may reduce tissue hypoxia and, possibly, induce Gpx and SOD. One or more of these mechanisms may be involved in the tissue‐protective effect of taurine. However, it is still too soon to draw firm conclusions, and several points remain to be clarified by further studies.
Correspondence and offprint requests to: Dr Ayşen Erdem, Department of Physiology, Faculty of Medicine, Hacettepe University, 06100 Ankara, Turkey.
The authors wish to thank Professor Dr Türkan Küçükali (Department of Pathology, Faculty of Medicine, Hacettepe University) for her help during the histopathological examinations of the specimens. This study was supported by Hacettepe University Research Grant (HUAF 97/T01‐101‐001).
References
Wright CE, Tallan HH, Lin YY, Gaull GE. Taurine: biological update.
Wright CE, Lin TT, Syurman JA, Gaull GE. Taurine scavenges oxidized chlorine in biological systems. In Oja SS et al., eds.
Banks MA, Porter WD, Martin WG, Castranova V. Taurine protects against oxidant injury to rat alveolar pneumocytes.
Milei J, Ferreira R, Llesuy S, Forcada P, Covarrubias J, Boveris A. Reduction of reperfusion injury with preoperative rapid intravenous infusion of taurine during myocardial revascularization.
Nakashima T, Taniko T, Kuriyama K. Therapeutic effect of taurine administration on carbon tetrachloride‐induced hepatic injury.
Cronin RE, Henrich WL. Toxic nephropathy. In Brenner BM, Rector FC, eds.
Walker PD, Shah SV. Gentamicin enhanced production of hydrogen peroxide by renal cortical mitochondria.
Walker PD, Shah SV. Evidence suggesting a role for hydroxyl radical in gentamicin‐induced acute renal failure in rats.
Ramsammy LS, Ling KY, Josepovitz C, Levine R, Kaloyanides GJ. Effect of gentamicin on lipid peroxidation in rat renal cortex.
Pariat C, Courtois P, Cambar J, Prior A, Bouquet S. Circadian variation in the renal toxicity of gentamicin in rats.
Uchiyama M, Mihara M. Determination of malondehyde precursor in tissues by thiobarbituric acid test.
Sacks DB. Determination of lactate in whole blood. In Burtis CA, Ashwood ER, eds.
Mccord JM, Fridovich I. Superoxide dismutase. An enzymic function for erythrocuprein (hemocuprein).
Strife RJ, Jardine I, Colvin M. Analysis of the anticancer drugs VP 16‐213 and VM 26 and their metabolites by high‐performance liquid chromatography.
Houghton DC, Plamp Iii CE, Defehr JM, Bennett WM, Porter G, Gilbert D. Gentamicin and tobramycin nephrotoxicity: a morphologic and functional comparison in the rat.
Trachtman H, Futterweit S, Maesaka J et al. Taurine attenuates chronic streptozosin‐induced diabetic nephropathy in rats.
Hamaguchi T, Azuma J, Awata N et al. Reduction of doxorubicin‐induced cardiotoxicity in mice by taurine.
Obatomi DK, Plummer DT. Influence of hydration states on the acute nephrotoxic effect of gentamicin in the rat.
Ali BH, Abdel Gayoum AA, Bashir AA. Gentamicin nephrotoxicity in rat: some biochemical correlates.
Bennet WM, Elliot WC, Houghton DC, Gilbert DN, Defehr J, Mccarron DA. Reduction of experimental gentamicin nephrotoxicity in rats by dietary calcium loading.
Humes HD, Sastrasinh M, Weinberg JM. Calcium is a competitive inhibitor of gentamicin–renal membrane binding interactions and dietary calcium supplementation protects against gentamicin nephrotoxicity.
Trachtman H, Del Pizza R, Futterweit S et al. Taurine attenuates renal disease in chronic aminonucleoside nephropathy.


Comments