


Abstract
Background. Enhanced oxidative stress in haemodialysis (HD) patients may be considered as a risk factor for accelerated atherosclerosis. Reduced antioxidant defences include impairment in enzyme activities and decreased plasma levels of hydrophilic vitamin C (vit C), and cellular levels of lipophilic vitamin E (vit E).
Methods. We investigated plasma levels of vit C in 19 patients undergoing regular haemodiafiltration (HDF) (mean age 62±7 years) and in 1846 healthy elderly subjects (HS) (mean age 69±5 years). The contribution of convection and diffusion was determined using paired filtration dialysis (PFD), a modified HDF technique which physically separates convective from diffusive fluxes. Blood samples were collected before and after the HDF session; in addition at 60 min of HDF, samples were drawn from arterial lines (AL) and venous lines (VL), dialysate (D) and ultrafiltrate (UF). Blood levels of total vit C were determined using an HPLC fluorescence method. Markers of oxidative stress were also assessed in both populations as follows: levels of malondialdehyde (MDA) were determined by fluorometric assay, measurements of advanced oxidation protein products (AOPP) and glutathione peroxidase (GSH‐Px) activity were performed by spectrophotometric assay, and plasma vit E content was obtained by an HPLC procedure.
Results. A significant reduction in plasma vit C level was observed in HDF patients when compared with HS (1.6±1.4 μg/ml in HDF vs 6.6±3.7 μg/ml in HS; P<0.01). The HDF session was associated with a dramatic reduction in vit C levels (1.87±1.57 μg/ml before HDF and 0.98±0.68 μg/ml after HDF); at 60 min of HDF, concentrations were as follows: AL=1.35±1.27 μg/ml; VL=0.37±0.31 μg/ml, D=0.40±0.34 μg/ml, UF=1.24±1.18 μg/ml; corresponding to a diffusive flux of 271 μg/min and a convective flux of 126 μg/min. Total loss of vit C could be assessed at 66 mg/session (8–230 mg/session). According to this loss of vit C, presence of an oxidative stress was demonstrated in HD population as shown by a significant increase in MDA (1.66±0.27 μM in HD vs 0.89±0.25 μM in HS; P<0.01) and AOPP (77.5±29.3 μM in HD vs 23.5±13.2 μM in HS; P<0.01) levels, and a decrease in GSH‐Px activity (259.2±106.3 U/l in HD vs 661.2±92.2 U/l in HS; P<0.01). No change in plasma vit E between both populations (30.7±9.1 μM in HD vs 35.3±7.34 μM in HS) was observed.
Conclusions. These results suggest that HDF with highly permeable membranes is associated with a significant loss of vit C. Diffusive transport is responsible for two‐thirds whereas convective phenomenon accounts for only one‐third of this loss.
Introduction
Oxidative stress, defined as an imbalance between reactive oxygen species (ROS) and antioxidant defence mechanisms, is now well recognized in haemodialysis (HD) patients [1] and represents an important risk factor for cardiovascular diseases. Several markers of oxidative stress have been clearly identified including: (i) lipid oxidation‐derived compounds, malonyldialdehyde (MDA) [2], (ii) advanced oxidation protein products (AOPP) [3] and advanced glycosylation end products (AGE) [4,5], and (iii) increase in LDL susceptibility to ex vivo oxidation [6,7]. Oxidative stress could be explained both by an increase in ROS production and a decrease in defence mechanisms in this population. Periodic contact of blood with the dialysis system contributes to an overproduction of ROS [8,9] by phagocytes, which constitutes a major component of the haemobioincompatibility. This phenomenon could mainly depend on the nature of membranes [8,9] and the possible contamination of dialysate by endotoxins [10,11]. Several antioxidant defence mechanisms also seem to be altered in HD patients: reduction in Cu/Zn superoxide dismutase (SOD) activity in erythrocytes [2] and decreased activity in plasma glutathione peroxidase (GSH‐Px) [12–14]. Furthermore, hydrophilic and lipophilic antioxidant vitamins are altered in uraemia: vitamin E (vit E) levels in erythrocytes and mononuclear cells is low despite normal plasma levels [15–17]; a dramatic depletion of vitamin C (vit C) is also observed [18–20]. Vit E, a well‐known peroxyl scavenger could prevent lipid peroxidation but its antioxidant function has been demonstrated to depend on the presence of vit C or ascorbic acid. This hydrosoluble antioxidant regenerates alpha tocopherol from tocopheroxyl radicals and thus allows maintenance of vit E in its non‐radical reduced form [21].
HD processes—far from improving the imbalance between oxidant and defence mechanisms—could enhance antioxidant deficiency by perdialytic losses of hydrophilic antioxidants [22]. However, the relative importance of convective and diffusive transport in the removal of hydrophilic antioxidants remains unclear. Development of the high flux haemodiafiltration (HDF) technique results in an increased dialysis efficiency by combinating diffusive and convective fluxes, but also contributes to hydrophilic antioxidant losses including vit C. Thus, the present study was designed to investigate vit C losses during HDF sessions and to analyse the relative contribution of convective and diffusive vit C removal determined by using paired filtration dialysis (PFD), a modified HDF technique that physically separates convective from diffusive fluxes.
Subjects and methods
Subjects
Nineteen chronic HD patients, on renal replacement therapy in the Lapeyronie Hospital HD unit for at least 1 year, free of antioxidant supplementation, were included in this study after approval by local ethical committee. Table 1 lists the patient characteristics. Control plasma was obtained from 1846 healthy subjects (HS) aged 60–80 years enrolled into the POLA study [23]. All subjects gave their informed consent according to the declaration of Helsinki. HDF was performed according to the modification by Ghezzi et al. [24] using a double chamber HD (SG 30, Bellco Mirandola, Italy) composed of a polysulfone haemofilter (0.5 m2) and a low flux polysulfone dialyser (1.37 m2). All patients used Multimat proportioning systems incorporating UF control and on‐line production of ultrapure apyrogen substitution fluid (40–65 ml/min) (Bellco) (dialysate flow 500 ml/min). Samples of venous blood, ultrafiltrate (UF), and dialysate (D) were taken during PFD with or without reduction of extracellular fluid (ECF) at t=60 min in order to determine instantaneous clearance as described previously [25]. Samples of arterial blood were taken at t=0, t=60, and t=240 min (see Figure 1). All sampling procedures were conducted in a sterile manner.
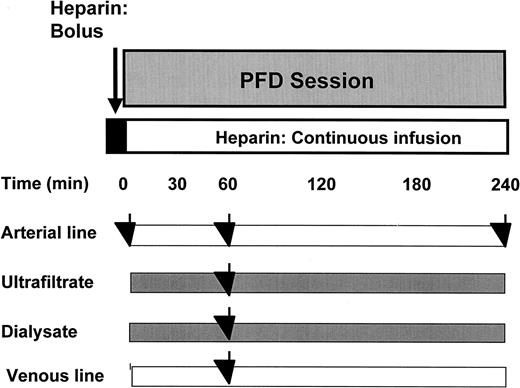
Sampling schedule. Samples of arterial line were drawn at the start and at the end of the HDF session. Moreover, at 60 min of HDF process, samples of AL and VL, D, and UF were taken during PFD with or without reduction of ECF. All sampling procedures were conducted in a sterile manner.
Characteristics of HD subjects
| HD patients (n=19) | HS (n=1846) | |
| Sex ratio | 52.6% | 44.3% |
| (% male) | ||
| Age | 62±7 (32–80) years | 69±5 (60–80) years |
| Time spent | 87±27 (19–218) months | — |
| on HD | ||
| Kt/V | 1.6±0.2 (1.3–1.8) | — |
| HD patients (n=19) | HS (n=1846) | |
| Sex ratio | 52.6% | 44.3% |
| (% male) | ||
| Age | 62±7 (32–80) years | 69±5 (60–80) years |
| Time spent | 87±27 (19–218) months | — |
| on HD | ||
| Kt/V | 1.6±0.2 (1.3–1.8) | — |
Nineteen chronic HD patients on renal replacement therapy (on line post‐dilutional HDF) for at least 1 year were included in this study.
Total plasma vit C determination [26–28]
The technique used let us appreciate total plasma vit C (both reduced and oxidized forms) content. The reduced form is oxidized by excess iodine; resulting dehydroascorbic acid (DHA, oxidized form) is then derivatized with a fluorescent probe (dimethyl‐o‐phenylene‐diamine, DMPD) and finally quantified.
Metaphosphoric acid and sodium thiosulphate were purchased from Prolabo (Paris, France). Ascorbic acid and DMPD were obtained from Sigma (St Quentin Fallavier, France). Iodine and NaH2PO4 (1 H2O) were purchased from Merck Eurolab (Paris, France).
Sample procedure
Blood samples were collected in heparinized vacutainers and immediately centrifuged (1200 g for 10 min at 4°C). In the same manner, dialysate and UF samples were collected 1 h after the start of the session. One volume of plasma or D or UF, respectively, was diluted with 2 vol. of 5% metaphosphoric acid and then was stored at −20°C until use within 3 weeks.
Analytical procedure
Sample derivatization.
Briefly, 25 μl of 0.01 M iodine in 2.7% potassium iodine (KI) salt was added to 125 μl of plasma or standard in order to oxidize reduced form of vit C into DHA. The excess iodine was reduced by adding 50 μl of 0.01 M thiosulfate. Samples were derivatized by 125 μl phosphate buffer (31.75 g NaH2PO4, 1 H2O and 13 ml 4 M NaOH adjusted to 125 ml, pH 5.4), and 50 μl DMPD (10 mg DMPD in 1 ml 1 M HCl diluted to 10 ml). After 10 min centrifugation at 3000 r.p.m., the DHA‐DMPD derivative is stable up to 120 min before injection.
Ascorbic acid standards were freshly prepared daily in 3.3% metaphosphoric acid.
DHA quantification by HPLC‐fluorescence.
The DHA‐DMPD derivative was separated on a HPLC system: the apparatus was equipped with a Lichrocart 125×4 mm column (5 μm particle size) and a Lichrocart 4×4 mm precolumn (5 μm particle size). The mobile phase was 25% H2O/25% methanol/50% phosphate buffer (80 mM, pH 7.4) and the flow rate was 1.3 ml/min. The DHA‐DMPD derivative was detected by Perkin Elmer LS‐3B apparatus (Perkin Elmer Corp., USA) using excitation at 360 nm and emission at 440 nm [27].
The between run reproductibility of the technique is 5%. The within run CV is 2.5, 1.9, and 0.7% for low, medium and high concentrations, respectively.
Vit C fluxes
Fluxes of vit C were assessed according to the convective and diffusive clearance calculated as follows.
(i) Convective clearance:
Kconv=QUF total·S
with QUFtotal=Qinfusion+QUFnet
(S=sieving coefficient; QUF net=weight loss)
Convective flux=Kconv·[artery].
(ii) Diffusive clearance:
Blood compartment
Kb=QB[artery−vein]/[artery]
Dialysate compartment
Kd=[QD−QUF total]·[dialysate]/[artery]
Diffusive flux=Kd·[artery].
Assessment of oxidative stress markers
Oxidative stress markers were determined in HD patients and in a subgroup of the cohort of HS from the POLA study (n=42).
Measurement of malondialdehyde (MDA)
The level of MDA was established using a fluorometric assay [16] initially performed by Yagi [29]. After isolation of lipids by precipitating them with serum protein using phosphotungstic acid, the pellet obtained is incubated at 95°C in presence of thiobarbituric acid (TBA). In this procedure, TBA reacting substances in blood serum are easily removed and the reaction products are measured by fluorometric assay (excitation at 515 nm and emission at 535 nm).
Determination of AOPP
Measurement of plasma AOPP level was performed using technical recommendations described by Witko‐Sarsat et al. [3] and modified by Wratten et al. [30]. Briefly, AOPP were measured by spectrophotometry using a microplate reader (Spectra Kontron, Tecan‐France, Trapes, France) and were calibrated with chloramine‐T (Sigma, St Louis, MO, USA) solutions that in the presence of KI absorb at 340 nm. In test wells, 200 μl of plasma were diluted 1/5 in PBS. In standard wells, 50 μl of 1.16 M KI (Sigma, St Louis, MO, USA) were added to 1 ml of chloramine T solution (0, 10, 30, 50, 70 and 100 μM). A 100 μl aliquot of acetic acid was then added in both test and standard wells. Finally, after a 2 min gentle agitation, absorbance of the reaction mixture was then read at 340 nm by mean of the microplate reader. AOPP concentrations were expressed as micromoles per litre of chloramine‐T equivalents.
Determination of GSH‐Px activity
Plasma GSH‐Px activity was measured by a spectrophotometric assay (Ransel‐Randox, RS 504) derived from Paglia and Valentine method [31] and using a Cobas Mira apparitus (Roche Diagnostic, France).
Assessment of plasma vit E content
Plasma vit E concentrations were measured by high performance liquid chromatography (HPLC) [16] using the material from Waters‐chromatography (Millipore Waters, Les Ulisses, France). Vit E was extracted from plasma in the presence of tocopherol acetate as an internal standard. After centrifugation, the supernatant was separated and extracted with hexane and evaporated until dryness; the dry residue was redissolved in methanol and used for chromatography separation. The HPLC apparatus was equipped with a Novopack 150×3.9 mm column (4 μm particle size, reverse phase) and a spectrophotometric detector (Millipore‐Warters Lambda max 480) with an UV detection at 292 nm.
Expression of results and statistical analysis
Results were expressed as mean values ±SD. Statistical analysis was performed by a Student's t‐test. Values were considered statistically significant for P<0.05.
Results
Vit C levels in HS and HD patients
Figure 2 represents the distribution of control and HD populations with regard to plasma vit C and clearly shows that the plasma vit C level is significantly lower in HD patients than in HS (1.6±1.4 in HD vs 6.6±3.7 μg/ml in HS). Interestingly, HD patient vit C is always ≤6 μg/ml, corresponding to the average of standard population vit C level.
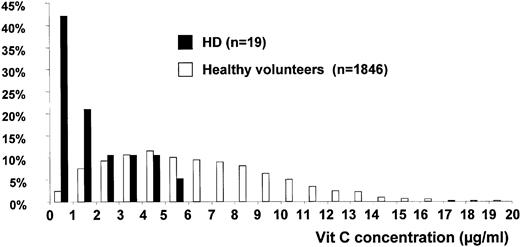
Distribution of controls and HD subjects with regard to vit C concentration 19 chronic HD patients on renal replacement therapy in the Lapeyronie Hospital HD unit for at least 1 year were included in the study. Their plasma vit C content was compared with vit C content of 1846 HS.
HDF‐induced vit C losses
As shown in Figure 3, HDF session is associated with a dramatic reduction of vit C levels: before HDF, the average of blood vit C level is 1.87±1.57 μg/ml while a significantly lower level is observed at the end of the session (0.98±0.68 μg/ml). Vit C levels are two times decreased whereas urea and creatinine are three times reduced (see Table 2). The sieving coefficient average is 1.1±0.32.
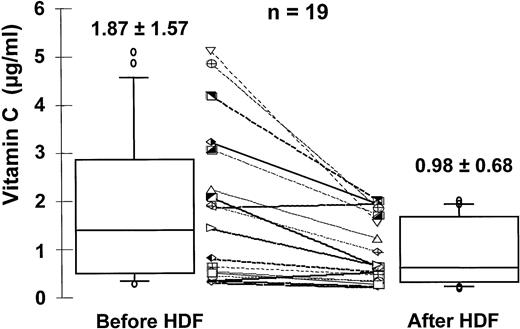
Dialytic losses of vit C (n=19). Blood samples were collected before and after HDF session and total vit C levels were determined using an HPLC fluorescence method.
Vit C dialytic parameters
| Vit C dialytic parameters | |
| Sieving coefficient | 1.1±0.32 |
| Percent reduction | |
| Vit C | 45±14% |
| Urea | 77±6% |
| Creatinin | 69±6% |
| Instantaneous clearance | |
| Diffusive | 240±69 ml/min |
| Convective | 87±26 ml/min |
| Ratio | 0.65±0.10 |
| Vit C losses | 66 mg/HD session (8–230) |
Diffusive and convective losses of vit C
At 60 min of HDF, vit C contents in arterial (AL), venous (VL) lines, D, and UF are as follows: AL=1.35±1.27 μg/ml, VL=0.37±0.31 μg/ml, D=0.40±0.34 μg/ml, and UF=1.24±1.18 μg/ml (see Figure 5).
According to dialysate and UF flows, vit C content in the dialysate corresponds to a diffusive flux of 271 μg/min while UF vit C levels corresponds to a convective flux of 126 μg/min. Moreover, total losses of vit C, estimated from vit C instantaneous clearance at t=60 min, are directly related to initial values. Indeed, a strong correlation (R2=0.88, P<0.001) is obtained between total vit C losses and initial levels (see Figure 4).
The total loss of vit C, assessed by instantaneous clearance, represents a 66 mg/session average (8–230 mg/session) corresponding to a 200mg loss/week (see Table 2).
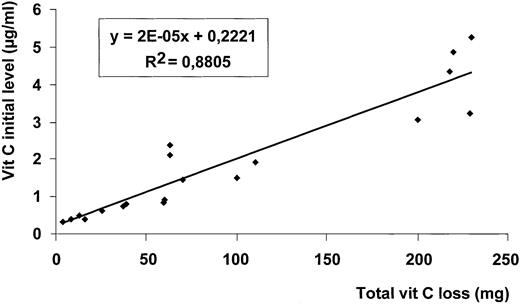
Correlation between total vit C loss and initial level of vit C. Initial plasma level of vit C (at the start of HDF session) was correlated to the plasma total loss of vit C (assessed at t=60 min).
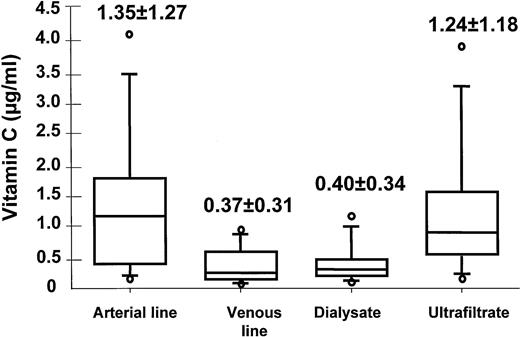
Convective and diffusive losses of vit C during HDF session (n=19). At 60 min of HDF, vit C contents in AL, VL, D, and UF were assessed. According to dialysate and UF flow, vit C content in the dialysate corresponded to a diffusive flux of 271 μg/min while UF vit C level corresponded to a convective flux of 126 μg/min. A total loss of vit C could be assessed at 66 mg/session (8–230).
Oxidative stress markers
Table 3 summarizes results of oxidative stress markers in HD vs HS subjects and clearly demonstrates existence of an oxidative stress in HD population compared with HS as shown by significant increases in MDA (1.66±0.27 μM in HD vs 0.89±0.25 μM in HS; P<0.01) and AOPP (77.5±29.3 μM in HD vs 23.5±13.2 μM in HS; P<0.01) levels, and decrease in GSH‐Px activity (259.2±106.3 U/l in HD vs 661.2±92.2 U/l in HS; P<0.01). No change in plasma vit E between both populations (30.7±9.1 μM in HD vs 35.3±7.34 μM in HS) is observed.
Markers of oxidative stress and antioxidant status
| HD patients (n=19) | HS (n=42) | |
| MDA (μM) | 1.66±0.27 | 0.89±0.25* |
| AOPP (μM) | 77.5±29.3 | 23.5±13.2* |
| GSH‐Px activity (U/l) | 259.2±106.3 | 661.2±92.2* |
| Vit E (μM) | 30.7±9.1 | 35.3±7.34 |
| Vit C (μg/ml) | 1.87±1.57 | 7.70±4.38* |
| HD patients (n=19) | HS (n=42) | |
| MDA (μM) | 1.66±0.27 | 0.89±0.25* |
| AOPP (μM) | 77.5±29.3 | 23.5±13.2* |
| GSH‐Px activity (U/l) | 259.2±106.3 | 661.2±92.2* |
| Vit E (μM) | 30.7±9.1 | 35.3±7.34 |
| Vit C (μg/ml) | 1.87±1.57 | 7.70±4.38* |
Markers of oxidative stress (MDA; AOPP) and plasma antioxidant status (GSH‐Px activity; vit E and vit C content) were compared between the HD population (n=19) and a cohort of HS (n=42) enrolled into the POLA study group. Results were expressed as mean values ±SD. Differences between HD and HS were analysed by a Student's t‐test. Values were considered statistically significant for *P<0.05.
Discussion
Our study clearly shows that during a HDF session with highly permeable membranes, a diffusive transport is responsible for two‐thirds of the significant vit C loss whereas convective phenomenon only accounts for one‐third. Thus, HF, a non‐selective clearing process solely based on molecular weight and hydrophilic binding of solutes, induces solute losses involving both waste products and essential substances including vit C. Therefore, it appears that increased dialysis efficiency and an enlarged spectrum of solute removal by convective clearance, two highly desirable options for improving dialysis adequacy, enhance antioxidant losses.
Böhm et al. [22] investigating the vit C status of HD patients, also demonstrated that dialysis treatment was associated with a plasma vit C decrease to approximatively 50% of the baseline values. Moreover, they reported the time‐dependent analysis of the dialysate of three patients which resulted in a continuous decrease of their vit C concentration. In total agreement with their data, our findings demonstrate that the plasma vit C concentration was significantly reduced at the end of HDF session. Moreover, the higher plasma vit C concentration at the start of session, the more important was the vit C loss during the HDF process leading in all cases to a drastic vit C depletion at the end of the session. PFD technique let us appreciate not only the magnitude of the vit C loss during HD treatment but also the relative contribution of convective (one‐third) and diffusive (two‐thirds) removal of vit C.
These findings strongly suggest that an adequate supplementation in vit C could be useful to prevent partly HD‐induced oxidative stress. However, this supplementation must be correctly assessed in order to be effective without causing side effects such as oxalosis. Indeed, oxalosis appears as a potential risk in HD patients treated with excessive ascorbic acid [32,33]. In addition, Bakaev et al. [34] reporting low levels of dehydroascorbic and ascorbic acid in uraemic serum before HD session also observed a pronounced increase of dehydroascorbic acid (oxidized form of ascorbic acid) levels during HD session, probably based on a ROS overproduction by phagocytes. This increased rate of vit C oxidation during dialysis session has been recently confirmed by Clermont et al. [35]. According to the data, it is essential to accurately estimate the vit C requirement for HD population: a daily dose of 100–200 mg is recommended in some reports [19,20,36]. Costello et al. [33] reported that oral supplementation not exceeding 150 mg/day (1050 mg weekly) was still considered a safe dose. This supplementation overwhelms our estimation of 200 mg weekly of vit C losses which does not take into account the potential contribution of dietary restriction or intestinal malabsorption. However, it is interesting to note that vit C losses are directly linked to plasma levels. Thus, an important supplementation at the end of dialysis session could lead to a transient increase in vit C which could be abolished during the next HD session. Thus, it would be better to supply vit C by dialysate during HD session. Among different vit C delivery options, haemolipodialysis, an innovative concept that consists in loading patients with vit E and C via the extracoporeal circuit could be an appropriate way for improving the antioxidative status of HD patients [37,38]. This technique might allow a steady state of vit C concentrations between both compartments leading then to maintenance of vit C levels during the session.
Correspondence and offprint requests to: Prof. Jean‐Paul Cristol, Biochemistry, Lapeyronie University Hospital, 371 Av Doyen G. Giraud, F‐34295 Montpellier, France. Email: jp‐cristol@chu‐montpellier.fr
References
Loughrey CM, Young IS, Lightbody JH, McMaster D, McNamee PT, Trimble ER. Oxidative stress in haemodialysis.
Paul JL, Sall ND, Soni T et al. Lipid peroxidation abnormalities in hemodialyzed patients.
Witko‐Sarsat V, Friedlander M, Capeillere‐Blandin C et al. Advanced oxidation protein products as a novel marker of oxidative stress in uremia.
Vlassara H. Serum advanced glycosylation end products: a new class of uremic toxins?
Maggi E, Bellazzi R, Falaschi F et al. Enhanced LDL oxidation in uremic patients: an additional mechanism for accelerated atherosclerosis?
Panzetta O, Cominacini L, Garbin U et al. Increased susceptibility of LDL to in vitro oxidation in patients on maintenance hemodialysis: effects of fish oil and vitamin E administration.
Himmelfarb J, Lazarus M, Hakim R. Reactive oxygen species production by monocytes and polymorphonuclear leukocytes during dialysis.
Cristol JP, Canaud B, Rabesandratana H, Gaillard I, Serre A, Mion C. Enhancement of reactive oxygen species production and cell surface markers expression during hemodialysis.
DeLeo F, Renee J, Cormick SM, Nakamura M, Apicella M, Weiss J. Neutrophils exposed to bacterial lipopolysaccharide upregulate NADPH oxidase assembly.
Kumano K, Yokota S, Nanbu M, Sakai T. Do cytokine‐inducing substances penetrate through dialysis membranes and stimulate monocytes?
Saint‐Georges M, Bonnefont D, Bourely B et al. Selenium deficiency correction in haemodialyzed patients.
Takahashi K, Newburger P, Cohen H. Glutathione peroxidase protein: absence in selenium deficiency and correlation with enzymatic activity.
Richard M, Arnaud J, Jurkovitz C et al. Trace elements and lipid peroxidation abnormalities in patients with chronic renal failure.
Giardini O, Taccone‐Gallucci M, Lubrano R et al. Effects of alpha‐tocopherol administration on red blood cell membrane lipid peroxidation in hemodialysis patients.
Cristol JP, Bosc JY, Badiou S, Leblanc M, Lorrho R, Descomps B, Canaud B. Erythropoietin and oxidative stress in haemodialysis: beneficial effects of vitamin E supplementation.
Pastor M, Sierra C, Bonal J, Teixido J. Serum and erythrocyte tocopherol in uremic patients: effect of hemodialysis versus peritoneal dialysis.
Taccone‐Gallucci M, Giardini O, Ausiello C et al. Vitamin E supplementation in hemodialysis patients: effects on peripheral blood mononuclear cells lipid peroxidation and immune response.
Sullivan J, Eisenstein A. Ascorbic acid depletion in patients undergoing haemodialysis.
Descombes E, Hanck A, Fellay G. Water soluble vitamin in chronic hemodialysis patients and need for supplementation.
Galli F, Canestrari F, Buoncristiani U. Biological effects of oxidative stress in hemodialysis: the possible roles of vitamin E.
Bohm V, Tiroke K, Schneider S, Sperschneider H, Stein G, Bitsch R. Vitamin C status of patients with chronic renal failure, dialysis patients and patients after renal transplantation.
Delcourt C, Cristol JP, Tessier F, Leger CL, Descomps B, Papoz L. Age‐related macular degeneration and antioxidant status in the POLA study. POLA Study Group. Pathologies Oculaires Liees a l'Age.
Ghezzi PM, Frigato G, Fantini GF et al. Theoretical model and first clinical results of the paired filtration‐dialysis (PFD).
Canaud B, Bosc JY, Vaussenat F et al. Quantitation in hemodialysis: adequacy measurement revisited.
Lopez‐Anaya A, Mayersohn M. Ascorbic and dehydroascorbic acids simultaneously quantified in biological fluids by liquid chromatography with fluorescence detection, and comparison with a colorimetric assay.
Tessier F, Birlouez‐Aragon I, Tjani C, Guilland JC. Validation of a micromethod for determining oxidized and reduced vitamin C in plasma by HPLC‐fluorescence.
Birlouez‐Aragon I, Delcourt C, Tessier F, Papoz L. Associations of age, smoking habits and diabetes with plasma vitamin C of elderly of the POLA study.
Yaggi K. A simple fluorometric assay of lipoperoxide in blood plasma.
Wratten ML, Sereni L, Tropea F, Tetta C. Hemolipodialysis removes hydrophobic toxins and reduces oxidative stress in an in vitro model system.
Paglia D, Valentine WN. Studies on the quantitative and qualitative characterisation of erythrocyte glutathione peroxidase.
Pru C, Eaton J, Kjellstrand C. Vitamin C intoxication and hyperoxalemia in chronic hemodialysis patients.
Costello J, Sadovnic M, Cottington E. Plasma oxalate levels in hemodialysis patients despite decreased oxalate removal.
Bakaev V, Efremov A, Tityaev I. Low levels of dehydroascorbic acid in uraemic serum and the partial correction of dehydroascorbic acid deficiency by haemodialysis.
Clermont G, Lecour S, Cabanne J et al. Vitamin E‐coated dialyzer reduces oxidative stress in hemodialysis patients.
Pönkä A, Kuhlbäck B. Serum ascorbic acid in patients undergoing chronic hemodialysis.


Comments