-
PDF
- Split View
-
Views
-
Cite
Cite
Allen Rodgers, Shameez Allie-Hamdulay, Graham Jackson, Therapeutic action of citrate in urolithiasis explained by chemical speciation: increase in pH is the determinant factor, Nephrology Dialysis Transplantation, Volume 21, Issue 2, February 2006, Pages 361–369, https://doi.org/10.1093/ndt/gfi211
Close - Share Icon Share
Abstract
Background. The therapeutic action of citrate in the management of calcium oxalate urolithiasis has been attributed to the depletion of free calcium ions by complexation of the latter by citrate itself. However, little attention has been given to the nature of such complexes and the chemical conditions which control their formation because it is very difficult to measure them in solution. We therefore modelled the theoretical formation of these complexes in urine following administration of a citrate-containing preparation, using a powerful speciation program, JESS (Joint Expert Speciation System), which has been widely used to model metal–ligand equilibria in biological systems but which has hitherto not been applied in urolithiasis research. This program has an extensive database of thermodynamic constants and is able to calculate mixed ligand speciation.
Methods. Urine data obtained before and after citrate administration in four groups of subjects (male and female normals and stone formers) were used as input for JESS to calculate the speciation of calcium, citrate and oxalate. The program was also used to examine the effects of varying different urinary components on the nature and concentration of the various species.
Results. The speciation predicted the formation of a key calcium–citrate–phosphate species (previously unreported in urolithiasis research), which accounts for a significant percentage of the complexation of the free calcium. Moreover, the formation of this complex was found to be dependent on an increase in urinary pH rather than on an increase in urinary citrate concentration per se.
Conclusion. The therapeutic action of citrate in the management of calcium oxalate urolithiasis is due to the formation of a pH dependent calcium–citrate–phosphate complex which reduces the concentration of the free calcium ion species, thereby reducing the risk of stone formation.
Introduction
Several previous studies involving citrate-containing preparations in the treatment of calcium oxalate (CaOx) urolithiasis have demonstrated a decrease in the relative supersaturation (RS) of this urinary salt [1–5]. In all of these studies, the decrease in RS has been attributed to a decrease in concentration of the free calcium ions, supposedly caused by complexation of the latter by citrate. Indeed, this concept was first mooted over 25 years ago [6]. However, little attention has been focused on the nature of the calcium–citrate complex (or complexes), nor has there been any investigation of the urinary chemical factors which might influence the formation and concentration of such complexes.
Crystallization processes, whether in urine or aqueous solution, depend on the chemical speciation, i.e. the concentration and form of every complex present in the solution. Speciation data can be generated by sophisticated computer programs, which have substantial databases of equilibrium constants and solubility products. An example of such a program is EQUIL [7], which has been extensively used in urolithiasis research. Despite its huge success in calculating RS values for CaOx, CaP and uric acid, its database is limited and it does not give the concentrations of individual species in solution.
JESS (Joint Expert Speciation System) [8,9] is a speciation program which has not been previously used in urolithiasis research. This program has a database of over 12 000 thermodynamic constants (including solubility products), which can be used to model chemical speciation under many different conditions including ionic strength and temperature. It has been widely used to model metal–ligand equilibria in biological systems such as saliva [10], wound fluid [11], gastrointestinal tract [12] and duodenum [13], and has also been used to predict the solubility of CaOx hydrates [14] and cystine [15] at different pH in artificial urine. JESS has several features which make it more powerful than EQUIL. Besides its far more comprehensive database, it is able to calculate mixed ligand speciation. In addition, it has a scan facility which allows solution parameters to be varied automatically and systematically to assess the effects on speciation. JESS employs an iterative process in which thermodynamic constants are continually adjusted to match the ionic strength of the final equilibrium solutions. The JESS program can be obtained from Peter May (e-mail address: may@murdoch.edu.au).
In a previous study of ours, involving 120 subjects, a sodium–citrate–bicarbonate–tartrate complex (CitroSoda, Adcock Ingram, South Africa) was administered to controls and to CaOx stone formers of both genders [16]. EQUIL was used to calculate RS for CaOx, uric acid and brushite. Values for CaOx and for uric acid decreased significantly in all four groups, while the value for brushite was unaffected except in female stone formers where it increased significantly. The objective of the present study was to apply JESS to the urine data obtained in the CitroSoda study, in an attempt to identify the species responsible for causing the decrease in RS CaOx and to investigate the urinary factors which influence their formation.
Subjects and methods
Urinary data obtained in our previous study [16] are given in Tables 1 and 2. These data (excluding RS values) were used as input for JESS, to determine the speciation of calcium, citrate and oxalate. Thereafter, the scan feature of the program was implemented to investigate the effect of varying the concentrations of these components and pH on the percentage concentrations of each of the complexes identified in the speciation determination.
Urine parameters and relative supersaturations in male controls and male stone formers [16]
| Parameter . | Controls . | . | Stone Formers . | . | ||
|---|---|---|---|---|---|---|
| . | Baseline . | Post Cit . | Baseline . | Post Cit . | ||
| . | Mean±SE . | Mean±SE . | Mean±SE . | Mean±SE . | ||
| pH | 6.40±0.07 | 7.35±0.09 | 6.07±0.06 | 7.04±0.09 | ||
| Volume (ml/24 h) | 1477±78 | 1497±105 | 1364±76 | 1371±106 | ||
| Citrate (mmol/24 h) | 2.95±0.21 | 3.68±0.28 | 2.40±0.20 | 3.10±0.28 | ||
| Oxalate (mmol/24 h) | 0.16±0.01 | 0.14±0.01 | 0.18±0.01 | 0.12±0.01 | ||
| Calcium (mmol/24 h) | 3.33±0.23 | 2.40±0.31 | 3.26±0.22 | 2.16±0.31 | ||
| Magnesium (mmol/24 h) | 4.96±0.27 | 4.42±0.36 | 2.60±0.26 | 2.38±0.36 | ||
| Sodium (mmol/24 h) | 222.7±18.6 | 253.9±25.0 | 188.8±17.9 | 241.5±25.0 | ||
| Potassium (mmol/24 h) | 47.24±5.47 | 49.06±7.36 | 61.19±5.29 | 64.72±7.36 | ||
| Urate (mmol/24 h) | 3.49±0.16 | 3.48±0.22 | 3.43±0.16 | 3.86±0.22 | ||
| Phosphate (mmol/24 h) | 29.39±1.51 | 27.98±2.03 | 30.96±1.46 | 28.72±2.03 | ||
| Chloride (mmol/24 h) | 155.0±10.3 | 134.0±13.8 | 168.8±9.9 | 156.4±13.8 | ||
| RS brushite | 1.36±0.11 | 1.33±0.23 | 1.10±0.11 | 1.04±0.16 | ||
| RS uric acid | 0.97±0.16 | 0.18±0.26 | 1.91±0.16 | 0.32±0.23 | ||
| RS CaOx | 2.04±0.26 | 1.34±0.43 | 3.16±0.18 | 1.15±0.26 | ||
Urine parameters and relative supersaturations in female controls and female stone formers [16]
| Parameter . | Controls . | . | Stone formers . | . | ||
|---|---|---|---|---|---|---|
| . | Baseline . | Post Cit . | Baseline . | Post Cit . | ||
| . | Mean±SE . | Mean±SE . | Mean±SE . | Mean±SE . | ||
| pH | 6.42±0.07 | 7.50±0.09 | 6.33±0.07 | 7.16±0.09 | ||
| Volume (ml/24 h) | 1674±70 | 1896±96 | 1304±72 | 1323±96 | ||
| Citrate (mmol/24 h) | 2.91±0.17 | 3.90±0.23 | 2.47±0.17 | 3.17±0.23 | ||
| Oxalate (mmol/24 h) | 0.20±0.01 | 0.15±0.01 | 0.17±0.01 | 0.14±0.01 | ||
| Calcium (mmol/24 h) | 1.98±0.17 | 1.62±0.23 | 3.08±0.17 | 2.60±0.23 | ||
| Magnesium (mmol/24 h) | 2.37±0.15 | 2.55±0.21 | 2.18±0.16 | 1.86±0.21 | ||
| Sodium (mmol/24 h) | 101.2±13.9 | 252.3±19.0 | 131.7±14.2 | 140.8±19.0 | ||
| Potassium (mmol/24 h) | 42.92±3.40 | 32.90±4.65 | 40.32±3.46 | 36.54±4.66 | ||
| Urate (mmol/24 h) | 2.75±0.13 | 2.98±0.18 | 2.90±0.13 | 2.66±0.17 | ||
| Phosphate (mmol/24 h) | 19.36±1.08 | 19.13±1.53 | 20.55±1.10 | 20.70±1.48 | ||
| Chloride (mmol/24 h) | 111.1±7.2 | 125.1±10.2 | 122.1±7.3 | 97.9±9.8 | ||
| RS brushite | 0.79±0.12 | 0.52±0.17 | 0.93±0.12 | 1.40±0.17 | ||
| RS uric acid | 0.78±0.14 | 0.06±0.21 | 1.70±0.14 | 0.48±0.21 | ||
| RS CaOx | 2.22±0.22 | 0.61±0.32 | 3.29±0.22 | 2.13±0.31 | ||
Results
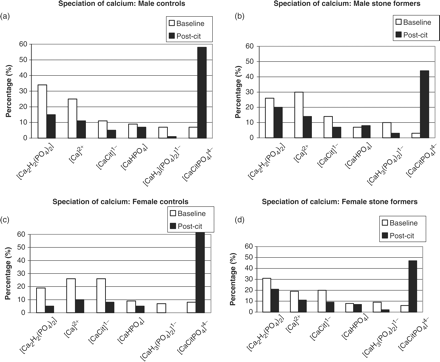
The speciation of calcium in the urine of the four groups is presented in Figure 1(a)–(d). In these figures, as well as in all subsequent figures, only those species which account for more than 1% of the speciation are presented. Attention is drawn to the dramatic increase in all groups of the percentage of the species [CaCitPO4]4− following administration of CitroSoda. Complexation of calcium in this species causes a decrease in Ca2+; the latter would otherwise have been available for binding by anionic species such as oxalate and phosphate. Indeed, compensation for the loss of calcium in the formation of [CaCitPO4]4− is reflected in the decrease in the percentage of Ca2+ and in the decreases in the percentages of all of the other calcium-containing species. Notable among the latter are [Ca2H2(PO4)2] and [CaHPO4] (brushite).
Speciation of calcium: (a) male controls; (b) male stone formers; (c) female controls; (d) female stone formers. Formulae for the different species in all the figures have been written in square brackets and the overall charge has been indicated as a superscript, in accordance with the standard format of IUPAC (International Union of Pure and Applied Chemistry). Cit: citrate (−3) ion. Ox: oxalate (−2) ion.
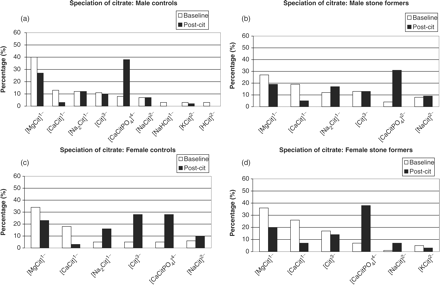
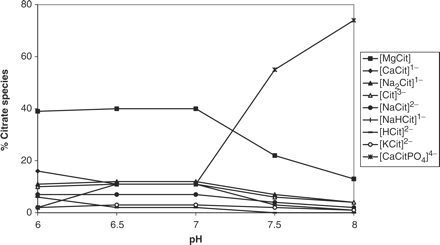
The speciation of citrate in the urine of the four groups is presented in Figure 2(a)–(d). As expected from the calcium speciation [Figure 1(a)–(d)], increases in the percentage of [CaCitPO4]4− are observed in all of the groups following administration of CitroSoda. It is noted that the complexation of citrate into [CaCitPO4]4− is compensated by decreases in the percentages of [MgCit]1− and [CaCit]1−.
Speciation of citrate: (a) male controls; (b) male stone formers; (c) female controls; (d) female stone formers.
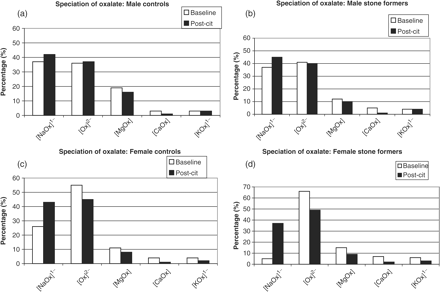
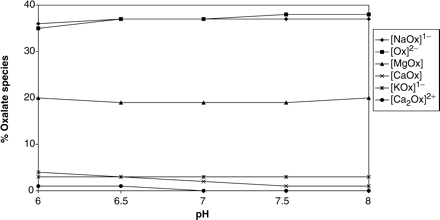
The speciation of oxalate in the urine of the four groups is presented in Figure 3(a)–(d). It is noted that the percentage of [CaOx] decreases in all the groups following therapy. We have already drawn attention to the decrease in free [Ca2+] in all of the groups [Figure 1(a)–(d)], but we now note that in female subjects [Ox2−] also decreases significantly [Figure 3(c) and (d)]. This arises mainly from increases in the formation of [NaOx] which utilizes free [Ox2−]. On the other hand, in male subjects [Ox2−] hardly changes. Indeed, the increase in the formation of [NaOx] occurs to a lesser extent than in females. Interestingly, these observations suggest that, in males, the decrease in [CaOx] is due to the decrease in free [Ca2+] alone rather than a decrease in both [Ca2+] and [Ox2−], as occurs in females. Attention is drawn to the fact that [CaOx] represents a small percentage of the oxalate speciation.
Speciation of oxalate: (a) male controls; (b) male stone formers; (c) female controls; (d) female stone formers.
Since the speciation for calcium, citrate and oxalate were very similar in the four groups (Figure 1vsFigure 2vsFigure 3), the male control group was arbitrarily selected as being representative of all of them. Accordingly, the data for only this group were used for the next part of the study in which JESS was programmed to systematically scan (i.e. vary) calcium, citrate and oxalate concentrations as well as pH values and to produce plots of the percentage of each citrate species as a function of these variables. In each case, the scan range was defined by the lowest and highest of the empirically determined values for each variable in Table 1 (calcium: 0.22–10.97 mmol/24 h, citrate: 0.42–7.13 mmol/24 h, oxalate: 0.04–0.31 mmol/24 h). For pH, the empirical range was from 6.07 to 7.50 but an additional point at pH 8 was included in the model. The results (not presented here) showed that varying the concentration of urinary calcium, citrate and oxalate had no effect on the percentage distribution of [CaCitPO4]4− or any other citrate species. It should be noted that, while the absolute quantities of individual complexes such as [CaCitPO4]4− change, their percentage contribution to all of the citrate species remains constant. It is not possible to identify a limiting factor within the scan range which we investigated. However, if the concentrations of calcium, citrate and oxalate were to be extended beyond the empirically observed range, any one of the components in the urine could become limiting.
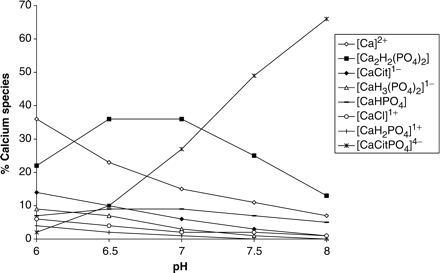
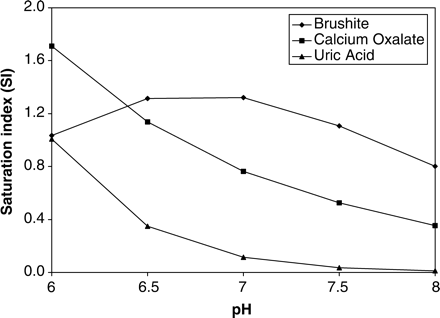
Although calcium, citrate and oxalate concentrations had no effect on the percentage distribution of [CaCitPO4]4−, increasing the pH resulted in a significant increase in the percentage of [CaCitPO4]4− and a concomitant decrease in [MgCit] (Figure 4). Having obtained this result for the speciation of citrate as a function of pH, we used JESS to also calculate the speciation of calcium and oxalate as a function of pH (Figures 5 and 6, respectively). In Figure 5, attention is drawn to the decreases in the percentages of free [Ca]2+, [Ca2H2(PO4)2] and [CaHPO4] (brushite) and the increase in the percentage of [CaCitPO4]4−. In Figure 6, attention is drawn to the decrease in the percentage of [CaOx]. We also used JESS to calculate the variation in the ‘solubility index’ (SI) as a function of pH. SI values are calculated according to the same physicochemical principles as RS values generated by EQUIL. However, the two programs utilize different speciation concentrations which are generated by their different databases. The results (Figure 7) show that SI values for calcium oxalate and uric acid decrease steadily with increasing pH over the entire range which was scanned (i.e. pH 6.0 to 8.0), while SI for brushite increases in the pH range 6.0–7.0 but decreases thereafter. All of these observations are consistent with the speciation results described above.
Discussion
Simple physicochemical principles dictate that the RS of CaOx will decrease if the concentration of the unbound calcium or oxalate ions, or both, decreases. Speciation calculations by JESS inform us that there is a large number of complexes involving these two ions which exist in equilibrium in urine. Thus, any decrease in the concentration of these ions, caused by their incorporation into complexes in solution, will cause a decrease in RS CaOx and must be compensated for by concomitant increases in the concentrations of other species in which these ions are bound. In this context, the JESS computations have predicted the formation of a key species, [CaCitPO4]4−, the concentration of which increased from 5–60% in all four groups after administration of citrate (Figure 1). This species is reminiscent of the phosphocitrate inhibitor proposed by Sallis and co-workers [17] as a possible therapeutic agent in post-operative management of patients with a history of stone recurrence. Formation of [CaCitPO4]4− arises as a result of deprotonation of
Of interest is the observation that all of these inter-related changes are controlled by pH. The result assumes clinical significance when consideration is given to the fact that the pH range in which the concentration of [CaCitPO4]4− is sensitive, corresponds to the empirically observed pH range (6.07–7.50) following administration of CitroSoda. Thus, it can be concluded that the observed decrease in RS CaOx in all four groups following administration of CitroSoda can be attributed to the increase in urinary pH, which facilitates the formation of [CaCitPO4]4−. This finding supports the results of a study which concluded that raised urinary citrate (by itself) did not alter RS CaOx [18].
Of further interest is the observation in the present study that the percentage [CaHPO4] (brushite) in the speciation of calcium decreased after administration of CitroSoda (Figure 1). More importantly, SI values (Figure 7) for this complex decrease with increasing pH in the empirically observed pH range 6.40–7.35 (male controls, Table 1), thereby providing strong evidence of a reduction in the risk of its deposition. This should allay to some extent the frequently expressed concern that brushite crystal (and stone) formation might be an unfavourable consequence of citrate therapy in which pH is allowed to increase [1–5]. Nevertheless, caution should be exercised regarding the safety of raising the pH in brushite stone formers until such time that the predictions made by JESS are confirmed clinically.
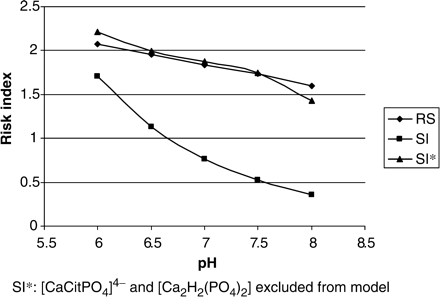
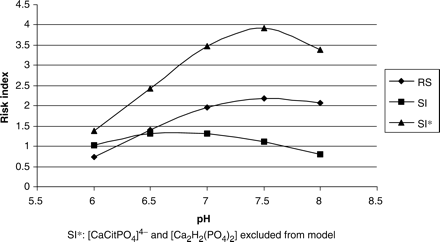
Interestingly, the EQUIL output using the same data, demonstrated that RS for BRU would be unaffected (male controls, Table 1). Thus, there appears to be an apparent conflict between EQUIL and JESS. This raises the important issue of providing evidence for the validation of the predictions made by JESS. The EQUIL program has been the gold standard for calculating relative supersaturation values in many studies during the past 20 years. As such, if stone researchers are to be persuaded that JESS might be a superior alternative, evidence in support of this needs to be provided. We therefore compared RS values from EQUIL with SI values from JESS for both calcium oxalate and brushite (Figures 8 and 9, respectively). The aforementioned conflict between the output of the two programs is apparent. However, we contend that JESS is able to include in its computations, species which are not accounted for by EQUIL. In the present study, Figure 5 demonstrates the existence of two species – [CaCitPO4]4− and [Ca2H2(PO4)2] – both of which seem to be key role players in determining calcium speciation and both of which are absent from the EQUIL database. As such, EQUIL does not assign any of the free calcium ions to the formation of these complexes and will therefore generate RS values for calcium oxalate and brushite, which are higher than the SI values obtained from JESS, as shown in Figures 8 and 9. In order to test this hypothesis, we omitted these complexes from the JESS database and recalculated SI values for calcium oxalate and brushite. The results are provided in Figures 8 and 9. Excellent agreement between RS (EQUIL) and the newly calculated SI (JESS) values for CaOx is now apparent (Figure 8). Although absolute values for brushite do not agree, a parallel trend between the two programs is indicative of qualitative agreement (Figure 9). The quantitative discrepancy for brushite could be a consequence of outdated thermodynamic constants in EQUIL or the absence of minor species in the latter. Nevertheless, despite this discrepancy, we believe that the results satisfactorily validate the credibility of JESS in the context of calculating urinary speciation and supersaturation.
RS (EQUIL) and SI (JESS) values for calcium oxalate as a function of pH.
RS (EQUIL) and SI (JESS) values for brushite as a function of pH.
Formation of other calcium phosphate complexes such as octacalcium phosphate (OCP), tribasic calcium phosphate (TCP) and hydroxyapatite (HAP) are also feared as pH increases. Indeed, we have calculated SI values for each of these in the pH range 6–8 and have found that they increase significantly as the pH increases (OCP: 4.9×100 to 1.4×10⁶; TCP: 2.1×100 to 1.8×10⁵; HAP: 1.7×10⁵ to 3.7×10¹⁴). Thus, there is an increased risk of phosphate stone formation as the pH increases. However, when our model was altered to accommodate higher urinary citrate values (which would arise from citrate therapy), the aforementioned increases in SI values were attenuated to some extent. Nevertheless, the increases need to be noted here and will be investigated in further studies when we refine our urine model.
In our clinical study [16], RS uric acid (as determined by EQUIL) decreased significantly after administration of CitroSoda (Tables 1 and 2). In Figure 7, JESS predicts that this effect would occur as a consequence of the increase in urinary pH.
CitroSoda contains tartaric acid. Since tartrate is able to complex free calcium ions [19], it could affect the speciation if it is eliminated unchanged in the urine following administration of CitroSoda. Unfortunately, we did not analyze our urines for this anion. Therefore, in order to test this possibility, JESS was used to re-calculate the calcium, oxalate and citrate speciation as a function of pH, using the same urine model as before (i.e. compositional data from male controls), except that tartrate at a concentration of 0.1 mM was included. The results showed that despite the formation of a calcium–tartrate complex, speciation as depicted in Figures 4, 5 and 6 was not significantly affected. In particular, the percentage of the calcium speciation due to the formation of the calcium–tartrate complex did not increase with increasing pH as was the case with [CaCitPO4]4−.
Notwithstanding the possible effects of tartrate, our urine model (in which we excluded this component), is similar to that obtained in studies involving other citrate-containing therapeutic preparations. However, certain differences exist. Firstly, our urine model does not include
The results of this study have shown that the therapeutic action of citrate might be attributed to a significant decrease in the concentration of free calcium ions due to complexation of the latter in a calcium–citrate–phosphate complex and that, most importantly, the formation of this complex depends on an increase in pH rather than an increase in citrate concentration per se. This could have important ramifications in terms of developing new strategies for the administration of current citrate-containing therapeutic agents and also in terms of developing new citrate-based preparations themselves.
The authors wish to thank the South African National Research Foundation (NRF), the South African Medical Research Council and the University of Cape Town for financial support. The authors also wish to thank Ms Emma Hager for her assistance with some of the computations.
Conflict of interest statement. None declared.
References
Preminger GM, Sakhaee K, Pak CYC. Alkali action on the urinary crystallization of calcium salts: contrasting responses to sodium citrate and potassium citrate.
Berg C, Larsson L, Tiselius H-G. Effects of different doses of alkaline citrate on urine composition and crystallization of calcium oxalate.
Pak CYC, Koenig K, Khan R, et al. Physicochemical action of potassium-magnesium citrate in nephrolithiasis.
Ogawa Y. Impact of sodium-potassium citrate on the diurnal variations in urinary calcium oxalate and calcium phosphate saturation levels in normal individuals.
Weber DV, Coe FL, Parks JH, Tembe V. Urinary saturation measurements in calcium nephrolithiasis.
Werness PG, Brown CM, Smith LH, Finlayson B. EQUIL 2: a basic computer programme for the calculation of urinary saturation.
May PM, Murray K. JESS, a joint expert speciation system – II. The thermodynamic database.
Bakar NK, Taylor DM, Williams DR. The chemical speciation of zinc in human saliva: possible correlation with reduction of the symptoms of the common cold produced by zinc gluconate-containing lozenges.
Jones PW, Taylor DM, Williams DR. Analysis and chemical speciation of copper and zinc in wound fluid.
Webb LM, Taylor DM, Williams DR. Computer modelling of the chemical speciation of lanthanide and actinide elements in the human gastrointestinal tract: mouth and stomach.
Jones PW, Taylor DM, Webb LM, Williams DR. Computer modelling of the chemical speciation of cesium, uranium (vi) and neptunium (v) in human duodenal fluids under fasting conditions.
Streit J, Tran-Ho L-C, Konigsberger E. Solubility of the three calcium oxalate hydrates in sodium chloride solutions and urine-like liquors.
Konigsberger E, Wang Z, Konigsberger L. Solubility of L-cystine in NaCl and artificial urine solutions.
Allie-Hamdulay S, Rodgers A. Prophylactic and therapeutic properties of a sodium citrate preparation for the potential management of calcium oxalate urolithiasis: randomized, placebo-controlled trial.
Sallis JD, Parry NF, Mechan JD, Kamperman H, Anderson ME. Controlling influence of phosphocitrate in vitro and in vivo on calcium oxalate crystal formation and growth.
Asplin JR, Parks JH, Chen MS et al. Reduced crystallization inhibition by urine from men with nephrolithiasis.




Comments