


Abstract
Background. Antagonism of vascular endothelial growth factor (VEGF) has improved the outcome in experimental nephropathies of various origins, including diabetic nephropathy in a type 1 diabetic rat model and a type 2 diabetic mouse model. Neutralizing VEGF antibodies prevented glomerular hypertrophy in these models. We examined the renal effects of VEGF blockade in an obese rat model of type 2 diabetic nephropathy and investigated the mechanism underlying the inhibition of glomerular hypertrophy.
Methods. Twenty female Zucker diabetic fatty (ZDF) rats, fed a high-fat diet and aged 10 weeks, were treated with VEGF antibodies or an irrelevant isotype-matched IgG. Ten heterozygous (fa/+) littermates served as additional non-diabetic, lean controls. Urinary albumin excretion (UAE) and creatinine clearance (CrCl) were assessed at baseline, and at 3 and 5 weeks. Kidney weight and glomerular volume were determined at the end of the study. Glomerular apoptosis was examined with anti-active caspase-3 immunohistochemistry.
Results. All obese animals had established diabetes, hyperlipidaemia and normal blood pressure, which were not influenced by VEGF antibody treatment. ZDF control rats had increased UAE, CrCl, kidney weights and glomerular volumes compared with non-diabetic, lean control rats. VEGF antibody treatment prevented the glomerular hypertrophy, but did not affect UAE, CrCl and kidney weight. Glomerular anti-active caspase-3 immunostaining was not different between the groups.
Conclusions. Inhibition of VEGF prevented early glomerular hypertrophy in ZDF rats with established diabetes. Increased apoptosis of glomerular endothelial cells does not appear to underly the inhibition of glomerular growth.
Introduction
Various growth factors and cytokines have been implicated as potential pathogenic factors in the development and progression of diabetic kidney disease, i.e. growth hormone, insulin-like growth factors and transforming growth factor-β [1]. It has been proposed recently that vascular endothelial growth factor (VEGF) plays a role in the development of renal changes in streptozotocin-induced diabetes in the rat [2], and in obese type 2 diabetic db/db mice [3]. In contrast, inhibition of VEGF had no major effects on renal function and structure in the Goto-Kakizaki rat, a model of lean type 2 diabetes [4].
VEGF induces endothelial cell hyperpermeability, proliferation, migration and assembly into tubes [5]. VEGF is constitutively expressed in normal kidneys by glomerular podocytes, whereas the receptors for VEGF, VEGFR-1 and VEGFR-2, are found predominantly on glomerular endothelial cells [5], suggesting a paracrine role for VEGF in the glomerulus. VEGF may also have autocrine effects as glomerular podocytes express neuropilin-1, another VEGF receptor [6]. VEGF is a survival factor for endothelial cells and induces anti-apoptotic proteins in endothelial cells [7]. Reduced VEGF levels are associated with endothelial apoptosis [8].
The obese Zucker diabetic fatty (ZDF) male rat is a commonly used genetic model of type 2 diabetes. The ZDF rat develops obesity due to the expression of the autosomal recessive fa gene resulting from a missense mutation in the extracellular domain of the leptin receptor. The ZDF rat is characterized by obesity, hyperglycaemia, hyperinsulinaemia, insulin resistance and hyperlipidaemia [9]. In contrast, heterozygous fa/+ animals are lean, have functional leptin receptors, and normal glucose, insulin and lipid profiles. Although female ZDF rats have degrees of obesity and levels of insulin resistance comparable with male ZDF rats, they develop only hyperglycaemia when administered a diabetogenic diet [10]. The ZDF rat is a valid animal model of type 2 diabetic nephropathy, characterized by early glomerular enlargement and glomerulosclerosis at 5 months, associated with mild mesangial expansion and evidence of podocyte injury [11]. In another study, glomerulosclerosis was not observed in ZDF rats at 22 weeks, but was present in all ZDF animals at 37 weeks [12]. The present study examines whether early treatment with neutralizing VEGF antibodies can prevent the development of diabetic nephropathy in female ZDF rats studied up to 22 weeks of age.
To elucidate a potential mechanism for the observed effects of VEGF inhibition on glomerular volume, glomerular apoptosis was investigated by anti-active caspase-3 immunohistochemistry. Caspase-3 is a key effector caspase in the apoptosis pathway, essential for apoptosis-associated chromatin margination, DNA fragmentation and nuclear collapse [13]. Once caspase-3 has been activated during the early stages of apoptosis, the programme for cell death is irreversibly set in motion.
Subjects and methods
Animals
Female ZDF rats (ZDF/GmiCrl-fa/fa) and non-diabetic, lean Zucker control rats (ZDF/GmiCrl-fa/+) with initial body weights of 324±3 and 152±4 g, respectively, were obtained from Charles River Laboratories (Brussels, Belgium). The obese (n = 20) and lean animals (n = 10) were housed in a room with controlled temperature (21±1°C), humidity (55±5%) and light cycle (6 a.m. to 6 p.m.). All animals had free access to chow and tap water. The lean rats were fed a standard laboratory diet (16.5% protein; Pavan Service Carfil Quality, Oud-Turnhout, Belgium). The ZDF rats received a diabetogenic, high-fat diet (C13004: Purina 5015 with 5% maltodextrin and 30% Merric 7-60 containing 12% protein, 48% fat, 40% carbohydrates; Research Diets, New Brunswick, NJ). Treatment started when ZDF rats had established diabetes after 4 weeks on the diabetogenic diet (= week 0). All animal experiments were performed in accordance with NIH and national guidelines for the protection of animals.
Study design
The ZDF/Gmi-fa/fa rats were randomized into two groups, and the lean (ZDF/Gmi-fa/+) rats served as additional, non-diabetic controls. One group of ZDF rats was injected intraperitoneally (i.p.) with a VEGF antibody (a generous gift from Encysive Pharmaceuticals, Houston, TX), while the other group was injected with an isotype-matched, irrelevant IgG. The VEGF antibody or IgG was given in a dose of 1 mg per animal three times weekly during a period of 5 weeks. The treatment period was chosen to avoid immunization of the animals. A full characterization of the antibody has been described elsewhere [2]. In brief, 8-week-old female Balb/c mice were immunized by three repeated i.p. and subcutaneous (s.c.) injections of 50 µg of recombinant human (rh)-VEGF165, which was emulsified with complete Freund's adjuvant for the primary immunization and with incomplete Freund's adjuvant for the subsequent immunizations. Mice with the highest serum titre to rh-VEGF165 received an additional injection of 30 µg of VEGF165 in phosphate-buffered saline (PBS), and 3 days later spleen cells were harvested for production of hybridomas to rh-VEGF165. Two hybridoma cell lines with the highest antibody titre and neutralizing activity were cloned 3–4 times in microplates. Purified IgG was prepared by protein A chromatography from ascites fluid collected from Balb/c mice that received injections i.p. (107 cells) of the cloned hybridomas. The isotype and light chain composition of the VEGF antibody and the characterization of the neutralizing activity were performed as described previously [2]. The VEGF antibody is active against VEGF121 and VEGF206. The VEGF antibody was dissolved in 0.154 mol/l NaCl and injected using an injection volume of 1 ml at each injection. At 0, 3 and 5 weeks, body weight and food intake were measured, and post-prandial blood was drawn in the mornings to determine haematocrit and serum levels for glucose, fructosamine, total protein, triglycerides, cholesterol, urea and creatinine. Blood pressure was recorded in the early afternoon on conscious rats using a non-invasive tail-cuff method with a pneumatic pulse transducer [3]. The animals had been accustomed to rest quietly in warmed plexi-glass restrainers before the start of the study. For each animal, the blood pressure level was determined as the mean value of 10 consecutive measurements. At similar time points, rats were placed in metabolic cages to collect 24 h urine samples for the measurement of urinary creatinine and albumin concentrations. Urine samples were stored at −20°C until analysis. At the end of the study, the animals were anaesthetized with pentobarbital (50 mg/kg body weight i.p.) and the kidneys were rapidly removed, cleaned and cut into three pieces: the poles and the middle part. The middle part of the left and right kidney was immersion fixed in 4% paraformaldehyde overnight and rinsed in PBS for histological examination. Two animals from each ZDF group were excluded because they died before the end of the study.
Analytical techniques
Blood was collected either periodically from tail veins or by exsanguination at termination; sera were prepared and stored at −20°C until analysis. Measurements of serum glucose, fructosamine, total protein, triglycerides, total cholesterol and urea were performed using commercial photometric assays (Roche Diagnostics GmbH, Mannheim, Germany). Plasma and urinary creatinine concentrations were determined enzymatically (Roche Diagnostics, Mannheim, Germany). Creatinine clearance (CrCl) was calculated based upon 24 h urine collections. These analyses were performed on two clinical chemistry automated analysers (Modular P and Hitachi 911, Roche Diagnostics). All measurements were carried out according to the manufacturer's instructions. The intra- and inter-assay coefficients of variation for all analyses were <5%.
An ultrasensitive rat insulin enzyme-linked immunosorbent assay (ELISA) kit (DRG Diagnostics, Marburg, Germany) was used to determine serum insulin levels. The urinary albumin concentration in 24 h urine collections was determined by an in-house rat albumin radioimmunoassay, using rabbit anti-rat albumin antibody RARa/Alb (Nordic Pharmaceuticals and Diagnostics, Tilburg, The Netherlands), and globulin-free rat albumin for standard and iodination (Sigma Chemical Co., St Louis, MO) [4]. For both assays, the intra- and inter-assay coefficients of variation were <5 and <10%, respectively.
Estimation of glomerular volume
The middle part of the right kidney (containing the papilla) was embedded in paraffin for light microscopic examination. Sections 2 µm thick were cut on a rotation microtome (Leica Rotation Microtome RM 2165; Leica, Vienna, Austria) and stained with periodic acid–Schiff and haematoxylin. The thickness of the sections was routinely controlled by a Digital Microcator ND 221 (Heidenhain, Traunreut, Germany) attached to the microscope. In each animal, the mean glomerular tuft volume (VG) was determined by light microscopy from the mean glomerular cross-sectional area (AG) live in an Olympus BX51TF light microscope (Olympus Co., Tokyo, Japan) at a magnification of 420× [3]. The measurements were performed in a blinded fashion. The areas were estimated with a two-dimensional version of the nucleator (CAST; Olympus Co., Copenhagen, Denmark) by light microscopy as the average area of a total of 80–100 glomerular profiles (i.e. capillary tuft omitting the Bowman's capsule) [3]. VG was calculated as: VG = β/k × (AG)3/2 where β = 1.38, which is the shape coefficient for spheres (the idealized shape of glomeruli), and k = 1.1, which is a size distribution coefficient [3].
Anti-active caspase-3 immunohistochemistry
Paraformaldehyde-fixed, paraffin-embedded kidney sections were deparaffinized with UltraClear (Klinipath BVBA, Geel, Belgium) at 37°C, gradually rehydrated with graded alcohol solutions (100, 96 and 70%) and washed with deionized water and PBS. Sections were treated with Triton X-100 (0.1% in PBS; Sigma-Aldrich NV/SA, Bornem, Belgium) for 10 min, washed in PBS and incubated with 3% H2O2 (VWR International BVBA, Leuven, Belgium) for 15 min. After two PBS washes, sections were incubated with blocking buffer (5% normal goat serum in PBS) for 45 min. The rabbit polyclonal anti-active caspase-3 primary antibody (Promega Benelux BV, Leiden, The Netherlands) was applied at a dilution of 1 : 50 in 1% bovine serum albumin in PBS for 1 h at room temperature. Following three PBS washes, sections were incubated with a secondary biotinylated goat anti-rabbit polyclonal IgG antibody (1 : 200 in PBS; DakoCytomation NV, Heverlee, Belgium) for 1 h, and with StreptABComplex/HRP (DakoCytomation) for 30 min at room temperature. 3,3-Diaminobenzidine tetrahydrochloride substrate (DakoCytomation) was applied as the chromogen, giving a brown reaction product. Sections were counterstained with Mayer's haematoxylin (Klinipath), dehydrated and mounted with DPX mounting medium (Klinipath).
Quantitative measurements of the anti-active caspase-3 immunostaining were made by two blinded operators with a Zeiss Axiophot microscope (Zeiss, Oberkochen, Germany) at magnification 200×. For each kidney, 12 random sections were analysed quantitatively with a computerized image analysis system (Zeiss, Oberkochen, Germany). A camera sampled the image of the stained sections and generated an electronic signal proportional to the intensity of illumination, which was then digitized into picture elements or pixels. The digital representation of the tissue was analysed with KS400 Software (Zeiss). The glomerular cross-sectional profiles, as defined above, were manually outlined by interactive tracing, and the anti-active caspase-3-positive cells within the glomerular profiles were manually indicated. For each kidney, >30 glomerular profiles were analysed by the two blinded investigators and averaged. The number of anti-active caspase-3-positive cells was expressed per 10 000 µm2 of glomerular cross-sectional area.
Statistical analysis
The data are given as means±SEM, with n indicating the number of rats studied. Statistical analyses were performed using SPSS 11.0 for Windows. Differences between the groups were assessed by one-way analysis of variance (ANOVA) followed by unpaired Student's t-tests with Bonferroni correction for multiple testing, unless otherwise stated. The data for glomerular volume and urinary albumin excretion (UAE) were log-transformed before analysis for normality reasons. Values of P<0.05 were considered statistically significant.
Results
Clinical and laboratory parameters
Body weights were higher in the ZDF rats than in the additional non-diabetic, lean control rats at each time point (Table 1). Blood pressure was not different between the groups at week 0 and week 3. At week 5, blood pressure was higher in the ZDF rats than in the non-diabetic, lean control rats (Table 1). Mean food intake was higher in the ZDF control rats than in the non-diabetic, lean control rats (15.1±0.3 vs 12.9±0.5 g/day, P<0.01). VEGF inhibition had no effect on food intake [14.2±0.3 vs 15.1±0.3 g/day, ZDF VEGF antibody-treated rats (VEGF-ab) vs ZDF control, P = NS] and body weight (Table 1). Haematocrit was comparable between the groups throughout the study (data not shown).
Time course of clinical parameters in non-diabetic, lean control rats and ZDF rats treated with control or VEGF antibodies
| Week 0 | Week 3 | Week 5 | ||||
|---|---|---|---|---|---|---|
| Body weight (g) | ||||||
| Lean | 176±3 | 195±3 | 200±4 | |||
| ZDF control | 391±3** | 410±2** | 423±3** | |||
| ZDF VEGF-ab | 383±7** | 406±8** | 412±7** | |||
| Blood pressure (mmHg) | ||||||
| Lean | 110±4 | 108±3 | 101±2 | |||
| ZDF control | 121±5 | 116±4 | 119±4* | |||
| ZDF VEGF-ab | 115±3 | 117±2 | 126±3** | |||
Values are means±SEM. n = 7–8 (ZDF groups), n = 9–10 (lean controls).
*P<0.01; **P<0.001 vs lean controls.
Non-fasted biochemical parameters are presented in Table 2. Throughout the study, non-fasted serum glycaemia, fructosamine, insulin, triglycerides and cholesterol were higher in the ZDF rats than in the non-diabetic, lean control rats. Serum urea levels were lower in the ZDF rats than in the non-diabetic, lean control rats. Serum creatinine levels were not different between the groups.
Time course of non-fasted laboratory parameters in non-diabetic, lean control rats and ZDF rats treated with control or VEGF antibodies
| Week 0 | Week 3 | Week 5 | ||||
|---|---|---|---|---|---|---|
| Glycaemia (mmol/l) | ||||||
| Lean | 7.7±0.2 | 7.8±0.2 | 7.0±0.1 | |||
| ZDF control | 15.1±1.8* | 19.4±2.9* | 18.8±2.9* | |||
| ZDF VEGF-ab | 14.8±1.5* | 15.9±2.0* | 19.4±2.3* | |||
| Fructosamine (µmol/g protein) | ||||||
| Lean | 2.5±0.0 | 2.3±0.0 | 2.4±0.0 | |||
| ZDF control | 3.0±0.1** | 3.1±0.2** | 3.1±0.2* | |||
| ZDF VEGF-ab | 3.1±0.1** | 2.8±0.2† | 3.1±0.1** | |||
| Insulin (µg/l) | ||||||
| Lean | 0.4±0.0 | 1.4±0.5 | 1.5±0.4 | |||
| ZDF control | 22.3±2.3* | 18.3±2.7* | 14.7±3.0* | |||
| ZDF VEGF-ab | 24.1±0.3* | 18.9±1.9† | 15.3±1.7* | |||
| Triglycerides (mmol/l) | ||||||
| Lean | 1.1±0.1 | 2.1±0.2 | 0.9±0.1 | |||
| ZDF control | 10.9±2.0* | 12.1±1.2* | 11.9±1.5* | |||
| ZDF VEGF-ab | 9.4±1.5* | 11.6±1.3* | 10.2±1.2* | |||
| Cholesterol (mmol/l) | ||||||
| Lean | 2.0±0.1 | 2.0±0.1 | 2.0±0.1 | |||
| ZDF control | 3.2±0.2** | 3.5±0.2** | 3.1±0.2** | |||
| ZDF VEGF-ab | 2.7±0.2* | 3.3±0.2** | 2.9±0.1** | |||
| Urea (mmol/l) | ||||||
| Lean | 12.9±0.5 | 15.4±0.5 | 15.5±0.4 | |||
| ZDF control | 7.8±0.7** | 8.2±0.4** | 9.0±0.6** | |||
| ZDF VEGF-ab | 8.1±0.8** | 8.3±0.4** | 8.2±0.6** | |||
| Creatinine (µmol/l) | ||||||
| Lean | 34.3±2.2 | 37.8±1.3 | 35.8±1.2 | |||
| ZDF control | 34.6±1.5 | 36.8±1.8 | 33.0±0.8 | |||
| ZDF VEGF-ab | 33.4±0.7 | 34.8±0.6 | 34.6±0.5 | |||
Values are means±SEM. n = 8 (ZDF groups), n = 10 (lean controls). Glycaemia, triglycerides, fructosamine (week 3 and week 5) and insulin (week 3 and week 5) were analysed by Kruskal–Wallis test followed by Dunn's test for multiple comparisons.
†P<0.05; *P<0.01; **P<0.001 vs lean controls.
CrCl and UAE
CrCl and UAE were higher in the ZDF groups than in the non-diabetic, lean control rats at all time points (Figure 1A and B, respectively). CrCl increased over time in ZDF rats (week 5 vs week 0 and vs week 3, paired t-test, P<0.05) whereas CrCl remained stable in non-diabetic, lean control rats. The progressive increase in UAE in ZDF rats was not statistically significant. Non-diabetic, lean control rats had a very low albuminuria throughout the study. VEGF blockade had no influence on these parameters in ZDF rats (Figure 1A and B).
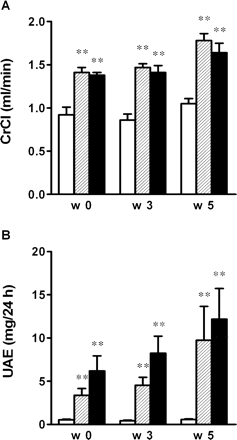
(A) Creatinine clearance (CrCl) and (B) urinary albumin excretion (UAE) in non-diabetic, lean control rats (open bar), ZDF control rats (hatched bar) and VEGF antibody-treated ZDF rats (closed bar). Results are presented as means±SEM. n = 7–10 in each group. **P<0.001 vs non-diabetic, lean control rats.
Organ weight and glomerular volume
Mean kidney weight was higher in the ZDF rats than in the non-diabetic, lean control rats (ZDF control 1.461±0.064 g, ZDF VEGF-ab 1.472±0.051 g vs lean 0.812±0.019 g, P<0.001). VEGF antibody administration had no effect on kidney weight. Glomerular volume was increased by 31% in ZDF control rats compared with the non-diabetic, lean control rats (Figure 2). Treatment of ZDF rats with VEGF antibody completely prevented the glomerular hypertrophy observed in ZDF control rats. Liver and heart weight were higher in the ZDF rats than in the non-diabetic, lean control rats. VEGF blockade did not affect liver or heart weight (data not shown).
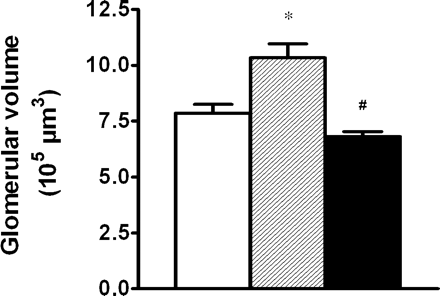
Glomerular volume in non-diabetic, lean control rats (open bar), ZDF control rats (hatched bar) and VEGF antibody-treated ZDF rats (closed bar) after 5 weeks of treatment. Results are presented as means±SEM. n = 8–9 in each group. *P<0.01 vs non-diabetic, lean control rats, #P<0.001 vs ZDF control rats.
Anti-active caspase-3 immunohistochemistry
The number of anti-active caspase-positive cells per 10 000 µm2 of glomerular cross-sectional area was 0.40±0.10 in the non-diabetic, lean control rats, 0.25±0.21 in the ZDF control rats and 0.58±0.12 in the VEGF-ab ZDF rats. The number of anti-active caspase-3-positive cells per 10 000 µm2 of glomerular cross-sectional area was not different between the groups.
Discussion
The ZDF rats in our study were metabolically characterized by obesity, hyperglycaemia, hyperinsulinaemia, and high levels of triglycerides and cholesterol, as previously shown [9]. Insulin levels decreased over time, reflecting the natural course of the insulin levels in ZDF rats [14].
The major new finding of the present study is the specific inhibitory effect of VEGF antibody treatment on early diabetes-associated glomerular hypertrophy in ZDF rats, a model of obese type 2 diabetes. Administration of VEGF antibody prevented the glomerular enlargement observed in ZDF control rats without affecting body weight, food intake, liver or heart weight. In contrast, VEGF antibody had no effect on kidney weight, UAE and CrCl.
Glomerular hypertrophy is a well-recognized early feature of diabetic nephropathy. The specific effect of VEGF inhibition on glomerular hypertrophy in the ZDF rats is in agreement with previous studies by our group in type 2 diabetic db/db mice [3] and in type 1 diabetic rats [2]. The glomerular hypertrophy in experimental diabetes is characterized by an increased number of glomerular capillaries, which is due to the formation of new capillaries rather than lengthening or dilating of existing capillaries [15]. As an important mediator of physiological and pathological angiogenesis [8], VEGF is likely to play a role in this process by stimulating the proliferation of glomerular endothelial cells, which has been documented in other glomerular diseases [5].
In our studies, the administration of the VEGF antibody or control IgG was limited to 6 weeks, owing to the immunogenicity of these antibodies. This treatment duration does not allow the investigation of long-term changes of diabetic nephropathy, i.e. glomerular basement membrane thickening, mesangial expansion and other ultrastructural changes.
In contrast to the beneficial effects of VEGF blockade on albuminuria and CrCl in other rodent models of diabetic nephropathy [2,3], VEGF inhibition had no effect on albuminuria and CrCl in the ZDF rats. The discrepancies in the effects of VEGF inhibition on albuminuria and CrCl in experimental diabetic kidney disease are in line with the inconsistent results in a large number of studies examining the role of VEGF in proteinuria in other glomerular diseases [5]. VEGF has been implicated in hyperpermeability of post-capillary venules [16]. The glomerular filtration barrier, however, has a much more complex structure, and glomerular albumin permeability is determined by many factors, including the glomerular endothelium, the electrical charges on the basement membrane, the podocytes, the mesangial cells and intraglomerular pressure. Accordingly, VEGF may not play a direct role in the pathogenesis of albuminuria.
Like VEGF, angiopoietins are endothelial-specific growth factors with substantial roles in the regulation of vascular development, growth, maturation and permeability [17]. An in vivo study in an ocular microvascular network has shown that angiopoietin-2 (Ang-2) stimulates new blood vessel formation in the presence of VEGF, but promotes endothelial apoptosis and vessel regression when VEGF levels are low [18]. In early diabetic nephropathy in streptozotocin-diabetic mice, the increased glomerular volume and glomerular capillary number were accompanied by increased Ang-2 and VEGF protein expression [19]. During the course of experimental crescentic glomerulonephritis, loss of glomerular capillaries and glomerular cell apoptosis was associated with decreased VEGF and increased Ang-2 immunostaining [20]. We hypothesized that VEGF inhibition in diabetic nephropathy may stimulate glomerular cell apoptosis and thereby counterbalance glomerular cell proliferation and glomerular growth. However, the number of glomerular apoptotic cells measured by anti-active caspase-3 immunostaining was not different between the groups. It remains to be examined whether VEGF inhibition reduces glomerular cell proliferation in diabetic nephropathy.
In conclusion, treatment with neutralizing VEGF antibody prevented early glomerular hypertrophy in ZDF rats with established diabetes. The negative results of the anti-active caspase-3 immunostaining do not allow us to conclude that increased apoptosis of glomerular endothelial cells underlies the inhibition of glomerular growth.
The authors thank Tommy Dheuvaert, Julien Dupont, Nele Nica, Mieke Van Landschoot, Marie-Anne Waterloos, Karen Mathiassen and Kirsten Nyborg Rasmussen for their excellent technical assistance. Encysive Pharmaceuticals, Houston, TX is acknowledged for the generous gift of the VEGF antibody. Ann Neesen, Indra De Borle, An D’Hulst, Katelijne De Swert are acknowledged for their help in writing the programme for the analysis system. This research was funded by the Fund for Scientific Research Flanders. B.F.S. was supported by a PhD grant of the Institute for the Promotion of Innovation through Science and Technology in Flanders (IWT-Flanders).
Conflict of interest statement. None declared. R.G.T. holds stock in Encysive Pharmaceuticals.
References
Schrijvers BF, De Vriese AS, Flyvbjerg A. From hyperglycemia to diabetic kidney disease: the role of metabolic, hemodynamic, intracellular factors and growth factors/cytokine.
De Vriese AS, Tilton RG, Elger M et al. Antibodies against vascular endothelial growth factor improve early renal dysfunction in experimental diabetes.
Flyvbjerg A, Dagnæs-Hansen F, De Vriese AS et al. Amelioration of long-term renal changes in obese type 2 diabetic mice by a neutralizing vascular endothelial growth factor antibody.
Schrijvers BF, De Vriese AS, Tilton RG et al. Inhibition of vascular endothelial growth factor (VEGF) does not affect early renal changes in a rat model of lean type 2 diabetes.
Schrijvers BF, Flyvbjerg A, De Vriese AS. The role of vascular endothelial growth factor (VEGF) in renal pathophysiology.
Foster RR, Hole R, Anderson K et al. Functional evidence that vascular endothelial growth factor may act as an autocrine factor on human podocytes.
Gerber HP, Dixit V, Ferrara N. Vascular endothelial growth factor induces expression of the anti-apoptotic proteins Bcl-2 and A1 in vascular endothelial cells.
Benjamin LE, Golijanin D, Itin A, Pode D, Keshet E. Selective ablation of immature blood vessels in established human tumors follows vascular endothelial growth factor withdrawal.
Peterson RG, Shaw WN, Neel M-A, Little LA, Eichberg J. Zucker diabetic fatty rat as a model for non-insulin-dependent diabetes mellitus.
Corsetti JP, Sparks JD, Peterson RG, Smith RL, Sparks CE. Effect of dietary fat on the development of non-insulin dependent diabetes mellitus in obese Zucker diabetic fatty male and female rats.
Hoshi S, Shu Y, Yoshida F et al. Podocyte injury promotes progressive nephropathy in Zucker diabetic fatty rats.
Schäfer S, Linz W, Bube A et al. Vasopeptidase inhibition prevents nephropathy in Zucker diabetic fatty rats.
Slee EA, Adrain C, Martin SJ. Executioner caspase-3, -6, and -7 perform distinct, non-redundant roles during the demolition phase of apoptosis.
Janssen SWJ, Martens GJ, Sweep CG, Ross HA, Hermus AR. In Zucker diabetic fatty rats plasma leptin levels are correlated with plasma insulin levels rather than with body weight.
Nyengaard JR, Rasch R. The impact of experimental diabetes mellitus in rats on glomerular capillary number and sizes.
Tilton RG, Kawamura T, Chang KC et al. Vascular dysfunction induced by elevated glucose levels in rats is mediated by vascular endothelial growth factor.
Satchell SC, Mathieson PW. Angiopoietins: microvascular modulators with potential roles in glomerular pathophysiology.
Lobov IB, Brooks PC, Lang RA. Angiopoietin-2 displays VEGF-dependent modulation of capillary structure and endothelial cell survival in vivo.
Yamamoto Y, Maeshima Y, Kitayama H et al. Tumstatin peptide, an inhibitor of angiogenesis, prevents glomerular hypertrophy in the early stage of diabetic nephropathy.
Author notes
1Renal Unit, Department of Internal Medicine, Gent University Hospital, Gent and 4Renal Unit, Department of Internal Medicine, AZ Sint-Jan AV, Brugge, Belgium, 2Medical Research Laboratories, Clinical Institute, Aarhus University Hospital, Aarhus, Denmark and 3Division of Endocrinology, Department of Internal Medicine, University of Texas Medical Branch, Galveston, TX, USA


Comments