


Abstract
Background. The effect of antiretroviral therapy (ART) on the clinical course of patients with human immunodeficiency virus (HIV)-associated nephropathy (HIVAN) is not well-established. This study was undertaken to further elucidate the potential benefit of ART in HIV-infected patients with documented HIVAN.
Methods. A cohort of 263 consecutive HIV-infected patients referred to the Johns Hopkins renal clinic from 1995 to 2004 was examined. Patients were included if they had biopsy-proven HIVAN and did not require dialysis within 1 month of their kidney biopsy. The cumulative probability of renal survival was calculated using the Kaplan–Meier method. Multivariate analysis was performed using the Cox regression method.
Results. Fifty-three patients among 152 biopsied patients had HIVAN. Among 36 patients who met the inclusion criteria, 26 were treated with ART (group I) and 10 patients were not (group II). Except for age, baseline demographics and clinical characteristics were similar in the two groups. Renal survival was significantly better in the group receiving ART by both univariate ( P = 0.025) and multivariate analysis (overall adjusted hazard ratio = 0.30; 95% confidence interval 0.09–0.98; P < 0.05) for ART compared with no treatment.
Conclusions. Patients with biopsy-proven HIVAN treated with ART had better renal survival compared with patients who did not receive ART. HIVAN should be considered as an indication to initiate ART.
Introduction
Human immunodeficiency virus (HIV)-associated nephropathy (HIVAN) is the leading cause of end-stage renal disease (ESRD) in patients with HIV infection [ 1 ]. It is characterized by glomerular capillary collapse, tubular microcystic dilatation and tubuloreticular inclusions, and if left untreated, it almost uniformly progresses to ESRD within weeks to months. Angiotensin-converting enzyme inhibitors (ACE-I) [ 2 , 3 ], corticosteroids [ 4 ] and antiretroviral agents [ 5 , 6 ] have been used in various combinations for the treatment of HIVAN.
There are several case reports describing the role of antiretroviral therapy (ART) in controlling or reversing the progression of renal failure in patients with HIVAN [ 7 , 8 ]. The widespread use of highly ART (HAART) has been shown to lead to a decrease in the incidence of HIVAN [ 9 ]. The progression of HIVAN to ESRD has also decreased since 1995, presumably reflecting the effect of HAART [ 10 ]. It has therefore been suggested that HIVAN should be considered an indication for HAART [ 11 ].
While these observational data suggest that ART is effective in the treatment of HIVAN, some studies have shown no benefit [ 12 , 13 ]. We performed a retrospective cohort study evaluating all patients with biopsy-proven HIVAN to determine the effect of ART on the clinical course of their renal disease.
Methods
The medical records of 263 consecutive HIV-infected patients referred to the Johns Hopkins renal clinic from 1995 to 2004 were reviewed. The starting date in 1995 reflects the initiation of data collection. The Johns Hopkins Institutional Review Board approved the research protocol. HIVAN was defined based on the pathological findings of collapsing glomerulopathy, tubulointerstitial inflammation and podocyte injury. Over the period of the study, at least three renal pathologists were involved in examining the kidney biopsies. However, all pathology data were extracted by only one pathologist to apply the above criteria for the diagnosis of HIVAN. Treatment with ART was defined as initiation of at least one antiretroviral agent. Virological response to initiation of ART was defined as: (i) decrease in plasma HIV RNA by at least 1.5 log 10 copies/ml or to <5000 copies/ml by 4 weeks [ 14 , 15 ] or (ii) decrease in HIV RNA to <500 copies/ml by 8–16 weeks [ 16 ] or (iii) decrease in HIV RNA to <50 copies/ml by 16–24 weeks [ 17 ]. Patients were classified as complete responders if they had the initial virological response as defined above, along with sustained suppression of viral load below 400 copies/ml for 24 weeks. Patients were considered as partial responders if viral load suppression was not sustained. Patients were excluded if they required dialysis within 1 month of renal biopsy. Patients were then divided into two groups: group I (patients treated with ART) and group II (patients not treated with ART).
Data on demographics (age, sex and race), comorbid conditions [diabetes, hypertension (defined as the use of antihypertensive medication at any time during the study period), hepatitis-B and hepatitis-C infection, injection drug use], HIVAN treatment (initiation of ACE-I, corticosteroids or antiretroviral agents within 3 months of biopsy and at anytime during the patient's follow up) and laboratory measurements at the time of renal biopsy (serum creatinine, urinary protein excretion by spot urinary protein to creatinine ratio or 24 h urine collection, CD4 count and plasma HIV RNA) were extracted from the patients’ medical record. Estimated glomerular filtration rate (GFR) was calculated based on the four variable modification of diet in renal disease (MDRD) equation [ 18 ]. In addition, serial viral loads and serum creatinine for each patient were collected for the duration of the follow up, where available.
Analysis
Statistical analyses were performed using Stata Software version 8 (Stata Corporation, College Station, TX, USA). Both demographic and clinical characteristics of patients were compared between the group treated with ART and the group not treated. The mean values between the two groups were compared using Student's t -test for continuous variables and are presented as mean ± SD. Chi-square test was performed for comparison of discrete data.
Kaplan–Meier survival analysis was performed for calculating cumulative probability of renal survival for both ART-treated and untreated groups. Kaplan–Meier survival curves for each group were compared using a log-rank test statistic.
Relative risk of progression to ESRD, defined as requirement for dialysis support, between the ART-treated and untreated group was measured by hazard ratios (HRs) employing Cox proportional hazards models. Both unadjusted and adjusted HRs were obtained from bivariate and multivariate models to ascertain and compare the risk of ESRD. Only variables that are significant at 0.10 level in univariate analysis were included in the final multivariate model. Absolute P -values and 95% confidence intervals (CIs) for the difference between the groups were reported, where appropriate.
Results
Characteristics of the patients
Among 263 HIV-infected patients with kidney disease, 152 underwent renal biopsy, of whom 53 (34.9%) had biopsy-proven HIVAN. None of these 53 patients had a diagnosis of classic focal segmental glomerulosclerosis. Of the 53 HIVAN patients, 16 (30%) required dialysis at the time of biopsy or within 1 month of biopsy and were excluded. As expected, excluded patients had more advanced kidney disease at the time of the biopsy, with higher serum creatinine and more significant proteinuria ( Table 1 ). One patient was also excluded as follow-up time was not available. Among the 36 remaining patients, 26 (72.2%) were treated with ART, while the remaining 10 patients were not. In the ART-treated group, 17 patients were on HAART regimens, seven patients on combination ART and two patients on monotherapy.
The treated group was significantly older but was otherwise demographically similar to the untreated group. The distribution of comorbidities, including hepatitis-B, hepatitis-C, hypertension and diabetes mellitus was not significantly different between groups. Mean serum creatinine was 4.65 mg/dl (±1.94) in the treated group and 7.75 mg/dl (±2.94) for the untreated group ( P = 0.0008). However, there was no significant difference in the mean GFR between the two groups [20.3 ml/min/1.73 m 2 (±12.9) and 13.6 ml/min/1.73 m 2 (±13.5) in treated and untreated groups respectively, P = 0.18] ( Table 1 ).
Renal survival
The cumulative renal survival of patients included in the study was 14.2% at the end of the follow-up period (2962 days). Renal survival was significantly higher in the group treated with ART compared with the untreated group [18.1 vs 12.5%, P = 0.025 (log rank test)] ( Figure 1 A). Median renal survival was 552 days (18.4 months) for the treated group compared with 117 days (3.9 months) for the untreated group. The longest renal survival in the untreated group was 13 months, in a patient who was subsequently lost to follow-up, with the last documented serum creatinine being 6.6 mg/dl. Because this significant difference in the length of follow-up between the two groups may lead to survival bias (the probability of failure being higher with longer follow-up), analysis was performed considering the same follow-up time period for both groups, making the total duration of follow-up identical in all the censored and non-censored patients. The truncated analysis also demonstrated significantly better renal survival for the patients treated with ART (52.7 vs 12.5%, P < 0.05) ( Figure 1 B). None of the 36 patients studied died during the follow-up period.
A subgroup analysis was conducted to evaluate the effect of initiating ART early after renal biopsy and the relationship between virological suppression and renal survival. Data were examined based on whether ART was started within 3 months after the renal biopsy. Six patients were excluded from this analysis, as adequate information regarding their viral load or timing of initiation of ART was not available. Of the remaining 30 patients, there was a trend towards better renal survival among the 17 who started ART within 3 months of biopsy compared with those who did not (cumulative survival 37.5 vs 18.9%, P = 0.13). Figure 2 shows that among these 17 patients, there was a trend towards better renal survival in patients with complete virological response compared with those with a partial virological response (37.5 vs 8.8%, P = 0.12).
Risk of ESRD (need for dialysis)
Both bivariate and multivariate analyses (adjusted for GFR, infection drug use, hepatitis-C and use of glucocorticoids) using Cox proportional hazards models demonstrated that progression to ESRD was significantly lower among ART-treated patients than those who were not treated (unadjusted HR = 0.36, P < 0.05; adjusted HR = 0.30, P < 0.05) ( Table 2 ). Multivariate analysis also revealed that use of glucocorticoids was potentially protective, with a non-significant trend towards a lower risk of ESRD with glucocorticoid treatment ( Table 2 ). Starting doses were mostly 1 mg/kg/day of prednisone, though data regarding total dose and duration of therapy was not available for analysis. The use of ACE-I was not associated with lower risk of ESRD, although the number of treated patients was small (only four patients), and the clinical impact could not be documented in this sample ( P = NS). No patient was treated with an angiotensin receptor blocker.
Discussion
In our cohort study, the use of ART was associated with significantly better renal survival even after controlling for other treatment modalities such as the use of glucocorticoids. While a randomized control study would be the ideal way to assess the role of ART in the treatment of HIVAN, the efficacy of ART [ 19–25 ] and the poor prognosis of untreated HIV infection make it unethical to conduct such a trial.
In this study, treatment with ART was defined as initiation of at least one antiretroviral medication, which allowed inclusion of those treated in the pre-HAART era with one or two nucleoside analogue reverse transcriptase inhibitors as well as those treated with HAART. The trend towards improved renal survival in patients with complete as opposed to partial virological suppression ( Figure 2 , P = 0.12), suggests that the greatest benefit is associated with HAART in the setting of maximal virological suppression.
Although the survival benefit of ART in patients with HIV infection is well-established, its association with renal survival has been less clear. Several studies have suggested that ART could potentially slow the progression of HIVAN and other HIV-related renal diseases [ 7–9 , 26–29 ]. However, these studies were limited to case reports, and in several, the documentation of HIVAN was based on surrogate markers rather than biopsy. We have recently reported the limitations of using surrogate markers to establish the diagnosis of HIVAN [ 30 , 31 ] and believe that kidney biopsy is the gold standard for diagnosis. Furthermore, several studies found no renal benefit with ART. In the study by Szczech and colleagues [ 12 ], which included more than 2000 HIV-infected women, ART monotherapy, ART combination therapy and HAART were not associated with reduction in the risk of renal failure even when those with proteinuria were analysed separately. Again, biopsy-confirmed diagnoses were not used in this cohort. It is important to note, however, that kidney disease may have developed prior to the availability of HAART in many subjects in this cohort. In a study by Laradi and colleagues [ 13 ], a history of antiretroviral use was associated with poorer patient survival. However, this study included only patients from 1984 through 1996, before the introduction of HAART.
Human data and a murine transgenic model of HIVAN suggest that HIVAN is a direct result of viral gene expression [ 32–34 ]; therefore, it is plausible that ART could slow HIVAN progression by decreasing viral replication in the kidney. These data would suggest that biopsy-proven HIVAN is an indication for HAART, an approach that is not the current standard practice.
It is important to note the limitations of our study. First, we were unable to determine why some of the patients with biopsy-proven HIVAN were not treated with ART. Selection bias could have been introduced if such patients were more likely to be non-adherent or to be actively using drugs than those in the treated group. However, the similarities between the findings in this study and the recent cohort study by Szczech and colleagues [ 35 ] provide further support to our conclusion. Second, since this was a single-centre study at an academic institution with an active HIV clinic and because of the limited number of patients in the study, our patient population may differ significantly from those patients seen in other nephrology practices. Third, the inclusion of patients from the pre-HAART era, with a lower number on HAART, may limit the applicability of our results to today's regimens. However, the heterogeneity of antiretroviral regimens in this cohort would have been expected to bias the results towards the null.
In conclusion, this study provides further evidence that the HAART may slow the progression of HIVAN, which should be considered as an indication for HAART, independent of CD4 count, plasma HIV RNA, and HIV-associated symptoms and opportunistic conditions. This study emphasizes the importance of early diagnosis and treatment of HIVAN to prevent loss of renal function and ESRD.
Baseline characteristics of the study patients a
| Group I (ART- treated) n = 26 | Group II (ART-untreated) n = 10 | Excluded, n = 16 | P -value a | |
|---|---|---|---|---|
| Age (years) | 42.8 (±8.3) | 37.2 (±4.5) | 39.6 (± 8.9) | 0.05 |
| Race (% black) | 96 | 90 | 100 | 0.47 |
| Sex (% females) | 42 | 20 | 50 | 0.21 |
| Hypertension (%) | 65 | 40 | 50 | 0.17 |
| Diabetes (%) | 7.7 | – | 12.5 | 0.37 |
| IDU (%) | 65 | 50 | 50 | 0.40 |
| Hepatitis-B (%) | 4.2 | 22.2 | 0 | 0.11 |
| Hepatitis-C (%) | 64 | 55.6 | 50 | 0.65 |
| Serum creatinine (mg/dl) | 4.7 (±1.9) | 7.8 (± 2.9) | 10.4 (±3.7) | <0.001 |
| GFR (ml/minute/1.73 m 2 ) | 20 (±13) | 14 (±14) | 7 (+4) | 0.18 |
| CD4+ (cells/mm 3 ) | 160 (±170) | 161 (±130) | 155 (±136) | 0.99 |
| Proteinuria (g/day) | 7.2 (±6.1) | 6 (±4.2) | 9.4 (±10) | 0.57 |
| Albumin (g/dl) | 2.8 (±1.1) | 2.4 (±0.7) | 2.1 (±0.8) | 0.28 |
| ACE-I therapy (%) | 4.4 | 29 | 6.25 | 0.06 |
| Steroid therapy (%) | 65 | 60 | 31 | 0.76 |
a Indicates the difference between group I and II.
All units are mean ± SD unless otherwise indicated.
IDU, injection drug use; GFR, glomerular filtration rate; ACE-I, angiotensin-converting enzyme inhibitor.
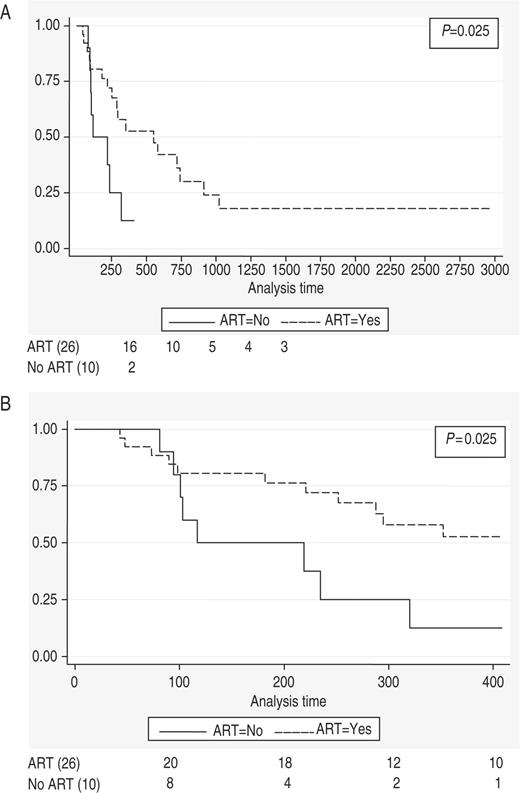
( A ) Kaplan–Meier estimate of renal survival in two groups of study patients (treated and not treated with ART). ( B ) Kaplan–Meier estimate of renal survival in study patients treated and not treated with ART (analysis time = 408 days).
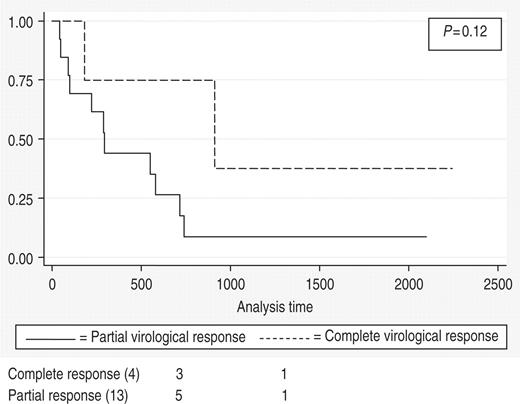
Kaplan–Meier estimates of renal survival in patients with complete and partial virological suppression.
Unadjusted and adjusted HRs from Cox proportional hazards models
| Variables | Univariate model | Multivariate model | |||
|---|---|---|---|---|---|
| HR | P -value | HR | P -value | 95% CI | |
| ART | 0.36 | <0.05 | 0.30 | <0.05 | 0.09–0.98 |
| IDU | 2.37 | <0.05 | 1.61 | 0.44 | 0.48–5.45 |
| Hepatitis-C | 2.88 | <0.05 | 1.41 | 0.57 | 0.43–4.66 |
| GFR at the time of biopsy | 0.94 | <0.05 | 0.96 | 0.16 | 0.91–1.02 |
| Corticosteroids | 0.47 | <0.10 | 0.52 | 0.25 | 0.17–1.60 |
Acknowledgements
Preliminary data related to this manuscript was presented in an oral communication session during the American Society of Nephrology meeting in November 2005.
Conflict of interest statement . None declared.
References
Winston JA, Burns GC, Klotman PE. (
Burns GC, Paul SK, Toth IR, Sivak SL. (
Klotman PE. (
Eustace JA, Nuermberger E, Choi M, Scheel PJ Jr, Moore R, Briggs WA. (
Cook PP and Appel RG. (
Harrer T, Hunzelmann N, Stoll R, Baur A, Kalden JR. (
Scheurer D. (
Kirchner JT. (
Lucas GM, Eustace JA, Sozio S, Mentari EK, Appiah KA, Moore RD. (
Ross MJ and Klotman PE. (
Winston JA, Klotman ME, Klotman PE. (
Szczech LA, Gange SJ, van der Horst C, et al. (
Laradi A, Mallet A, Beaufils H, Allouache M, Martinez F. (
Ghani AC, Ferguson NM, Fraser C, et al. (
Maggiolo F, Migliorino M, Pirali A, Pravettoni G, Caprioli S, Suter F. (
Demeter LM, Hughes MD, Coombs RW, et al. (
Yeni PG, Hammer SM, Hirsch MS, et al. (
Levey AS GT, Kusek JW, Beck GJ, Group MS. (
Gulick RM, Mellors JW, Havlir D, et al. (
Gulick RM, Mellors JW, Havlir D, et al. (
Hammer SM, Squires KE, Hughes MD, et al. (
Ledergerber B, Egger M, Opravil M, et al. (
Staszewski S, Morales-Ramirez J, Tashima KT, et al. (
Hogg RS, Rhone SA, Yip B, et al. (
Murphy RL, Gulick RM, DeGruttola V, et al. (
Michel C, Dosquet P, Ronco P, Mougenot B, Viron B, Mignon F. (
Kimmel PL, Bosch JP, Vassalotti JA. (
Wali RK, Drachenberg CI, Papadimitriou JC, Keay S, Ramos E. (
Ifudu O, Rao TK, Tan CC, Fleischman H, Chirgwin K, Friedman EA. (
Atta MG, Longenecker JC, Fine DM, et al. (
Atta MG, Choi MJ, Longenecker JC, et al. (
Barisoni L, Bruggeman LA, Mundel P, D’Agati VD, Klotman PE. (
Conaldi PG, Biancone L, Bottelli A, et al. (
Winston JA, Bruggeman LA, Ross MD, et al. (


Comments