


Introduction
Brain tumors are a significant source of cancer-related morbidity and mortality in infants and children. This age group is diagnosed with unique groups of cancers and requires separate reporting in order to accurately portray the state of brain tumors in these populations.
The Central Brain Tumor Registry of the United States (CBTRUS) is the largest population-based registry of primary brain and central nervous system (CNS) tumors in the United States (US), and covers 99.8% of the US population for the period between 2007 and 2011 (for 2011 only, data was available for 50 out of 51 registries). The objective of the CBTRUS Statistical Report: Alex's Lemonade Stand Foundation Infant and Childhood Primary Brain and Central Nervous System Tumors Diagnosed in the United States in 2007–2011 is to provide a comprehensive summary of the current descriptive epidemiology of primary brain and CNS tumors of childhood (0–14 years) in the US population. CBTRUS obtained the latest available data on all newly diagnosed primary brain and CNS tumors from the Centers for Disease Control and Prevention (CDC) National Program of Cancer Registries (NPCR), and the National Cancer Institute (NCI) Surveillance, Epidemiology and End Results (SEER) program for diagnosis years 2007–2011. Incidence counts and rates of primary malignant and non-malignant brain and CNS tumors are documented by histology, gender, age, race, and Hispanic ethnicity. Mortality and relative survival rates for selected malignant histologies calculated using SEER data for the period 1995–2011 are also presented.
Background
CBTRUS is currently the only population-based site-specific registry in the US that works in partnership with a public cancer surveillance organization, the CDC's NPCR, and from which data are directly received under a special agreement. This agreement permits transfer of data through the National Program of Central Registries Cancer Surveillance System (NPCR-CSS) Submission Specifications mechanism. CBTRUS researchers combine the NPCR data with data from the SEER program1 of the NCI, which was established for national cancer surveillance in the early 1970s. All data from NPCR and SEER originate from tumor registrars who adhere to the Uniform Data Standards (UDS) for malignant and non-malignant brain and CNS tumors as directed by the North American Association of Cancer Registries (NAACCR) (http://www.naaccr.org). Along with the UDS, there are quality control checks and a system for rating each central registry to further insure that these data are reported as accurately and completely as possible. As a surveillance partner, CBTRUS can, therefore, report high quality data on brain and CNS tumors with histological specificity useful to the communities it serves. Its database represents the largest aggregation of population-based data on the incidence of primary brain and CNS tumors in the US.
Technical Notes
Data Collection
CBTRUS contains incidence data from 51 independent central cancer registries (46 NPCR and 5 SEER registries) representing ∼99.8% of the US population for the time period examined in this report (for 1 of 51 registries, data were available only from 2007–2010).2 Please see The CBTRUS Statistical Report: Primary and Central Nervous System Tumors Diagnosed in the United States in 2007–2011 for additional information about the way that these data are obtained and processed.2
Age-adjusted incidence rates per 100,000 for the entire US for selected other cancers were obtained from the United States Cancer Statistics (USCS),3 produced by the CDC and the NCI, via CDC Wide-ranging Online Data for Epidemiologic Research (WONDER), for the purpose of comparison with brain and CNS tumor incidence rates. This database includes both NPCR and SEER data and represents nearly 100% of the US population.
Survival data for malignant brain and CNS tumors were obtained from 18 SEER registries for the years 1995 to 2011. This dataset spanning 16 years provides population-based information for approximately 26% of the US population,4 and is a subset of the data used for the incidence calculations presented in this report. Survival information derived from active patient follow-up is not available in the data that CBTRUS receives from NPCR registries, so the SEER data are used for the generation of these Tables.
Mortality data used in this report are from the National Center for Health Statistics (NCHS) and include deaths where primary brain or CNS tumor was listed as cause of death on the death certificate for all 50 states and the District of Columbia. Population data for each geographic region were obtained from the SEER program website5 for the purpose of rate calculation.
Data Reporting - Definitions
It should be noted that other surveillance organizations and researchers may report brain tumors differently from CBTRUS. The definition of brain and CNS tumors used by SEER, NPCR, and NAACCR in their published incidence and mortality statistics includes tumors located in the following sites with their ICD-O-3 site codes in parentheses: brain, meninges, and other central nervous system tumors (C70.0–9, C71.0–9, and C72.0–9), but excludes lymphoma and leukemia histologies (9590–9989) from all brain and CNS sites. CBTRUS reports data on all tumor morphologies located within the Consensus Conference site definition including lymphoma and other hematopoietic histologies (9590–9989), and olfactory tumors of the nasal cavity [C30.0 (9522–9523)].2,6 Additionally, CBTRUS reports data on all brain and CNS tumors irrespective of behavior, whereas many reporting organizations may only publish rates for malignant brain and CNS tumors.
The CBTRUS Histology Grouping Scheme used in the CBTRUS Statistical Report: Primary Brain and Central Nervous System Tumors Diagnosed in the United States in 2007–20112 provides the basis for the definition for Gliomas and Embryonal Tumors used throughout this Report. These histologies were re-organized to be more reflective of the clinical organization of brain tumors that are specific to infancy and childhood. The gliomas are further categorized as low grade and high grade gliomas to further enhance their clinical relevance. Specific histologies and corresponding ICD-O-3 codes according to these refined categories can be found in Tables 2a and 2b.
Central Brain Tumor Registry of the United States (CBTRUS), Brain and Central Nervous System Tumor Site Groupings, CBTRUS Statistical Report: Alex's Lemonade Stand Foundation Infant and Childhood Primary Brain and Central Nervous System Tumors Diagnosed in the United States in 2007–2011.
| Site | ICD-O-3a Site Code |
|---|---|
| Frontal lobe of brain | C71.1 |
| Temporal lobe of brain | C71.2 |
| Parietal lobe of brain | C71.3 |
| Occipital lobe of brain | C71.4 |
| Cerebrum | C71.0 |
| Ventricle | C71.5 |
| Cerebellum | C71.6 |
| Brain stem | C71.7 |
| Other brainb | C71.8-C71.9 |
| Spinal cord and cauda equina | C72.0-C72.1 |
| Cranial nerves | C72.2-C72.5 |
| Other nervous systemc | C72.8-C72.9 |
| Meninges (cerebral & spinal) | C70.0-C70.9 |
| Pituitary and craniopharyngeal duct | C75.1-C75.2 |
| Pineal | C75.3 |
| Olfactory tumors of the nasal cavityb | C30.0 |
International Classification of Diseases for Oncology, 3rd Edition, 2000. World Health Organization, Geneva, Switzerland.
Includes C71.8, Overlapping lesion of brain (Corpus callosum & Tapetum)) and C71.9 Brain, NOS (Intracranial site, Cranial fossa, NOS, Anterior cranial fossa, Middle cranial fossa, Posterior cranial fossa and Suprasellar).
Includes ICD-O-3 site code C72.8 Overlapping lesion of brain and CNS when point of origin cannot be assigned and C72.9 Nervous system, NOS (CNS, Epidural, Extradural, Parasellar).
ICD-O-3 histology codes 9522–9523 only.
CBTRUS Brain and Central Nervous System Tumor Histology Groupings, CBTRUS Statistical Report: Alex's Lemonade Stand Foundation Infant and Childhood Primary Brain and Central Nervous System Tumors Diagnosed in the United States in 2007–2011.
| CBTRUS Specific Histology Groupinga | Infant and Childhood Report Major Histology Groupings | ICD-O-3b Histology Code |
|---|---|---|
| Pilocytic astrocytoma | Pilocytic astrocytoma* | 9421 |
| Diffuse astrocytoma | Other low grade glioma* | 9400 (excluding site C71.7), 9410, 9411, 9420 |
| High grade glioma* | 9400 (site C71.7 only) | |
| Anaplastic astrocytoma | High grade glioma* | 9401 |
| Unique astrocytoma variants | Other low grade glioma* | 9383, 9384, 9424 |
| Glioblastoma | High grade glioma* | 9440, 9441, 9442/3c |
| Oligodendroglioma | Other low grade glioma* | 9450 |
| Anaplastic oligodendroglioma | High grade glioma* | 9451, 9460 |
| Oligoastrocytic tumors | Other low grade glioma* | 9382 |
| Ependymal tumors | Ependymal tumors* | 9391, 9392, 9393, 9394 |
| Glioma malignant, NOS | Other low grade glioma* | 9380 (site C72.3 only) |
| High grade glioma* | 9380 (site C71.7 only) | |
| Other glioma* | 9380 (excluding sites C71.7 and C72.3) | |
| Choroid plexus tumors | Choroid plexus tumors | 9390 |
| Other neuroepithelial tumors | Other glioma* | 9363, 9423, 9430, 9444 |
| Neuronal and mixed neuronal-glial tumors | Other low grade glioma* | 9412, 9413 |
| Other glioma* | 9442/1d | |
| Neuronal and mixed neuronal-glial tumors | 8680, 8681, 8690, 8693, 9492 (excluding site C75.1), 9493, 9505, 9506, 9522, 9523 | |
| Tumors of the pineal region | Tumors of the pineal region | 9360, 9361, 9362 |
| Embryonal tumors | Medulloblastoma | 9470, 9471, 9472, 9474 |
| Primitive neuroectodermal tumor | 9473 | |
| Atypical teratoid/rhabdoid tumor | 9508 | |
| Other embryonal tumors | 8963, 9364, 9490, 9500, 9501, 9502, 9504 | |
| Nerve sheath tumors | Tumors of cranial and spinal nerves | 9540, 9541, 9550, 9560, 9561, 9570, 9571 |
| Other Tumors of cranial and spinal nerves | Tumors of cranial and spinal nerves | 9562 |
| Meningioma | Tumors of meninges | 9530, 9531, 9532, 9533, 9534, 9537, 9538, 9539 |
| Mesenchymal tumors | Tumors of meninges | 8324, 8800, 8801, 8802, 8803, 8804, 8805, 8806, 8810, 8815, 8824, 8830, 8831, 8835, 8836, 8850, 8851, 8852, 8853, 8854, 8857, 8861, 8870 , 8880, 8890, 8897, 8900, 8901, 8902, 8910, 8912, 8920, 8921, 8935, 8990, 9040, 9136, 9150, 9170, 9180, 9210, 9241, 9260, 9373, 9480 |
| Primary melanocytic lesions | Tumors of meninges | 8720, 8728, 8770, 8771 |
| Other neoplasms related to the meninges | Tumors of meninges | 9161, 9220, 9231, 9240, 9243, 9370, 9371, 9372, 9535 |
| Lymphoma | Lymphomas and hematopoietic neoplasms | 9590, 9591, 9596, 9650, 9651, 9652, 9653, 9654, 9655, 9659, 9661, 9662, 9663, 9664, 9665, 9667, 9670, 9671, 9673, 9675, 9680, 9684, 9687, 9690, 9691, 9695, 9698, 9699, 9701, 9702, 9705, 9714, 9719, 9728, 9729 |
| Other hematopoietic neoplasms | Lymphomas and hematopoietic neoplasms | 9727, 9731, 9733, 9734, 9740, 9741, 9750, 9751, 9752, 9753, 9754, 9755, 9756, 9757, 9758, 9760, 9766, 9823, 9826, 9827, 9832, 9837, 9860, 9861, 9866, 9930, 9970 |
| Germ cell tumors, cysts and heterotopias | Germ cell tumors | 8020, 8440, 9060, 9061, 9064, 9065, 9070, 9071, 9072, 9080, 9081, 9082, 9083, 9084, 9085, 9100, 9101 |
| Tumors of the pituitary | Tumors of the pituitary | 8040, 8140, 8146, 8246, 8260, 8270, 8271, 8272, 8280, 8281, 8290, 8300, 8310, 8323, 9492 (Site C75.1 only), 9582 |
| Craniopharyngioma | Craniopharyngioma | 9350, 9351, 9352 |
| Hemangioma | Other/unclassified tumors | 9120, 9121, 9122, 9123, 9125, 9130, 9131, 9133, 9140 |
| Neoplasm, unspecified | Other/unclassified tumors | 8000, 8001, 8002, 8003, 8004, 8005, 8010, 8021 |
| All other | Other/unclassified tumors | 8320, 8452, 8710, 8711, 8713, 8811, 8840, 8896, 8980, 9173, 9503, 9580 |
See the CBTRUS 2014 Statistical Report and the CBTRUS website for additional information about the specific histology codes included in each group: http://www.cbtrus.org.
International Classification of Diseases for Oncology, 3rd Edition, 2000. World Health Organization, Geneva, Switzerland.
Morphology 9442/3 only.
Morphology 9442/1 only.
*All or some of this histology is included in the CBTRUS definition of gliomas, including ICD-O-3 histology codes 9380–9384, 9391–9460, 9480. See Appendix C for more information on glioma histologies.
Abbreviations: CBTRUS, Central Brain Tumor Registry of the United States; NOS, not otherwise specified.
ICD-O-3 Morphology Codes for all Histologies Included in Glioma and Embryonal Tumors Infant and Childhood Report Major Histology Groupings, CBTRUS Statistical Report: Alex's Lemonade Stand Foundation Infant and Childhood Primary Brain and Central Nervous System Tumors Diagnosed in the United States in 2007–2011.
| Infant and Childhood Report Major Histology Groupings | ICD-O-3a Morphology Code | Histology Name | Sub-histologies |
|---|---|---|---|
| Pilocytic astrocytoma | 9421/1 | Pilocytic astrocytoma | Piloid astrocytoma; Juvenile astrocytoma; Spongioblastoma, NOS |
| Other low grade glioma | 9380/3 | Glioma, malignant | Glioma, NOS |
| 9382/3 | Mixed glioma | Oligoastrocytomal; Anaplastic oligoastrocytoma | |
| 9383/1 | Subependymoma | Subependymal glioma; Subependymal astrocytoma, NOS; Mixed subependymoma-ependymoma | |
| 9384/1 | Subependymal giant cell astrocytoma | ||
| 9400/3 | Astrocytoma, NOS | Astrocytic glioma; Astroglioma; Diffuse astrocytoma; Astrocytoma; low grade; Diffuse astrocytoma, low grade; Cystic astrocytoma | |
| 9410/3 | Protoplasmic astrocytoma | ||
| 9411/3 | Gemistocytic astrocytoma | Gemistocytoma | |
| 9412/1 | Desmoplastic infantile astrocytoma | Desmoplastic infantile ganglioglioma | |
| 9413/0 | Dysembryoplastic neuroepithelial tumor | ||
| 9420/3 | Fibrillary astrocytoma | Fibrous astrocytoma | |
| 9424/3 | Pleomorphic xanthoastrocytoma | ||
| 9450/3 | Oligodendroglioma, NOS | ||
| High grade glioma | 9400/3 | Astrocytoma, NOS | Astrocytic glioma; Astroglioma; Diffuse astrocytoma; Astrocytoma; low grade; Diffuse astrocytoma, low grade;Cystic astrocytoma |
| 9401/3 | Astrocytoma, anaplastic | ||
| 9440/3 | Glioblastoma, NOS | Glioblastoma multiforme; Spongioblastoma multiforme | |
| 9441/3 | Giant cell glioblastoma | Monstrocellular sarcoma | |
| 9442/3 | Gliosarcoma | Glioblastoma with sarcomatous component | |
| 9451/3 | Oligodendroglioma, anaplastic | ||
| 9460/3 | Oligodendroblastoma | ||
| 9380/3 | Glioma, malignant | Glioma, NOS | |
| Ependymal tumors | 9391/3 | Ependymoma, NOS | Epithelial ependymoma; Cellular ependymoma; Clear cell ependymoma; Tanycytic ependymoma |
| 9392/3 | Ependymoma, anaplastic | Ependymoblastoma | |
| 9393/3 | Papillary ependymoma | ||
| 9394/1 | Myxopapillary ependymoma | ||
| Other glioma | 9380/3 | Glioma, malignant | Glioma, NOS |
| 9363/0 | Melanotic neuroectodermal tumor | Retinal anlage tumor; Melanoameloblastoma; Melanotic progonoma | |
| 9423/3 | Polar spongioblastoma | Spongioblastoma polare; Primitive polar spongioblastoma | |
| 9430/3 | Astroblastoma | ||
| 9444/1 | Chordoid glioma | Chordoid glioma of third ventricle | |
| 9442/1 | Gliofibroma | ||
| Medulloblastoma | 9470/3 | Medulloblastoma, NOS | Melanotic medulloblastoma |
| 9471/3 | Desmoplastic nodular medulloblastoma | Desmoplastic medulloblastoma; Circumscribed arachnoidal cerebellar sarcoma | |
| 9472/3 | Medullomyoblastoma | ||
| 9474/3 | Large cell medulloblastoma | ||
| Primitive neuroectodermal tumor (PNET) | 9473/3 | Primitive neuroectodermal tumor, NOS | PNET, NOS; Central primitive neuroectodermal tumor, NOS; CPNET; Supratentorial PNET |
| Atypical teratoid/rhabdoid tumor (ATRT) | 9508/3 | Atypical teratoid/rhabdoid tumor | |
| Other embryonal tumors | 8963/3 | Malignant rhabdoid tumor | Rhabdoid sarcoma; Rhabdoid tumor, NOS |
| 9364/3 | Peripheral neuroectodermal tumor | Neuroectodermal tumor, NOS; Peripheral primitive neuroectodermal tumor, NOS; PPNET | |
| 9490/0 | Ganglioneuroma | Ganglioneuroblastoma | |
| 9500/3 | Neuroblastoma, NOS | Sympathicoblastoma; Central neuroblastoma | |
| 9501/0 | Medulloepithelioma, benign | Diktyoma, benign | |
| 9501/3 | Medulloepithelioma, NOS | Diktyoma, malignant | |
| 9502/0 | Teratoid medulloepithelioma, benign | ||
| 9502/3 | Teratoid medulloepithelioma | ||
| 9504/3 | Spongioneuroblastoma |
International Classification of Diseases for Oncology, 3rd Edition, 2000. World Health Organization, Geneva, Switzerland.
Average Annual Age-Adjusted Incidence Ratesa for Childhood Brain and Central Nervous System Tumors by Site, and Age at Diagnosis, CBTRUS Statistical Report: Alex's Lemonade Stand Foundation Infant and Childhood Primary Brain and Central Nervous System Tumors Diagnosed in the United States in 2007–2011.
| Histology | Age At Diagnosis (years) | ||||||||||||||
|---|---|---|---|---|---|---|---|---|---|---|---|---|---|---|---|
| 0–14 | <1 | 1–4 | 5–9 | 10–14 | |||||||||||
| N | Rate | 95% CI | N | Rate | 95% CI | N | Rate | 95% CI | N | Rate | 95% CI | N | Rate | 95% CI | |
| Frontal, temporal, parietal, & occipital lobe | 2,522 | 0.83 | (0.80–0.86) | 163 | 0.81 | (0.69–0.94) | 556 | 0.69 | (0.63–0.75) | 729 | 0.73 | (0.68–0.78) | 1,074 | 1.04 | (0.98–1.10) |
| Frontal lobe of brain | 876 | 0.29 | (0.27–0.31) | 51 | 0.25 | (0.19–0.33) | 218 | 0.27 | (0.24–0.31) | 238 | 0.24 | (0.21–0.27) | 369 | 0.36 | (0.32–0.39) |
| Temporal lobe of brain | 1,037 | 0.34 | (0.32–0.36) | 72 | 0.36 | (0.28–0.45) | 213 | 0.26 | (0.23–0.30) | 311 | 0.31 | (0.28–0.35) | 441 | 0.43 | (0.39–0.47) |
| Parietal lobe of brain | 457 | 0.15 | (0.14–0.16) | 30 | 0.15 | (0.10–0.21) | 101 | 0.13 | (0.10–0.15) | 133 | 0.13 | (0.11–0.16) | 193 | 0.19 | (0.16–0.21) |
| Occipital lobe of brain | 152 | 0.05 | (0.04–0.06) | – | – | – | 24 | 0.03 | (0.02–0.04) | 47 | 0.05 | (0.03–0.06) | 71 | 0.07 | (0.05–0.09) |
| Cerebrum | 979 | 0.32 | (0.30–0.34) | 64 | 0.32 | (0.24–0.41) | 261 | 0.32 | (0.29–0.37) | 332 | 0.33 | (0.30–0.37) | 322 | 0.31 | (0.28–0.35) |
| Ventricle | 1,019 | 0.33 | (0.31–0.35) | 202 | 1.00 | (0.87–1.15) | 312 | 0.39 | (0.34–0.43) | 233 | 0.23 | (0.20–0.26) | 272 | 0.26 | (0.23–0.30) |
| Cerebellum | 3,001 | 0.98 | (0.95–1.02) | 131 | 0.65 | (0.54–0.77) | 1,017 | 1.26 | (1.19–1.34) | 1,072 | 1.06 | (1.00–1.13) | 781 | 0.76 | (0.71–0.81) |
| Brain stem | 1,997 | 0.66 | (0.63–0.69) | 89 | 0.44 | (0.35–0.54) | 663 | 0.82 | (0.76–0.89) | 784 | 0.78 | (0.72–0.83) | 461 | 0.45 | (0.41–0.49) |
| Other brainb | 2,439 | 0.80 | (0.77–0.83) | 310 | 1.54 | (1.37–1.72) | 740 | 0.92 | (0.85–0.99) | 711 | 0.71 | (0.66–0.76) | 678 | 0.66 | (0.61–0.71) |
| Spinal cord and cauda equina | 683 | 0.22 | (0.21–0.24) | 74 | 0.37 | (0.29–0.46) | 175 | 0.22 | (0.19–0.25) | 171 | 0.17 | (0.15–0.20) | 263 | 0.25 | (0.22–0.29) |
| Cranial nerves | 1,104 | 0.36 | (0.34–0.38) | 80 | 0.40 | (0.31–0.49) | 480 | 0.59 | (0.54–0.65) | 324 | 0.32 | (0.29–0.36) | 220 | 0.21 | (0.19–0.24) |
| Other nervous systemc | 307 | 0.10 | (0.09–0.11) | 65 | 0.32 | (0.25–0.41) | 108 | 0.13 | (0.11–0.16) | 81 | 0.08 | (0.06–0.10) | 53 | 0.05 | (0.04–0.07) |
| Meninges (cerebral & spinal) | 316 | 0.10 | (0.09–0.12) | 36 | 0.18 | (0.13–0.25) | 57 | 0.07 | (0.05–0.09) | 69 | 0.07 | (0.05–0.09) | 154 | 0.15 | (0.13–0.17) |
| Pituitary and craniopharyngeal duct | 1,252 | 0.41 | (0.39–0.44) | 17 | 0.08 | (0.05–0.13) | 141 | 0.18 | (0.15–0.21) | 401 | 0.40 | (0.36–0.44) | 693 | 0.67 | (0.62–0.72) |
| Pineal & olfactory | 425 | 0.14 | (0.13–0.15) | 24 | 0.12 | (0.08–0.18) | 82 | 0.10 | (0.08–0.13) | 114 | 0.11 | (0.09–0.14) | 205 | 0.20 | (0.17–0.23) |
| Pineal | 413 | 0.14 | (0.12–0.15) | 23 | 0.11 | (0.07–0.17) | 78 | 0.10 | (0.08–0.12) | 114 | 0.11 | (0.09–0.14) | 198 | 0.19 | (0.16–0.22) |
| Olfactory tumors of the nasal cavityb | – | – | – | – | – | – | – | – | – | – | – | – | – | – | – |
| TOTALc | 16,044 | 5.26 | (5.18–5.34) | 1,255 | 6.22 | (5.88–6.58) | 4,592 | 5.53 | (5.53–5.86) | 5,021 | 5.00 | (4.86–5.14) | 5,176 | 5.00 | (4.87–5.14) |
Rates are per 100,000 and are age-adjusted to the 2000 US standard population.
Refers to all brain tumors including histologies not presented in this table.
ICD-O-3 histology codes 9522–9523 only.
– Counts and rates are not presented when fewer than 16 cases were reported for the specific histology category. The suppressed cases are included in the counts and rates for totals.
Abbreviations: CBTRUS, Central Brain Tumor Registry of the United States; CI, confidence interval.
Many other organizations and researchers that report childhood brain tumor statistics do so using the International Classification for Childhood Cancer (ICCC) grouping system7 for pediatric cancers (Please see the CBTRUS website for additional information on this classification scheme: http://www.cbtrus.org). Frequencies and incidence of childhood brain tumors in the United States using the ICCC are presented in the CBTRUS Statistical Report: Primary Brain and Central Nervous System Tumors Diagnosed in the United States in 2007–2011.2
Methods
Counts, means, rates, ratios, proportions, and other relevant statistics were calculated using R 3.1.1 statistical software8 and/or SEER*Stat 8.1.5.9 Statistics are suppressed when counts are fewer than 16 within a cell. However, the data in the suppressed cells are included in the counts and rates for the totals. Note that reported percentages may not add up to 100% due to rounding.
Age-adjusted incidence rates and 95% confidence intervals10 for malignant and non-malignant tumors and for selected histology groupings by gender, race, Hispanic ethnicity, infant and pediatric age groups were estimated. Age-adjustment was based on one-year age groupings and standardized to the 2000 US standard population. Combined populations for the regions included in this report are shown in Appendix A and Appendix B.
CBTRUS presents statistics on specific brain and CNS tumor patterns in age groups <1, 1–4, 5–9, and 10–14 years. Race categories in this report are all races, white, black, American Indian/Alaskan Native (AIAN), and Asian/Pacific Islander (API). Other race, unspecified, and unknown race are included in statistics that are not race-specific. Hispanic ethnicity was defined using the NAACCR Hispanic Identification Algorithm, version 2, data element, which utilizes a combination of cancer registry data fields (Spanish/Hispanic Origin data element, birthplace, race, and surnames) to directly and indirectly classify cases as Hispanic or non-Hispanic.11 The NAACCR regional scheme (http://faststats.naaccr.org/usregions.php) was used for statistics reported by region of the US.
Estimated numbers of expected malignant and non-malignant brain and CNS tumors were calculated for 2015 and 2016. To project estimates of all primary brain and CNS tumors, age-adjusted brain tumor incidence rates for 2007–2011 were multiplied by the projected population. Projected population estimates for 2015 and 2016 were obtained from the interim projections from 2000–2030 based on the 2000 Census.5
Age-adjusted mortality rates for deaths resulting from all malignant brain and CNS tumors were calculated using the mortality data available in the CDC WONDER Online Database provided by NCHS.12 The SEER cause of death recode13 was used to categorize all mortality data used in this report. In addition to total age-adjusted rate for the US, age-adjusted rates are presented by gender and state.
SEER*Stat 8.1.5 statistical software was used to estimate one-, two-, three-, four-, five-, and ten-year relative survival rates for primary malignant brain tumor cases diagnosed between 1995–2011 in eighteen SEER areas.9,14 This software utilizes life-table (actuarial) methods to compute survival estimates and accounts for current follow-up.
Survival analysis was conducted using multiple-year cohorts, which include all persons diagnosed during the time period specified for the survival calculation.15 Second or later primary tumors, cases diagnosed at autopsy, cases in which race or sex is coded as other or unknown, and cases known to be alive but for whom follow-up time could not be calculated, were excluded from the SEER survival data analyses (∼1% of total cases of malignant primary brain tumor in children under 15 in the SEER database from 1973–2011). Survival was not calculated for non-malignant tumors as collection of these cases has only been mandated since 2004, and therefore, not enough time has elapsed to accurately calculate relative survival. Please note that survival statistics are reported for pilocytic astrocytoma, which has traditionally been included as a malignant tumor for cancer registration purposes although this tumor is clinically considered to be non-malignant. This decision has been influenced by the importance of location in the CNS to the morbidity and mortality caused by brain and CNS tumors.
Total deaths by specific histology group were calculated using data on primary malignant brain tumor cases diagnosed between 1995–2011 in eighteen SEER areas.9,14 Using only persons that died due to disease, we used month of diagnosis, year of diagnosis, survival months, and age of diagnosis to calculate approximate month and year of death and approximate age at death.
Five-year conditional survival estimates were calculated for brain tumor cases diagnosed between 1995–2011 in eighteen SEER areas using SEER*Stat 8.1.5 statistical software.9,14 Conditional survival is an estimate of the probability that a patient will survive for a specific time period given that they have already survived a certain number of years. For example, 5-year conditional survival for a child who has lived two years since their diagnosis with pilocytic astrocytoma is 98.5%, which means that 98.5% of children 0–14 years who have already survived two years will eventually survive five years.
Results
Cancer is a significant source of morbidity and mortality for infants and children ages 0–14 years in the US. The overall average annual age-adjusted incidence rate for children 0–14 years between 2007 and 2011 was 5.26 per 100,000 population (16,044 total tumors). Approximately 1 in 2,000 children born from 2009–2011 will be diagnosed with a primary malignant brain or CNS tumor by the time they are 14 years.16 These tumors continue to be the most common solid tumor in infants and children 0–14 years.
In children ages 1–4 and 5–14 years cancer is the 4th and 2nd most common causes of death, respectively (Figure 1a). Brain and CNS tumors are the most common cause of cancer death in children 0–14 years in the United States (Figure 1b).
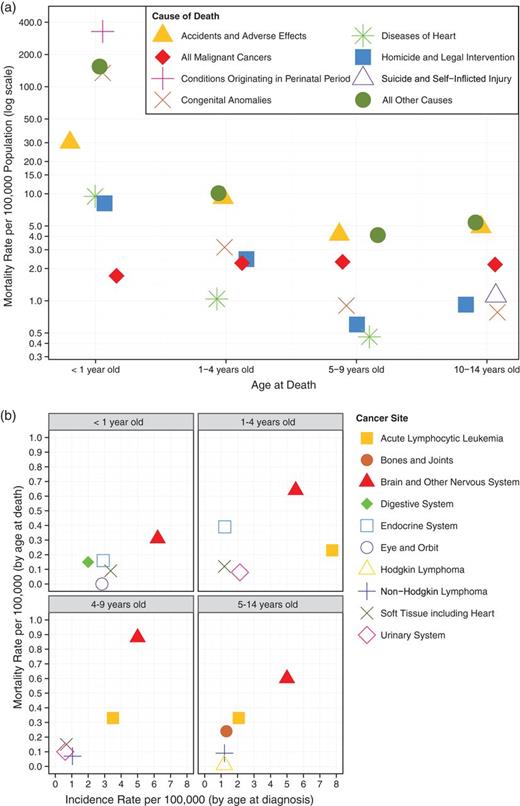
(a) Average Annual Mortality Rates and Total Deaths for Top 5 Causes of Death and Death Due To Malignant Neoplasms for Children 0–14 by Age Groups (NVSS 2007–2011), (b) Average Annual Mortality Rates and Total Deaths for Top 5 Causes of Death Due to Cancer for Children 0–14 by Age Groups, 2007–2011 (NVSS 2007–2011, CBTRUS 2007–2011, USCS 2007–2011)
Comparison to Other Common Childhood Cancers
Average annual age-adjusted incidence rates for primary brain and CNS tumors, leukemias, and lymphoma in the United States are presented by age in Figures 2a (age < 1 year), 2b (ages 1–4 years), 2c (ages 5–9 years), and 2d (ages 10–14 years). Brain and CNS tumors were the most common cancer in children <1, and 5–14. For those aged 1–4 years, leukemias were the most commonly occurring cancer though brain and CNS tumors were still the most commonly occurring solid tumor across all age groups 0–14 years.
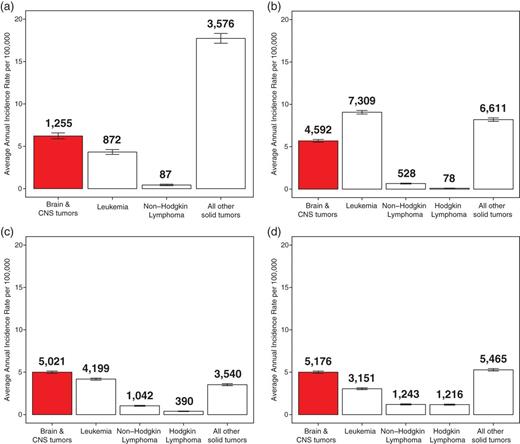
Average Annual Age-Adjusted Incidence Rates of All Primary Brain And CNS Tumors in Comparison to Leukemias And Lymphomas in (a) Infants (<1 Year Old), (b) Children 1–4 Years, (c) Children 5–9 Years, and (d) Children 10–14 Years (CBTRUS 2007–2011, USCS 2007–2011)
Overall Incidence by Age Group and Year of Diagnosis
Incidence of brain and CNS tumors was highest in infants (<1 year old), who had an overall incidence rate of 6.22 per 100,000 (1,255 tumors), followed by children ages 1–4 years who had an incidence rate of 5.53 per 100,000 (4,592 tumors). Children ages 5–14 years had an age-adjusted incidence of 5.00 per 100,000 (5–9: 5,021 tumors; 10–14: 5,176 tumors) (Figure 3). Incidence of brain and CNS tumors was stable over the time period examined (Figure 4).
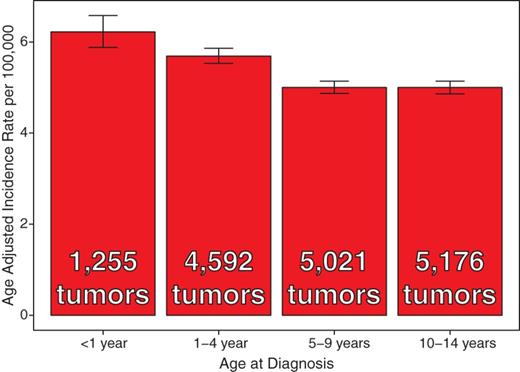
Average Annual Age-Adjusted Incidence Rates of Primary Brain and CNS Tumors by Age Group (N = 16,044) (CBTRUS 2007–2011)
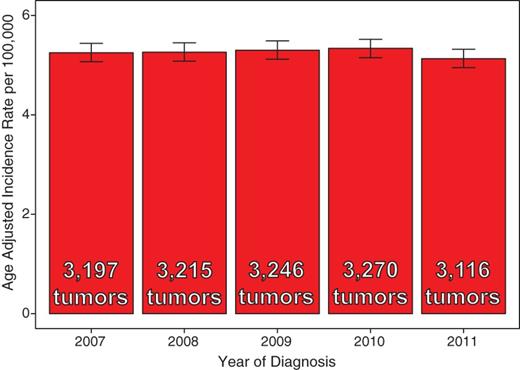
Annual Age-Adjusted Incidence Rates of Primary Brain and CNS Tumors by Year of Diagnosis (N = 16,044) (CBTRUS 2007–2011)
Incidence by Region of the United States, And Age Group
Incidence of brain and CNS tumors varied by region of the United States (Figure 5). Overall age-adjusted incidence was highest in the Middle Atlantic (5.78 per 100,000, 95% CI: 5.53–6.02) and West South Central (5.75 per 100,000, 95% CI: 5.51–5.99) regions, and lowest in the Mountain (4.69 per 100,000, 95% CI: 4.40–4.99) and Pacific (4.69 per 100,000, 95% CI: 4.51–4.88) regions.
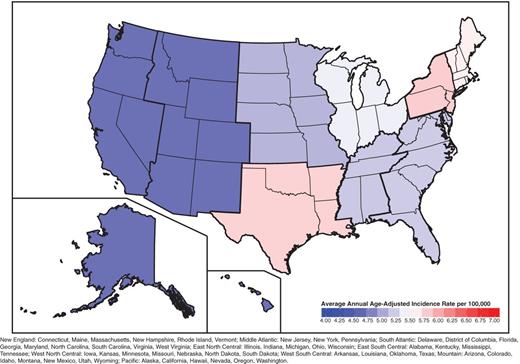
Average Annual Age-Adjusted Incidence Rates of All Primary Brain and CNS Tumors by Region of the United States (0–14 Years) (N = 16,044) (CBTRUS 2007–2011)
Incidence by region and age groups is presented in Table 7.
Incidence in infants (<1 year old) was highest in West South Central (7.00 per 100,000, 95% CI: 6.04–8.07), Middle Atlantic (6.85 per 100,000, 95% CI: 5.85–7.97), and East North Central (6.80 per 100,000, 95% CI: 5.88–7.81). It was lowest in West North Central (5.08 per 100,000, 95% CI: 6.04–8.07), and Pacific (5.31 per 100,000, 95% CI: 4.57–6.12).
Incidence in children 1–4 years was highest in West South Central (6.10 per 100,000, 95% CI: 5.65–6.59) and Middle Atlantic (6.08 per 100,000, 95% CI: 5.60–6.60). It was lowest in East South Central (4.75 per 100,000, 95% CI: 4.16–5.41) and Pacific (4.99 per 100,000, 95% CI: 4.63–5.38).
Incidence in children 5–9 years was highest in West South Central (5.60 per 100,000, 95% CI: 5.20–6.02), and lowest in Mountain (4.25 per 100,000, 95% CI: 3.78–4.77)
Incidence in children 10–14 years was highest in Middle Atlantic (5.82 per 100,000, 95% CI: 5.41–6.25), New England (5.41 per 100,000, 95% CI: 4.76–6.12) and West South Central (5.39 per 100,000, 95% CI: 5.00–5.80). It was lowest in West North Central (4.43 per 100,000, 95% CI: 3.94–4.95) and Pacific (4.50 per 100,000, 95% CI: 4.19–4.82).
Distribution by Site and Age Group
The distribution of brain and CNS tumors by site is shown in Figure 6, and the distribution of tumors by site in each age group is shown in Figures 7a-7d. Frequencies for each age group are presented in Table 3.
The most common site was the cerebellum (18.7%), followed by the frontal, temporal, parietal, and occipital lobes (15.7%).
The most common site in infants (<1 year old) was other brain (24.7%), followed by ventricle (16.1%). Other brain is a designation used in cancer registry data when the location of a tumor is not identified in a patient's record, or when a tumor involves multiple locations in the brain (Please see Table 1 for more information about the specific sites included in these groups).
The most common site in children 1–4 years was the cerebellum (22.1%), followed by other brain (16.1%) and brain stem (14.4%).
In children 5–9, cerebellum was also the most common site (21.4%), followed by brain stem (15.6%), and frontal, temporal, parietal, and occipital lobes (14.5%)
In children 10–14, the most common site of disease was the frontal, temporal, parietal and occipital lobes (20.7%).
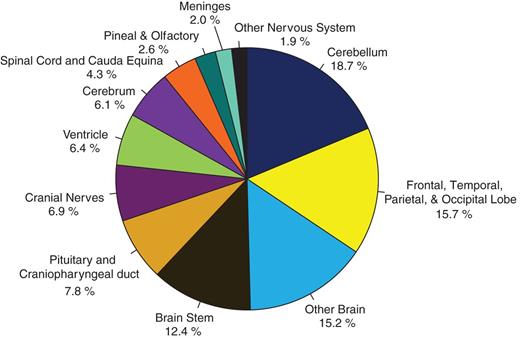
Distribution of All Primary Brain and CNS Tumors by Site (0–14 Years) (N = 16,044) (CBTRUS 2007–2011)
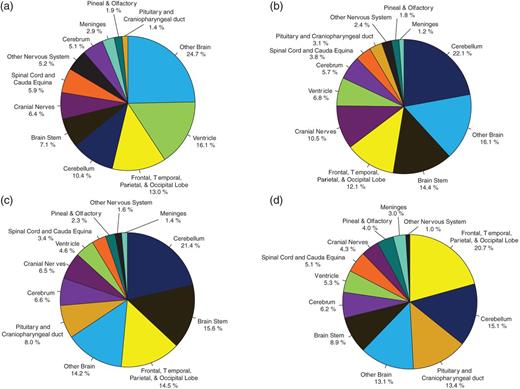
Distribution of all Primary Brain and CNS Tumors by Site for (a) Infants <1 Year Old (N = 1,255), (b) Children 1–4 Years (N = 4,592), (c) Children 5–9 Years (N = 5,021), and (d) Children 10–14 Years (N = 5,176) (CBTRUS 2007–2011)
Distribution and Incidence by Histologic Group and Age Group
The distribution of brain and CNS tumors by histologic group is shown in Figure 8, and the distribution of tumors by histologic group in each age group is shown in Figures 9a-9d. Frequencies for each age group are presented in Tables 4 and 5.
The most common histologic group in all ages was glioma (52.9%), of which the majority were pilocytic astrocytoma (33.2%) and other low grade gliomas (27.1%).
In infants (<1 year old), gliomas (37.2%) and embryonal tumors (24.9%) were the most commonly occurring tumor type. Of embryonal tumors, 42.9% were atypical teratoid/rhabdoid tumors.
In children 1–4 years, gliomas (58.1%) and embryonal tumors (20.2%) were the most common tumor type.
Gliomas (56.5%) and embryonal tumors (14.8%) were also the most common histologic groups in children 5–9 years. Medulloblastoma represented 80.4% of all embryonal tumors in this age group.
In children 10–14 years, gliomas (48.6%), tumors of the pituitary (8.9%), and embryonal tumors (8.3%) were the most commonly occurring histologic types.
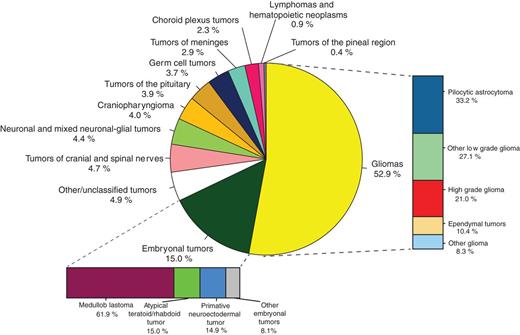
Distribution of All Primary Brain and CNS Tumors by Histology Groupings (0–14 Years) (N = 16,044) (CBTRUS 2007–2011)
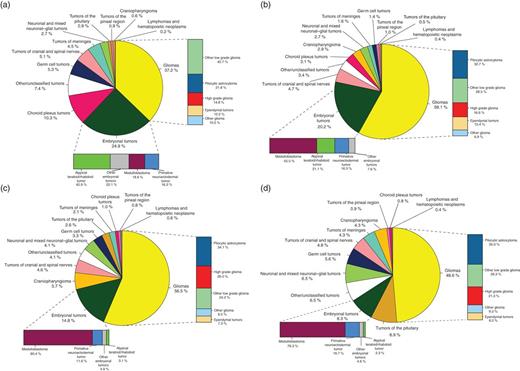
Distribution of All Primary Brain and CNS Tumors by Histology Groupings for (a) Infants <1 Year Old (N = 1,255), (b) Children 1–4 Years (N = 4,592), (c) Children 5–9 Years (N = 5,021), and (d) Children 10–14 Years (N = 5,176) (CBTRUS 2007–2011)
Incidence by Gender
Overall, approximately 52.8% of all tumors occurred in males (8,479 total tumors) and 47.2% occurred in females (7,565 total tumors). Counts and incidence rates by histologic groups and gender are presented in Table 4. Incidence by Race and Ethnicity
Most histologies were more common in males, or equivocal between genders.
Embryonal tumors, especially medulloblastoma, were more common in males. Age-adjusted incidence of embryonal tumors was 0.91 per 100,000 in males, as compared to 0.65 per 100,000 in females.
Counts and incidence rates by histologic groups and race are presented in Table 6.
Incidence of brain and CNS tumors was highest in Whites and Asian/Pacific islanders (API). Overall age-adjusted incidence in these groups was 5.46 per 100,000, and 6.05 per 100,000, respectively.
Gliomas and embryonal tumors were most common in white children, with age-adjusted incidence rates of 2.92 per 100,000 and 0.84 per 100,000, respectively.
Germ cell tumors and tumors of the cranial and spinal nerves were most common in API children, with age-adjusted incidence rates of 0.52 per 100,000 and 0.39 per 100,000, respectively.
Average Annual Age-Adjusted Incidence Ratesa for Brain and Central Nervous System Tumors by Major Histology Groupings, Histology, and Gender, CBTRUS Statistical Report: Alex's Lemonade Stand Foundation Infant and Childhood Primary Brain and Central Nervous System Tumors Diagnosed in the United States in 2007–2011
| Total | Male | Female | IRR (Male:Female) | ||||||||||
|---|---|---|---|---|---|---|---|---|---|---|---|---|---|
| Histology | N | % of All Tumors | Median Age | Rate | 95% CI | N | Rate | 95% CI | N | Rate | 95% CI | IRR | p-value |
| Gliomas | 8,487 | 52.9% | 6.0 | 2.78 | (2.72–2.84) | 4,386 | 2.81 | (2.73–2.90) | 4,101 | 2.75 | (2.67–2.83) | 0.98 | 0.29 |
| Pilocytic astrocytoma | 2,821 | 17.6% | 7.0 | 0.93 | (0.89–0.96) | 1,452 | 0.93 | (0.89–0.98) | 1,369 | 0.92 | (0.87–0.97) | 0.98 | 0.67 |
| Other low grade glioma | 2,296 | 14.3% | 6.0 | 0.75 | (0.72–0.78) | 1,188 | 0.76 | (0.72–0.80) | 1,108 | 0.74 | (0.70–0.79) | 0.98 | 0.58 |
| High grade glioma | 1,784 | 11.1% | 7.0 | 0.59 | (0.56–0.62) | 898 | 0.58 | (0.54–0.62) | 886 | 0.60 | (0.56–0.64) | 1.03 | 0.55 |
| Ependymal tumors | 879 | 5.5% | 4.0 | 0.29 | (0.27–0.30) | 510 | 0.32 | (0.30–0.35) | 369 | 0.24 | (0.22–0.27) | 0.76 | <0.01 |
| Other glioma | 707 | 4.4% | 7.0 | 0.23 | (0.22–0.25) | 338 | 0.22 | (0.20–0.24) | 369 | 0.25 | (0.22–0.27) | 1.14 | 0.09 |
| Choroid plexus tumors | 362 | 2.3% | 1.0 | 0.12 | (0.10–0.13) | 200 | 0.13 | (0.11–0.14) | 162 | 0.11 | (0.09–0.12) | 0.85 | 0.14 |
| Tumors of the pineal region | 701 | 4.4% | 6.5 | 0.23 | (0.21–0.25) | 384 | 0.25 | (0.22–0.27) | 317 | 0.21 | (0.19–0.24) | 0.86 | 0.05 |
| Neuronal and mixed neuronal-glial tumors | 140 | 0.9% | 9.0 | 0.05 | (0.04–0.05) | 71 | 0.05 | (0.04–0.06) | 69 | 0.05 | (0.04–0.06) | 1.01 | 1.00 |
| Embryonal tumors | 2,413 | 15.0% | 4.0 | 0.79 | (0.76–0.82) | 1,429 | 0.91 | (0.87–0.96) | 984 | 0.65 | (0.61–0.70) | 0.72 | <0.01 |
| Medulloblastoma | 1,494 | 9.3% | 6.0 | 0.49 | (0.47–0.52) | 929 | 0.60 | (0.56–0.64) | 565 | 0.38 | (0.35–0.41) | 0.63 | <0.01 |
| Primitive neuroectodermal tumor | 360 | 2.2% | 3.5 | 0.12 | (0.10–0.13) | 197 | 0.13 | (0.11–0.14) | 163 | 0.11 | (0.09–0.13) | 0.86 | 0.18 |
| Atypical teratoid/rhabdoid tumor | 363 | 2.3% | 1.0 | 0.12 | (0.10–0.13) | 197 | 0.12 | (0.11–0.14) | 166 | 0.11 | (0.09–0.13) | 0.88 | 0.24 |
| Other embryonal tumors | 196 | 1.2% | 1.0 | 0.06 | (0.05–0.07) | 106 | 0.07 | (0.06–0.08) | 90 | 0.06 | (0.05–0.07) | 0.88 | 0.42 |
| Tumors of cranial and spinal nerves | 758 | 4.7% | 7.0 | 0.25 | (0.23–0.27) | 403 | 0.26 | (0.23–0.28) | 355 | 0.24 | (0.21–0.26) | 0.93 | 0.30 |
| Tumors of meninges | 458 | 2.9% | 9.0 | 0.15 | (0.14–0.16) | 226 | 0.14 | (0.13–0.16) | 232 | 0.16 | (0.14–0.18) | 1.07 | 0.49 |
| Lymphomas and hematopoietic neoplasms | 70 | 0.4% | 6.0 | 0.02 | (0.02–0.03) | 46 | 0.03 | (0.02–0.04) | 24 | 0.02 | (0.01–0.02) | 0.55 | 0.02 |
| Germ cell tumors | 590 | 3.7% | 9.0 | 0.19 | (0.18–0.21) | 358 | 0.23 | (0.21–0.26) | 232 | 0.16 | (0.14–0.18) | 0.68 | <0.01 |
| Tumors of the pituitary | 625 | 3.9% | 12.0 | 0.20 | (0.19–0.22) | 227 | 0.15 | (0.13–0.17) | 398 | 0.27 | (0.24–0.29) | 1.83 | <0.01 |
| Craniopharyngioma | 648 | 4.0% | 8.0 | 0.21 | (0.20–0.23) | 326 | 0.21 | (0.19–0.24) | 322 | 0.22 | (0.19–0.24) | 1.03 | 0.76 |
| Other/unclassified tumors | 792 | 4.9% | 9.0 | 0.26 | (0.24–0.28) | 423 | 0.27 | (0.25–0.30) | 369 | 0.25 | (0.22–0.27) | 0.91 | 0.19 |
| TOTALb | 16,044 | 100.0% | 7.0 | 5.26 | (5.18–5.34) | 8,479 | 5.44 | (5.32–5.56) | 7,565 | 5.07 | (4.95–5.18) | 0.93 | <0.01 |
Rates are per 100,000 and are age-adjusted to the 2000 US standard population.
Refers to all brain tumors including histologies not presented in this table.
–Counts are not presented when fewer than 16 cases were reported for the specific histology category. Suppressed cases are included in the total count.
Abbreviations: CBTRUS, Central Brain Tumor Registry of the United States; CI, confidence interval; IRR: incidence rate ratio.
Average Annual Age-Adjusted Incidence Ratesa for Childhood Brain and Central Nervous System Tumors by Major Histology Groupings, Histology, and Age at Diagnosis, CBTRUS Statistical Report: Alex's Lemonade Stand Foundation Infant and Childhood Primary Brain and Central Nervous System Tumors Diagnosed in the United States in 2007–2011
| Age At Diagnosis (years) | ||||||||||||
|---|---|---|---|---|---|---|---|---|---|---|---|---|
| <1 | 1–4 | 5–9 | 10–14 | |||||||||
| Histology | N | Rate | 95% CI | N | Rate | 95% CI | N | Rate | 95% CI | N | Rate | 95% CI |
| Gliomas | 467 | 2.32 | (2.11–2.54) | 2,667 | 3.31 | (3.18–3.44) | 2,836 | 2.82 | (2.72–2.92) | 2,517 | 2.44 | (2.34–2.53) |
| Pilocytic astrocytoma | 102 | 0.51 | (0.41–0.61) | 871 | 1.08 | (1.01–1.16) | 968 | 0.96 | (0.90–1.02) | 880 | 0.85 | (0.80–0.91) |
| Other low grade glioma | 190 | 0.94 | (0.81–1.09) | 760 | 0.94 | (0.88–1.01) | 685 | 0.68 | (0.63–0.74) | 661 | 0.64 | (0.59–0.69) |
| High grade glioma | 69 | 0.34 | (0.27–0.43) | 443 | 0.55 | (0.50–0.61) | 736 | 0.73 | (0.68–0.79) | 536 | 0.52 | (0.48–0.57) |
| Ependymal tumors | 57 | 0.28 | (0.21–0.37) | 410 | 0.51 | (0.46–0.56) | 206 | 0.20 | (0.18–0.23) | 206 | 0.20 | (0.17–0.23) |
| Other glioma | 49 | 0.24 | (0.18–0.32) | 183 | 0.23 | (0.20–0.26) | 241 | 0.24 | (0.21–0.27) | 234 | 0.23 | (0.20–0.26) |
| Choroid plexus tumors | 129 | 0.64 | (0.53–0.76) | 142 | 0.18 | (0.15–0.21) | 50 | 0.05 | (0.04–0.07) | 41 | 0.04 | (0.03–0.05) |
| Tumors of the pineal region | 34 | 0.17 | (0.12–0.24) | 124 | 0.15 | (0.13–0.18) | 205 | 0.20 | (0.18–0.23) | 338 | 0.33 | (0.29–0.36) |
| Neuronal and mixed neuronal-glial tumors | – | – | – | 47 | 0.06 | (0.04–0.08) | 38 | 0.04 | (0.03–0.05) | 44 | 0.04 | (0.03–0.06) |
| Embryonal tumors | 312 | 1.55 | (1.38–1.73) | 929 | 1.15 | (1.08–1.23) | 741 | 0.74 | (0.68–0.79) | 431 | 0.42 | (0.38–0.46) |
| Medulloblastoma | 58 | 0.29 | (0.22–0.37) | 511 | 0.63 | (0.58–0.69) | 596 | 0.59 | (0.55–0.64) | 329 | 0.32 | (0.29–0.36) |
| Primitive neuroectodermal tumor | 51 | 0.25 | (0.19–0.33) | 151 | 0.19 | (0.16–0.22) | 86 | 0.09 | (0.07–0.11) | 72 | 0.07 | (0.05–0.09) |
| Atypical teratoid/rhabdoid tumor | 134 | 0.66 | (0.56–0.79) | 196 | 0.24 | (0.21–0.28) | 23 | 0.02 | (0.01–0.03) | – | – | – |
| Other embryonal tumors | 69 | 0.34 | (0.27–0.43) | 71 | 0.09 | (0.07–0.11) | 36 | 0.04 | (0.03–0.05) | 20 | 0.02 | (0.01–0.03) |
| Tumors of cranial and spinal nerves | 64 | 0.32 | (0.24–0.41) | 214 | 0.27 | (0.23–0.30) | 230 | 0.23 | (0.20–0.26) | 250 | 0.24 | (0.21–0.27) |
| Tumors of meninges | 57 | 0.28 | (0.21–0.37) | 73 | 0.09 | (0.07–0.11) | 105 | 0.10 | (0.09–0.13) | 223 | 0.21 | (0.19–0.24) |
| Lymphomas and hematopoietic neoplasms | – | – | – | 17 | 0.02 | (0.01–0.03) | 28 | 0.03 | (0.02–0.04) | 22 | 0.02 | (0.01–0.03) |
| Germ cell tumors | 67 | 0.33 | (0.26–0.42) | 66 | 0.08 | (0.06–0.10) | 165 | 0.17 | (0.14–0.19) | 292 | 0.28 | (0.25–0.32) |
| Tumors of the pituitary | – | – | – | 23 | 0.03 | (0.02–0.04) | 129 | 0.13 | (0.11–0.15) | 462 | 0.44 | (0.40–0.48) |
| Craniopharyngioma | – | – | – | 132 | 0.16 | (0.14–0.19) | 288 | 0.29 | (0.26–0.32) | 221 | 0.21 | (0.19–0.24) |
| Other/unclassified tumors | 93 | 0.46 | (0.37–0.56) | 158 | 0.20 | (0.17–0.23) | 206 | 0.21 | (0.18–0.24) | 335 | 0.32 | (0.29–0.36) |
| TOTALb | 1,255 | 6.22 | (5.88–6.58) | 4,592 | 5.53 | (5.53–5.86) | 5,021 | 5.00 | (4.86–5.14) | 5,176 | 5.00 | (4.87–5.14) |
Rates are per 100,000 and are age-adjusted to the 2000 US standard population.
Refers to all brain tumors including histologies not presented in this table.
– Counts and rates are not presented when fewer than 16 cases were reported for the specific histology category. The suppressed cases are included in the counts and rates for totals.
Abbreviations: CBTRUS, Central Brain Tumor Registry of the United States; CI, confidence interval.
Average Annual Age-Adjusted Incidence Ratesa for Brain and Central Nervous System Tumors by Major Histology Groupings, Histology, and Raceb, CBTRUS Statistical Report: Alex's Lemonade Stand Foundation Infant and Childhood Primary Brain and Central Nervous System Tumors Diagnosed in the United States in 2007–2011
| White | Black | AIAN | API | |||||||||
|---|---|---|---|---|---|---|---|---|---|---|---|---|
| Histology | N | Rate | 95% CI | N | Rate | 95% CI | N | Rate | 95% CI | N | Rate | 95% CI |
| Gliomas | 6,786 | 2.92 | (2.85–2.99) | 1,104 | 2.21 | (2.08–2.34) | 68 | 1.25 | (0.97–1.59) | 470 | 2.78 | (2.54–3.05) |
| Pilocytic astrocytoma | 2,290 | 0.99 | (0.95–1.03) | 343 | 0.68 | (0.61–0.76) | 20 | 0.36 | (0.22–0.56) | 149 | 0.88 | (0.74–1.03) |
| Other low grade glioma | 1,866 | 0.80 | (0.77–0.84) | 269 | 0.54 | (0.47–0.60) | 19 | 0.35 | (0.21–0.55) | 126 | 0.74 | (0.62–0.89) |
| High grade glioma | 1,370 | 0.59 | (0.56–0.62) | 286 | 0.58 | (0.51–0.65) | – | – | – | 99 | 0.59 | (0.48–0.72) |
| Ependymal tumors | 699 | 0.30 | (0.28–0.32) | 118 | 0.23 | (0.19–0.28) | – | – | – | 45 | 0.26 | (0.19–0.35) |
| Other glioma | 561 | 0.24 | (0.22–0.26) | 88 | 0.18 | (0.14–0.22) | – | – | – | 51 | 0.31 | (0.23–0.41) |
| Choroid plexus tumors | 299 | 0.13 | (0.11–0.14) | 33 | 0.06 | (0.04–0.09) | – | – | – | 26 | 0.15 | (0.10–0.22) |
| Tumors of the pineal region | 562 | 0.24 | (0.22–0.26) | 86 | 0.17 | (0.14–0.21) | – | – | – | 44 | 0.26 | (0.19–0.35) |
| Neuronal and mixed neuronal-glial tumors | 87 | 0.04 | (0.03–0.05) | 43 | 0.09 | (0.06–0.12) | – | – | – | – | – | – |
| Embryonal tumors | 1,964 | 0.84 | (0.81–0.88) | 282 | 0.56 | (0.49–0.62) | 16 | 0.29 | (0.17–0.47) | 123 | 0.71 | (0.59–0.85) |
| Medulloblastoma | 1,237 | 0.53 | (0.50–0.56) | 151 | 0.30 | (0.26–0.36) | – | – | – | 76 | 0.44 | (0.35–0.56) |
| Primitive neuroectodermal tumor | 288 | 0.12 | (0.11–0.14) | 52 | 0.10 | (0.08–0.13) | – | – | – | – | – | – |
| Atypical teratoid/rhabdoid tumor | 289 | 0.12 | (0.11–0.14) | 43 | 0.08 | (0.06–0.11) | – | – | – | 26 | 0.14 | (0.09–0.21) |
| Other embryonal tumors | 150 | 0.06 | (0.05–0.08) | 36 | 0.07 | (0.05–0.10) | – | – | – | – | – | – |
| Tumors of cranial and spinal nerves | 565 | 0.24 | (0.22–0.26) | 112 | 0.22 | (0.18–0.27) | – | – | – | 66 | 0.39 | (0.30–0.50) |
| Tumors of meninges | 366 | 0.16 | (0.14–0.17) | 56 | 0.11 | (0.08–0.14) | – | – | – | 30 | 0.18 | (0.12–0.26) |
| Lymphomas and hematopoietic neoplasms | 51 | 0.02 | (0.02–0.03) | – | – | – | – | – | – | – | – | – |
| Germ cell tumors | 440 | 0.19 | (0.17–0.21) | 59 | 0.12 | (0.09–0.15) | – | – | – | 85 | 0.52 | (0.41–0.64) |
| Tumors of the pituitary | 481 | 0.21 | (0.19–0.23) | 86 | 0.17 | (0.14–0.21) | – | – | – | 48 | 0.30 | (0.22–0.40) |
| Craniopharyngioma | 488 | 0.21 | (0.19–0.23) | 104 | 0.21 | (0.17–0.25) | – | – | – | 46 | 0.27 | (0.20–0.37) |
| Other/unclassified tumors | 615 | 0.27 | (0.24–0.29) | 94 | 0.19 | (0.15–0.23) | – | – | – | 71 | 0.42 | (0.33–0.53) |
| TOTALc | 12,704 | 5.46 | (5.37–5.56) | 2,069 | 4.12 | (3.94–4.30) | 134 | 2.46 | (2.06–2.92) | 1,020 | 6.05 | (5.69–6.44) |
Rates are per 100,000 and are age-adjusted to the 2000 US standard population.
Individuals with unknown race were excluded
Refers to all brain tumors including histologies not presented in this table.
- Counts are not presented when fewer than 16 cases were reported for the specific histology category. Suppressed cases are included in the total count.
Abbreviations: CBTRUS, Central Brain Tumor Registry of the United States; CI, confidence interval; AIAN, American Indian/Alaskan Native; API, Asian/Pacific Islander.
Counts and incidence rates by histologic groups and ethnicity are presented in Table 7.
Incidence of brain and CNS tumors was highest in non-Hispanic children, with an overall age-adjusted incidence of 5.53 per 100,000 as compared to 4.36 per 100,000 in Hispanic children.
Specific histologies that occurred more frequently in non-Hispanic children included: pilocytic astrocytomas, other low grade gliomas, tumors of the pineal region, medulloblastoma, and tumors of cranial and spinal nerves. Other histologies occurred at similar rates within both groups.
Average Annual Age-Adjusted Incidence Ratesa for Brain and Central Nervous System Tumors by Major Histology Groupings, Histology, and Hispanic Ethnicityb, CBTRUS Statistical Report: Alex's Lemonade Stand Foundation Infant and Childhood Primary Brain and Central Nervous System Tumors Diagnosed in the United States in 2007–2011
| Hispanic | Non-Hispanic | |||||
|---|---|---|---|---|---|---|
| Histology | N | Rate | 95% CI | N | Rate | 95% CI |
| Gliomas | 1,512 | 2.13 | (2.02–2.24) | 6,975 | 2.98 | (2.91–3.05) |
| Pilocytic astrocytoma | 458 | 0.65 | (0.59–0.71) | 2,363 | 1.01 | (0.97–1.05) |
| Other low grade glioma | 372 | 0.52 | (0.47–0.58) | 1,924 | 0.82 | (0.79–0.86) |
| High grade glioma | 372 | 0.53 | (0.48–0.59) | 1,412 | 0.60 | (0.57–0.64) |
| Ependymal tumors | 195 | 0.27 | (0.23–0.31) | 684 | 0.29 | (0.27–0.31) |
| Other glioma | 115 | 0.16 | (0.13–0.19) | 592 | 0.25 | (0.23–0.27) |
| Choroid plexus tumors | 81 | 0.11 | (0.09–0.13) | 281 | 0.12 | (0.11–0.14) |
| Tumors of the pineal region | 119 | 0.17 | (0.14–0.21) | 582 | 0.25 | (0.23–0.27) |
| Neuronal and mixed neuronal-glial tumors | 30 | 0.04 | (0.03–0.06) | 110 | 0.05 | (0.04–0.06) |
| Embryonal tumors | 505 | 0.69 | (0.63–0.75) | 1,908 | 0.82 | (0.78–0.85) |
| Medulloblastoma | 302 | 0.42 | (0.37–0.47) | 1,192 | 0.51 | (0.48–0.54) |
| Primitive neuroectodermal tumor | 70 | 0.10 | (0.07–0.12) | 290 | 0.12 | (0.11–0.14) |
| Atypical teratoid/rhabdoid tumor | 97 | 0.12 | (0.10–0.15) | 266 | 0.11 | (0.10–0.13) |
| Other embryonal tumors | 36 | 0.05 | (0.03–0.07) | 160 | 0.07 | (0.06–0.08) |
| Tumors of cranial and spinal nerves | 128 | 0.18 | (0.15–0.22) | 630 | 0.27 | (0.25–0.29) |
| Tumors of meninges | 79 | 0.11 | (0.09–0.14) | 379 | 0.16 | (0.14–0.18) |
| Lymphomas and hematopoietic neoplasms | 19 | 0.03 | (0.02–0.04) | 51 | 0.02 | (0.02–0.03) |
| Germ cell tumors | 119 | 0.17 | (0.14–0.21) | 471 | 0.20 | (0.18–0.22) |
| Tumors of the pituitary | 158 | 0.24 | (0.20–0.28) | 467 | 0.20 | (0.18–0.21) |
| Craniopharyngioma | 154 | 0.22 | (0.19–0.26) | 494 | 0.21 | (0.19–0.23) |
| Other/unclassified tumors | 186 | 0.27 | (0.23–0.31) | 606 | 0.26 | (0.24–0.28) |
| TOTALc | 3,090 | 4.36 | (4.21–4.56) | 12,954 | 5.53 | (5.43–5.62) |
Rates are per 100,000 and are age-adjusted to the 2000 US standard population.
Hispanic ethnicity is not mutually exclusive of race; Classified using the North American Association of Central Cancer Registries Hispanic Identification Algorithm, version 2 (NHIA v2).
Refers to all brain tumors including histologies not presented in this table.
- Counts are not presented when fewer than 16 cases were reported for the specific histology category. Suppressed cases are included in the total count.
Abbreviations: CBTRUS, Central Brain Tumor Registry of the United States; CI, confidence interval.
Average Annual Age-Adjusted Incidence Ratesa for Childhood Brain and Central Nervous System Tumors by Region of the United States and Age at Diagnosis, CBTRUS Statistical Report: Alex's Lemonade Stand Foundation Infant and Childhood Primary Brain and Central Nervous System Tumors Diagnosed in the United States in 2007–2011
| Age At Diagnosis (years) | ||||||||||||||||
|---|---|---|---|---|---|---|---|---|---|---|---|---|---|---|---|---|
| 0–14 | <1 | 1–4 | 5–9 | 10–14 | ||||||||||||
| Region | Included states | N | Rate | 95% CI | N | Rate | 95% CI | N | Rate | 95% CI | N | Rate | 95% CI | N | Rate | 95% CI |
| New England | Connecticut, Maine, Massachusetts, New Hampshire, Rhode Island, Vermont; | 720 | 5.59 | (5.19–6.01) | 50 | 6.38 | (4.74–8.41) | 192 | 5.96 | (5.14–6.86) | 228 | 5.33 | (4.66–6.07) | 250 | 5.41 | (4.76–6.12) |
| Middle Atlantic | New Jersey, New York, Pennsylvania; | 2,175 | 5.78 | (5.53–6.02) | 168 | 6.85 | (5.85–7.97) | 590 | 6.08 | (5.60–6.60) | 654 | 5.29 | (4.89–5.71) | 763 | 5.82 | (5.41–6.25) |
| South Atlantic | Delaware, District of Columbia, Florida, Georgia, Maryland, North Carolina, South Carolina, Virginia, West Virginia | 2,948 | 5.20 | (5.01–5.39) | 230 | 6.09 | (5.33–6.93) | 884 | 5.87 | (5.49–6.27) | 897 | 4.81 | (4.50–5.14) | 937 | 4.90 | (4.59–5.22) |
| East North Central | Illinois, Indiana, Michigan, Ohio, Wisconsin | 2,482 | 5.40 | (5.19–5.61) | 198 | 6.80 | (5.88–7.81) | 701 | 5.91 | (5.48–6.36) | 777 | 5.08 | (4.73–5.45) | 806 | 5.06 | (4.72–5.42) |
| East South Central | Alabama, Kentucky, Mississippi, Tennessee | 943 | 5.19 | (4.87–5.53) | 82 | 6.77 | (5.39–8.41) | 228 | 4.75 | (4.16–5.41) | 318 | 5.29 | (4.72–5.90) | 315 | 5.13 | (4.58–5.73) |
| West North Central | Iowa, Kansas, Minnesota, Missouri, Nebraska, North Dakota, South Dakota | 1,046 | 5.08 | (4.78–5.40) | 70 | 5.08 | (3.96–6.42) | 327 | 5.94 | (5.31–6.62) | 345 | 5.08 | (4.56–5.65) | 304 | 4.43 | (3.94–4.95) |
| West South Central | Arkansas, Louisiana, Oklahoma, Texas | 2,285 | 5.75 | (5.51–5.99) | 189 | 7.00 | (6.04–8.07) | 656 | 6.10 | (5.65–6.59) | 737 | 5.60 | (5.20–6.02) | 703 | 5.39 | (5.00–5.80) |
| Mountain | Arizona, Colorado, Idaho, Montana, New Mexico, Utah, Wyoming | 982 | 4.69 | (4.40–4.99) | 80 | 5.68 | (4.50–7.06) | 315 | 5.49 | (4.90–6.13) | 295 | 4.25 | (3.78–4.77) | 292 | 4.33 | (3.85–4.86) |
| Pacific | Alaska, California, Hawaii, Nevada, Oregon, Washington | 2,463 | 4.69 | (4.51–4.88) | 188 | 5.31 | (4.57–6.12) | 699 | 4.99 | (4.63–5.38) | 770 | 4.53 | (4.22–4.87) | 806 | 4.50 | (4.19–4.82) |
| TOTALb | 16,044 | 5.26 | (5.18–5.34) | 1,255 | 6.22 | (5.88–6.58) | 4,592 | 5.53 | (5.53–5.86) | 5,021 | 5.00 | (4.86–5.14) | 5,176 | 5.00 | (4.87–5.14) | |
Rates are per 100,000 and are age-adjusted to the 2000 US standard population.
Refers to all brain tumors including histologies not presented in this table.
– Counts and rates are not presented when fewer than 16 cases were reported for the specific histology category. The suppressed cases are included in the counts and rates for totals.
Abbreviations: CBTRUS, Central Brain Tumor Registry of the United States; CI, confidence interval.
Incidence by Age Groups
Overall incidence and incidence of specific histologies varied by age at diagnosis. Counts and incidence rates by histologic groups and age are presented in Table 5 and Figure 10.
Incidence of embryonal tumors, choroid plexus tumors, and germ cell tumors were highest in infants. Among the embryonal tumors, ATRT occurred notably more frequently in infants.
Incidence of choroid plexus tumors drops significantly from children <0 to children 0–4 years.
Gliomas were most common in children ages 1–4, though children ages 5–9 had the highest incidence of high grade gliomas.
Incidence of high grade glioma peaked in this age group.
Pilocytic astrocytomas were most common in children 1–4.
Medulloblastomas were most common in children ages 1–4 (0.63 per 100,000), though incidence was similar in children 5–9 (0.59 per 100,000).
Pituitary tumors increase in incidence with age and were most common in children ages 10–14.
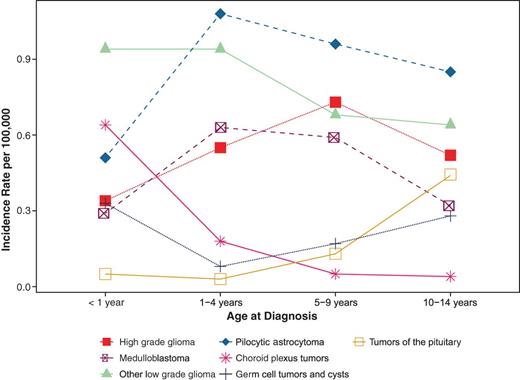
Age-Adjusted Incidence Rates of Brain and CNS Tumors by Selected Histologies and Age Groups (CBTRUS 2007–2011)
Number of Estimated New Cases for 2015 And 2016
The estimated number of cases of all primary brain and CNS tumors for 2015 and 2016 by histology and age are shown in Table 9.
For 2015, the total estimated new cases in children 0–14 years is 3,420.
For 2016, the total estimated new cases in children 0–14 years is 3,440.
Estimated Number of Casesa,b of Brain and Central Nervous System Tumors by Age, Major Histology Groupings, and Histology, 2015, 2016
| Histology | 2015 Estimated New Cases | 2016 Estimated New Cases | ||||||||
|---|---|---|---|---|---|---|---|---|---|---|
| 0–14 | <1 | 1–4 | 5–9 | 10–14 | 0–14 | <1 | 1–4 | 5–9 | 10–14 | |
| Gliomas | 1,810 | 100 | 590 | 610 | 510 | 1,820 | 110 | 590 | 620 | 520 |
| Pilocytic astrocytoma | 600 | – | 190 | 210 | 180 | 610 | – | 190 | 210 | 180 |
| Other low grade glioma | 490 | – | 170 | 150 | 130 | 490 | – | 170 | 150 | 140 |
| High grade glioma | 380 | – | 100 | 160 | 110 | 390 | – | 100 | 160 | 110 |
| Ependymal tumors | 190 | – | 90 | – | – | 190 | – | 90 | – | – |
| Other glioma | 150 | – | – | 50 | 50 | 150 | – | – | 50 | 50 |
| Choroid plexus tumors | 80 | – | – | – | – | 80 | – | – | – | – |
| Tumors of the pineal region | 150 | – | – | – | 70 | 150 | – | – | – | 70 |
| Neuronal and mixed neuronal-glial tumors | – | – | – | – | – | – | – | – | – | – |
| Embryonal tumors | 510 | 70 | 210 | 160 | 90 | 520 | 70 | 210 | 160 | 90 |
| Medulloblastoma | 320 | – | 110 | 130 | 70 | 320 | – | 110 | 130 | 70 |
| Primitive neuroectodermal tumor | 80 | – | – | – | – | 80 | – | – | – | – |
| Atypical teratoid/rhabdoid tumor | 80 | – | – | – | – | 80 | – | – | – | – |
| Other embryonal tumors | – | – | – | – | – | – | – | – | – | – |
| Tumors of cranial and spinal nerves | 160 | – | 50 | 50 | 50 | 160 | – | 50 | 50 | 50 |
| Tumors of meninges | 100 | – | – | – | – | 100 | – | – | – | – |
| Lymphomas and hematopoietic neoplasms | – | – | – | – | – | – | – | – | – | – |
| Germ cell tumors | 120 | – | – | – | 60 | 120 | – | – | 40 | 60 |
| Tumors of the pituitary | 130 | – | – | – | 90 | 130 | – | – | – | 90 |
| Craniopharyngioma | 140 | – | – | 60 | – | 140 | – | – | 60 | – |
| Other/unclassified tumors | 170 | – | – | 50 | 70 | 170 | – | – | 50 | 70 |
| TOTALc | 3,420 | 280 | 990 | 1,080 | 1,050 | 3,440 | 280 | 990 | 1,090 | 1,060 |
Source: Estimation based on CBTRUS (NPCR and SEER 2007–2011) data, and US Census population estimates.
Rounded to the nearest 10. Numbers may not add up due to rounding.
Refers to all brain tumors including histologies not presented in this table.
– Estimated number is less than 50 and may affect totals.
Abbreviations: CBTRUS, Central Brain Tumor Registry of the United States.
Mortality Rates by Region of the United States and Age Group
Mortality rates due to malignant brain and CNS tumor varied by age group, with the highest mortality occurring in children 5–9 years (0.90 per 100,000) at time of death (Figure 11), and the lowest mortality rates in infants (<1 year at time of death) (0.32 per 100,000).
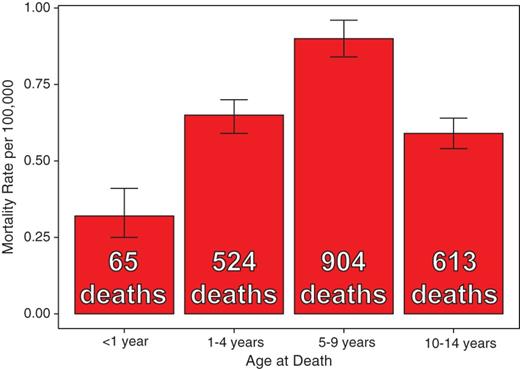
Average Annual Age-Adjusted Mortality Rates for Malignant Primary Brain and CNS Tumors by Age Groups (N = 2,106) (NVSS 2007–2011)
Average annual age-adjusted mortality rates by region of the United States are presented in Figure 12. The highest mortality was in the West North Central region (0.75 per 100,000, 95% CI: 0.63–0.87), and the lowest mortality rate was in New England (0.58 per 100,000, 95% CI: 0.46–0.73).
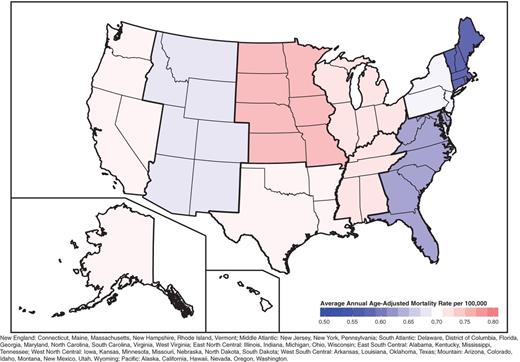
Average Annual Age-adjusted Mortality Rates for Malignant Primary Brain and CNS Tumors by Region of the United States (N = 2,106) (NVSS 2007–2011)
One-, Two-, Five-, and Ten-Year Relative Survival Ratesa for Malignant Brain and Central Nervous System Tumors by Siteb, CBTRUS Statistical Report: Alex's Lemonade Stand Foundation Infant and Childhood Primary Brain and Central Nervous System Tumors Diagnosed in the United States in 2007–2011c
| 1-Year | 2-Year | 5-Year | 10-Year | |||||||
|---|---|---|---|---|---|---|---|---|---|---|
| ICD-O-3 CODE | SITEb | N | % | 95% CI | % | 95% CI | % | 95% CI | % | 95% CI |
| C71.1 | Frontal lobe of the brain | 406 | 87.5 | (83.8–90.4) | 80.1 | (75.7–83.8) | 73.5 | (68.5–77.9) | 69.4 | (63.9–74.2) |
| C71.2 | Temporal lobe of the brain | 429 | 91.2 | (88.0–93.6) | 86.9 | (83.1–89.9) | 81.9 | (77.5–85.5) | 76.3 | (70.7–81.0) |
| C71.3 | Parietal lobe of the brain | 253 | 88.5 | (83.8–92.0) | 80.5 | (74.8–85.0) | 73.9 | (67.4–79.3) | 69.4 | (62.0–75.7) |
| C71.4 | Occipital lobe of the brain | 92 | 95.5 | (88.4–98.3) | 89.6 | (81.0–94.5) | 83.4 | (73.4–89.9) | 78.2 | (66.7–86.1) |
| C71.0 | Cerebrum | 623 | 83.2 | (79.9–85.9) | 73.2 | (69.4–76.7) | 68.5 | (64.4–72.2) | 65.7 | (61.3–69.8) |
| C71.5 | Ventricle | 508 | 85.3 | (81.8–88.1) | 78.7 | (74.7–82.2) | 71.5 | (67.0–75.6) | 67.5 | (62.4–72.0) |
| C71.6 | Cerebellum | 2,047 | 91.5 | (90.2–92.6) | 86.0 | (84.3–87.5) | 80.8 | (78.9–82.6) | 76.8 | (74.5–78.9) |
| C71.7 | Brain stem | 1,610 | 69.2 | (66.9–71.5) | 54.9 | (52.3–57.4) | 48.7 | (46.1–51.3) | 45.6 | (42.8–48.4) |
| C71.8-C71.9 | Other brain | 1,279 | 86.3 | (84.2–88.1) | 82.0 | (79.7–84.1) | 74.9 | (72.2–77.3) | 70.5 | (67.3–73.3) |
| C72.0-C72.1 | Spinal cord and cauda equina | 333 | 87.4 | (83.3–90.6) | 81.8 | (77.1–85.7) | 78.7 | (73.6–82.9) | 75.1 | (69.0–80.1) |
| C72.2-C72.5 | Cranial nerves | 529 | 99.9 | (97.0–100.0) | 99.7 | (98.0–99.9) | 98.6 | (96.7–99.4) | 97.8 | (95.2–99.0) |
| C72.8-C72.9 | Other nervous system | 59 | 84.3 | (71.9–91.6) | 80.6 | (67.5–88.8) | 67.3 | (52.4–78.5) | 63.6 | (47.6–76.0) |
| C70.0-C70.9 | Meninges (cerebral and spinal) | – | – | – | – | – | – | – | – | – |
| C75.1-C75.2 | Pituitary and craniopharyngeal duct | 41 | 100.0 | (100.0–100.0) | 97.2 | (81.2–99.6) | 93.7 | (76.5–98.4) | 93.7 | (76.5–98.4) |
| C75.3 | Pineal | 289 | 89.8 | (85.5–92.9) | 83.2 | (78.1–87.3) | 76.2 | (70.1–81.2) | 68.2 | (60.4–74.8) |
| C30.0d | Olfactory tumors of the nasal cavity | 41 | 92.5 | (78.3–97.5) | 81.3 | (64.5–90.6) | 75.0 | (57.2–86.3) | 75.0 | (57.2–86.3) |
| All Codes | All Sites | 8,564 | 85.5 | (84.7–86.2) | 78.2 | (77.3–79.1) | 72.6 | (71.5–73.6) | 68.7 | (67.6–69.6) |
The cohort analysis of survival rates was utilized for calculating the survival estimates presented in this table. Long-term cohort-based survival estimates reflect the survival experience of individuals diagnosed over the time period, and they may not necessarily reflect the long-term survival outlook of newly diagnosed cases.
The sites referred to in this table are loosely based on the categories and site codes defined in the SEER Site/Histology Validation List.
Estimated by CBTRUS using Surveillance, Epidemiology, and End Results (SEER) Program (www.seer.cancer.gov) SEER*Stat Database: Incidence–SEER 18 Regs Research Data + Hurricane Katrina Impacted Louisiana Cases, Nov 2013 Sub (1973–2011 varying) - Linked To County Attributes - Total U.S., 1969–2012 Counties, National Cancer Institute, DCCPS, Surveillance Research Program, Cancer Statistics Branch, released April 2014, based on the November 2013 submission.
ICD-O-3 histology codes 9522–9523 only.
– Rates are excluded when calculated based on a population of less than 50, or when less than 16 remain alive in the survival period.
Abbreviation: CBTRUS, Central Brain Tumor Registry of the United States; SEER, Survival, Epidemiology and End Results; CI, confidence interval.
One-, Five-, and Ten-Year Relative Survival Ratesa for Malignant Brain and Central Nervous System Tumors by Siteb and Year of Diagnosis, CBTRUS Statistical Report: Alex's Lemonade Stand Foundation Infant and Childhood Primary Brain and Central Nervous System Tumors Diagnosed in the United States in 2007–2011c
| 1-Year | 5-Year | 10-Year | |||||||
|---|---|---|---|---|---|---|---|---|---|
| ICD-O-3 CODE | SITEb | Years of Diagnosis | N | % | 95% CI | % | 95% CI | % | 95% CI |
| C71.0-C71.4 | Supratentorial | 1973–1976 | 71 | 77.4 | (65.7–85.5) | 56.0 | (43.6–66.7) | 53.1 | (40.8–64.0) |
| 1977–1981 | 136 | 77.3 | (69.3–83.4) | 59.6 | (50.8–67.3) | 53.7 | (44.9–61.7) | ||
| 1982–1986 | 159 | 83.0 | (76.1–88.0) | 63.9 | (55.9–70.9) | 59.6 | (51.4–66.8) | ||
| 1987–1991 | 212 | 85.0 | (79.4–89.1) | 70.3 | (63.6–76.0) | 68.5 | (61.7–74.4) | ||
| 1992–1996 | 298 | 87.0 | (82.6–90.3) | 74.5 | (69.2–79.1) | 71.3 | (65.7–76.1) | ||
| 1997–2001 | 431 | 85.6 | (431–85.6) | 72.1 | (67.6–76.1) | 68.0 | (63.3–72.3) | ||
| 2002–2006 | 614 | 87.8 | (84.9–90.1) | 74.1 | (70.3–77.4) | 69.8 | (64.1–74.8) | ||
| 2007–2011 | 640 | 87.8 | (84.9–90.3) | 74.4 | (68.8–79.3) | – | – | ||
| C71.5 | Ventricle, NOS | 1973–1976 | – | – | – | – | – | – | – |
| 1977–1981 | – | – | – | – | – | – | – | ||
| 1982–1986 | – | – | – | – | – | – | – | ||
| 1987–1991 | – | – | – | – | – | – | – | ||
| 1992–1996 | 68 | 79.6 | (67.9–87.4) | 62.0 | (49.3–72.4) | 60.6 | (47.9–71.1) | ||
| 1997–2001 | 133 | 83.5 | (76.0–88.9) | 71.5 | (63.0–78.4) | 64.4 | (55.5–72.0) | ||
| 2002–2006 | 158 | 87.4 | (81.1–91.7) | 71.4 | (63.6–77.8) | – | – | ||
| 2007–2011 | 192 | 84.8 | (78.5–89.4) | – | – | – | – | ||
| C71.6 | Cerebellum, NOS | 1973–1976 | 143 | 74.1 | (66.1–80.5) | 52.3 | (43.8–60.1) | 43.9 | (35.6–51.9) |
| 1977–1981 | 230 | 82.3 | (76.7–86.7) | 62.4 | (55.7–68.3) | 57.3 | (50.6–63.4) | ||
| 1982–1986 | 200 | 86.6 | (81.0–90.6) | 71.5 | (64.6–77.3) | 68.1 | (61.0–74.1) | ||
| 1987–1991 | 220 | 87.7 | (82.6–91.4) | 74.9 | (68.6–80.2) | 71.8 | (65.3–77.3) | ||
| 1992–1996 | 334 | 89.6 | (85.8–92.4) | 77.6 | (72.7–81.7) | 74.2 | (69.1–78.6) | ||
| 1997–2001 | 528 | 91.1 | (88.3–93.3) | 82.3 | (78.8–85.4) | 78.6 | (74.8–81.9) | ||
| 2002–2006 | 667 | 92.5 | (90.2–94.3) | 81.3 | (78.0–84.1) | – | – | ||
| 2007–2011 | 707 | 91.9 | (89.5–93.8) | 78.7 | (72.2–83.8) | – | – | ||
| C71.7 | Brain stem | 1973–1976 | – | – | – | – | – | – | |
| 1977–1981 | 76 | 51.4 | (76.0–51.4) | 25.1 | (16.0–35.2) | 23.8 | (14.9–33.8) | ||
| 1982–1986 | 125 | 57.5 | (48.3–65.6) | 35.7 | (27.3–44.1) | 32.5 | (24.4–40.8) | ||
| 1987–1991 | 154 | 62.4 | (54.2–69.5) | 33.6 | (26.2–41.1) | 33.6 | (26.2–41.1) | ||
| 1992–1996 | 236 | 58.4 | (51.8–64.4) | 42.7 | (36.3–48.9) | 37.6 | (31.4–43.8) | ||
| 1997–2001 | 371 | 68.9 | (64.0–73.4) | 47.7 | (42.6–52.7) | 45.6 | (40.4–50.6) | ||
| 2002–2006 | 558 | 69.9 | (65.9–73.6) | 51.6 | (47.3–55.7) | 45.7 | (39.5–51.7) | ||
| 2007–2011 | 603 | 69.7 | (65.6–73.3) | 46.6 | (40.6–52.4) | – | – | ||
| C71.8-C71.9 | Other Brain | 1973–1976 | 125 | 69.7 | (60.8–77.0) | 54.6 | (45.4–62.8) | 51.5 | (42.4–59.9) |
| 1977–1981 | 125 | 77.5 | (69.1–83.9) | 59.7 | (50.4–67.7) | 54.9 | (45.6–63.2) | ||
| 1982–1986 | 101 | 78.4 | (69.0–85.3) | 59.4 | (49.1–68.3) | 57.3 | (47.0–66.4) | ||
| 1987–1991 | 125 | 80.1 | (71.9–86.1) | 61.0 | (51.8–68.9) | 57.0 | (47.8–65.2) | ||
| 1992–1996 | 227 | 86.4 | (81.2–90.3) | 70.5 | (64.1–76.0) | 66.5 | (59.9–72.3) | ||
| 1997–2001 | 300 | 83.7 | (79.0–87.5) | 72.3 | (66.8–77.0) | 68.0 | (62.3–73.1) | ||
| 2002–2006 | 454 | 85.9 | (82.3–88.8) | 74.1 | (69.7–77.9) | – | – | ||
| 2007–2011 | 438 | 87.6 | (83.9–90.5) | 76.7 | (69.3–82.6) | – | – | ||
| C70.0-C70.9, C72.0-C72.9 C75.1-C75.3 C30.0d | Other Nervous System | 1973–1976 | 58 | 70.9 | (57.3–80.9) | 58.9 | (45.1–70.3) | 52.1 | (38.5–64.1) |
| 1977–1981 | 86 | 78.1 | (67.7–85.5) | 61.9 | (50.7–71.3) | 58.5 | (47.3–68.2) | ||
| 1982–1986 | 89 | 84.3 | (74.8–90.4) | 63.9 | (52.9–73.0) | 60.6 | (49.6–70.0) | ||
| 1987–1991 | 112 | 89.3 | (81.9–93.8) | 78.6 | (69.7–85.2) | 74.2 | (64.8–81.4) | ||
| 1992–1996 | 152 | 92.2 | (86.6–95.5) | 82.4 | (75.3–87.6) | 77.2 | (69.6–83.2) | ||
| 1997–2001 | 277 | 91.7 | (87.8–94.5) | 81.6 | (76.5–85.7) | 79.9 | (74.5–84.2) | ||
| 2002–2006 | 452 | 92.7 | (89.9–94.8) | 87.1 | (83.6–89.9) | – | – | ||
| 2007–2011 | 478 | 93.0 | (90.0–95.0) | – | – | – | – | ||
| All Codes | All Sites | 1973–1976 | 467 | 70.5 | (66.1–74.4) | 51.2 | (46.5–55.6) | 45.9 | (41.3–50.4) |
| 1977–1981 | 690 | 76.0 | (72.6–79.0) | 56.3 | (52.5–59.9) | 51.7 | (47.9–55.4) | ||
| 1982–1986 | 706 | 78.8 | (75.6–81.6) | 59.8 | (56.1–63.3) | 56.3 | (52.5–59.9) | ||
| 1987–1991 | 878 | 81.1 | (78.4–83.6) | 64.2 | (60.9–67.3) | 61.6 | (58.2–64.7) | ||
| 1992–1996 | 1,321 | 82.7 | (80.6–84.7) | 69.2 | (66.7–71.7) | 65.4 | (62.7–67.9) | ||
| 1997–2001 | 2,048 | 84.5 | (82.8–86.0) | 71.7 | (69.6–73.6) | 68.1 | (66.0–70.1) | ||
| 2002–2006 | 2,915 | 85.9 | (84.6–87.1) | 73.3 | (71.6–74.8) | 69.2 | (67.0–71.3) | ||
| 2007–2011 | 3,076 | 85.7 | (84.4–87.0) | 71.9 | (69.3–74.3) | – | – | ||
The cohort analysis of survival rates was utilized for calculating the survival estimates presented in this table. Long-term cohort-based survival estimates reflect the survival experience of individuals diagnosed over the time period, and they may not necessarily reflect the long-term survival outlook of newly diagnosed cases.
The sites referred to in this table are loosely based on the categories and site codes defined in the SEER Site/Histology Validation List.
Estimated by CBTRUS using Surveillance, Epidemiology, and End Results (SEER) Program (www.seer.cancer.gov) SEER*Stat Database: Incidence – SEER 18 Regs Research Data + Hurricane Katrina Impacted Louisiana Cases, Nov 2013 Sub (1973–2011 varying) – Linked To County Attributes – Total U.S., 1969–2012 Counties, National Cancer Institute, DCCPS, Surveillance Research Program, Cancer Statistics Branch, released April 2014, based on the November 2013 submission.
ICD-O-3 histology codes 9522–9523 only.
– Rates are excluded when calculated based on a population of less than 50, when less than 16 remain alive in the survival period, or when not enough follow up time has passed to calculate survival for the listed period.
Abbreviation: CBTRUS, Central Brain Tumor Registry of the United States; SEER, Survival, Epidemiology and End Results; CI, confidence interval.
One-, Two-, Three-, Four-, Five-, and Ten-Year Relative Survival Ratesa,b for Selected Malignant Brain and Central Nervous System Tumors by Histology, CBTRUS Statistical Report: Alex's Lemonade Stand Foundation Infant and Childhood Primary Brain and Central Nervous System Tumors Diagnosed in the United States in 2007–2011c
| 1-Yr | 2-Yr | 3-Yr | 4-Yr | 5-Yr | 10-Yr | ||||||||
|---|---|---|---|---|---|---|---|---|---|---|---|---|---|
| Histology | N | % | 95% CI | % | 95% CI | % | 95% CI | % | 95% CI | % | 95% CI | % | 95% CI |
| Gliomas | 5,814 | 87.2 | (86.3–88.1) | 80.6 | (79.5–81.6) | 78.1 | (77.0–79.2) | 76.8 | (75.6–77.9) | 76.0 | (74.8–77.2) | 73.3 | (72.0–74.6) |
| Pilocytic astrocytoma | 2,131 | 98.8 | (98.2–99.2) | 98.5 | (97.9–99.0) | 98.1 | (97.3–98.6) | 97.4 | (96.5–98.1) | 97.1 | (96.1–97.8) | 95.9 | (94.6–96.9) |
| Other low grade glioma | 936 | 95.4 | (93.8–96.6) | 91.7 | (89.7–93.4) | 89.6 | (87.4–91.5) | 88.3 | (85.9–90.4) | 87.3 | (84.7–89.4) | 84.6 | (81.6–87.1) |
| High grade glioma | 1,347 | 55.6 | (52.9–58.3) | 35.0 | (32.3–37.6) | 30.0 | (27.4–32.6) | 28.9 | (26.3–31.5) | 28.4 | (25.9–31.0) | 25.7 | (23.1–28.4) |
| Ependymal tumors | 655 | 93.3 | (91.0–95.0) | 86.3 | (83.2–88.9) | 80.4 | (76.9–83.5) | 75.8 | (71.9–79.2) | 72.7 | (68.6–76.4) | 63.8 | (58.9–68.3) |
| Other glioma | 745 | 96.9 | (95.3–98.0) | 94.4 | (92.3–95.9) | 93.1 | (90.9–94.9) | 92.6 | (90.2–94.4) | 92.4 | (89.9–94.2) | 91.2 | (88.3–93.4) |
| Choroid plexus tumors | 78 | 81.3 | (70.3–88.5) | 76.7 | (65.0–84.9) | 68.2 | (55.5–77.9) | 64.5 | (51.5–74.9) | 60.5 | (47.2–71.5) | 58.0 | (44.2–69.4) |
| Tumors of the pineal region | 41 | 97.5 | (82.7–99.7) | 91.7 | (76.1–97.3) | 88.5 | (71.8–95.6) | 88.5 | (71.8–95.6) | 88.5 | (71.8–95.6) | 88.5 | (71.8–95.6) |
| Neuronal and mixed neuronal-glial tumors | 83 | 84.8 | (74.7–91.1) | 74.8 | (63.2–83.2) | 66.7 | (54.4–76.5) | 59.3 | (46.4–70.2) | 54.9 | (41.5–66.4) | 43.4 | (29.0–57.0) |
| Embryonal tumors | 1,908 | 80.0 | (78.1–81.8) | 70.3 | (68.1–72.4) | 66.6 | (64.3–68.8) | 64.3 | (62.0–66.5) | 62.1 | (59.7–64.4) | 55.9 | (53.3–58.5) |
| Medulloblastoma | 1,124 | 86.8 | (84.7–88.7) | 79.4 | (76.8–81.7) | 75.2 | (72.5–77.8) | 72.8 | (69.8–75.4) | 70.1 | (67.0–72.9) | 63.0 | (59.5–66.4) |
| Primitive neuroectodermal tumor | 442 | 76.9 | (72.7–80.6) | 64.1 | (59.3–68.4) | 60.2 | (55.4–64.8) | 58.1 | (53.2–62.7) | 56.0 | (51.1–60.7) | 49.2 | (43.9–54.4) |
| Atypical teratoid/rhabdoid tumor | 197 | 48.1 | (40.8–55.0) | 32.5 | (25.7–39.5) | 29.5 | (22.8–36.5) | 28.6 | (21.9–35.7) | 27.5 | (20.8–34.7) | 26.0 | (19.1–33.4) |
| Other embryonal tumors | 145 | 80.2 | (72.6–86.0) | 70.2 | (61.7–77.1) | 68.5 | (59.9–75.7) | 65.7 | (56.8–73.2) | 64.7 | (55.7–72.3) | 63.4 | (54.3–71.3) |
| Tumors of cranial and spinal nerves | – | – | – | – | – | – | – | – | – | – | – | – | – |
| Tumors of meninges | 92 | 76.5 | (66.2–84.1) | 64.2 | (53.0–73.4) | 58.9 | (47.6–68.6) | 57.6 | (46.1–67.4) | 56.0 | (44.5–66.0) | 48.3 | (36.2–59.4) |
| Lymphomas and hematopoietic neoplasms | 55 | 87.3 | (75.2–93.7) | 85.4 | (72.8–92.4) | 83.2 | (70.0–90.9) | 80.7 | (66.8–89.2) | 80.7 | (66.8–89.2) | 76.2 | (59.3–86.9) |
| Germ cell tumors | 383 | 93.3 | (90.2–95.4) | 91.2 | (87.7–93.7) | 89.9 | (86.2–92.7) | 88.1 | (84.2–91.2) | 86.6 | (82.3–89.9) | 80.1 | (74.1–84.8) |
| Other/unclassified tumors | 97 | 59.9 | (49.3–69.0) | 52.9 | (42.2–62.5) | 50.3 | (39.6–60.1) | 50.3 | (39.6–60.1) | 50.3 | (39.6–60.1) | 43.4 | (31.6–54.6) |
| TOTAL: All Brain and Other Nervous Systemd | 8,564 | 85.5 | (84.7–86.2) | 78.2 | (77.3–79.1) | 75.4 | (74.4–76.4) | 73.8 | (72.8–74.8) | 72.6 | (71.5–73.6) | 68.7 | (67.6–69.9) |
The cohort analysis of survival rates was utilized for calculating the survival estimates presented in this table. Long-term cohort-based survival estimates reflect the survival experience of individuals diagnosed over the time period, and they may not necessarily reflect the long-term survival outlook of newly diagnosed cases.
Rates are an estimate of the percentage of patients alive at one, two, three, four, five, and ten year, respectively.
Estimated by CBTRUS using Surveillance, Epidemiology, and End Results (SEER) Program (www.seer.cancer.gov) SEER*Stat Database: Incidence - SEER 18 Regs Research Data + Hurricane Katrina Impacted Louisiana Cases, Nov 2013 Sub (1973–2011 varying) - Linked To County Attributes - Total U.S., 1969–2012 Counties, National Cancer Institute, DCCPS, Surveillance Research Program, Cancer Statistics Branch, released April 2014, based on the November 2013 submission
Includes histologies not listed in this table.
–Rates are excluded when calculated based on a population of less than 50, or when less than 16 remain alive in the survival period.
Abbreviation: CBTRUS, Central Brain Tumor Registry of the United States; SEER, Survival, Epidemiology and End Results; CI, confidence interval; NOS, not otherwise specified.
One-, Five-, and Ten-Year Relative Survival Ratesa,b for Selected Malignant Brain and Central Nervous System Tumors by Histology and Year of Diagnosis, CBTRUS Statistical Report: Alex's Lemonade Stand Foundation Infant and Childhood Primary Brain and Central Nervous System Tumors Diagnosed in the United States in 2007–2011c
| 1-Yr | 5-Yr | 10-Yr | ||||||
|---|---|---|---|---|---|---|---|---|
| Histology | Years of Diagnosis | N | % | 95% CI | % | 95% CI | % | 95% CI |
| Gliomas | 1973–1976 | 310 | 74.2 | (68.9–78.7) | 56.1 | (50.3–61.4) | 52.0 | (46.2–57.4) |
| 1977–1981 | 476 | 77.0 | (72.9–80.5) | 59.7 | (55.2–64.0) | 55.4 | (50.8–59.8) | |
| 1982–1986 | 486 | 80.9 | (77.0–84.1) | 63.6 | (59.1–67.7) | 60.5 | (56.0–64.8) | |
| 1987–1991 | 636 | 82.9 | (79.7–85.6) | 66.9 | (63.1–70.5) | 65.0 | (61.1–68.6) | |
| 1992–1996 | 894 | 85.2 | (82.7–87.3) | 74.3 | (71.3–77.1) | 71.2 | (68.1–74.1) | |
| 1997–2001 | 1,334 | 86.3 | (84.4–88.1) | 75.8 | (73.3–78.0) | 73.2 | (70.6–75.5) | |
| 2002–2006 | 2,029 | 87.8 | (86.2–89.1) | 76.5 | (74.6–78.3) | 74.1 | (71.7–76.3) | |
| 2007–2011 | 2,096 | 87.2 | (85.6–88.6) | 74.5 | (71.5–77.2) | – | – | |
| Pilocytic astrocytoma | 1973–1976 | – | – | – | – | – | – | – |
| 1977–1981 | – | – | – | – | – | – | – | |
| 1982–1986 | 56 | 94.7 | (84.1–98.3) | 92.9 | (81.9–97.3) | 91.2 | (79.7–96.3) | |
| 1987–1991 | 109 | 95.5 | (89.3–98.1) | 88.2 | (80.5–93.1) | 88.2 | (80.5–93.1) | |
| 1992–1996 | 270 | 98.9 | (96.6–99.7) | 96.0 | (92.8–97.8) | 94.3 | (90.6–96.6) | |
| 1997–2001 | 500 | 98.8 | (97.4–99.5) | 97.5 | (95.6–98.6) | 96.1 | (93.9–97.6) | |
| 2002–2006 | 741 | 98.7 | (97.5–99.3) | 97.2 | (95.7–98.2) | – | – | |
| 2007–2011 | 771 | 98.9 | (97.7–99.4) | – | – | – | – | |
| Other low grade glioma | 1973–1976 | 117 | 85.5 | (77.6–90.7) | 77.0 | (68.2–83.7) | 72.8 | (63.7–80.1) |
| 1977–1981 | 243 | 86.5 | (81.5–90.2) | 76.7 | (70.8–81.6) | 71.1 | (64.8–76.4) | |
| 1982–1986 | 209 | 89.0 | (83.9–92.6) | 78.0 | (72.1–83.4) | 74.6 | (68.0–80.0) | |
| 1987–1991 | 233 | 93.2 | (89.0–95.8) | 85.4 | (80.1–89.4) | 82.5 | (76.9–86.9) | |
| 1992–1996 | 236 | 95.4 | (91.8–97.4) | 88.6 | (83.7–92.1) | 85.7 | (80.4–89.7) | |
| 1997–2001 | 242 | 93.8 | (89.8–96.2) | 89.2 | (84.4–92.5) | 86.2 | (80.9–90.0) | |
| 2002–2006 | 326 | 95.7 | (92.8–97.5) | 85.2 | (80.8–88.7) | – | – | |
| 2007–2011 | 283 | 96.5 | (93.4–98.2) | – | – | – | – | |
| High grade glioma | 1973–1976 | 67 | 50.8 | (38.3–62.0) | 26.9 | (17.0–37.9) | – | – |
| 1977–1981 | 89 | 46.1 | (35.5–56.0) | 20.3 | (12.7–29.2) | 19.2 | (11.8–28.0) | |
| 1982–1986 | 128 | 59.3 | (50.2–67.2) | 33.2 | (25.1–41.4) | 30.8 | (23.0–39.0) | |
| 1987–1991 | 169 | 55.7 | (47.8–62.8) | 33.0 | (26.0–40.2) | 32.5 | (25.5–39.6) | |
| 1992–1996 | 207 | 51.6 | (44.6–58.2) | 32.1 | (25.8–38.6) | 29.7 | (23.5–36.0) | |
| 1997–2001 | 321 | 54.2 | (48.5–59.4) | 27.9 | (23.1–32.9) | 24.7 | (20.1–29.6) | |
| 2002–2006 | 450 | 54.3 | (49.5–58.8) | 28.1 | (24.0–32.4) | – | – | |
| 2007–2011 | 502 | 57.1 | (52.4–61.4) | 25.3 | (19.7–31.2) | – | – | |
| Ependymal tumors | 1973–1976 | – | – | – | – | – | – | – |
| 1977–1981 | 51 | 74.7 | (60.3–84.5) | 29.5 | (17.7–42.3) | 27.6 | (16.2–40.2) | |
| 1982–1986 | 56 | 80.5 | (67.4–88.8) | 46.2 | (32.7–58.6) | 42.5 | (29.3–55.0) | |
| 1987–1991 | 80 | 88.9 | (79.6–94.1) | 50.1 | (38.7–60.5) | 46.4 | (35.2–56.9) | |
| 1992–1996 | 107 | 87.0 | (79.0–92.1) | 63.7 | (53.8–72.0) | 54.4 | (44.5–63.3) | |
| 1997–2001 | 134 | 94.8 | (89.3–97.5) | 71.1 | (62.4–78.1) | 64.0 | (55.1–71.7) | |
| 2002–2006 | 241 | 94.2 | (90.4–96.6) | 72.4 | (66.2–77.6) | 58.3 | (45.9–68.8) | |
| 2007–2011 | 231 | 92.5 | (87.8–95.4) | 75.4 | (60.4–85.3) | – | – | |
| Other glioma | 1973–1976 | 76 | 79.0 | (68.0–86.6) | 60.7 | (48.8–70.7) | 56.8 | (44.9–67.1) |
| 1977–1981 | 52 | 74.9 | (60.6–84.7) | 51.4 | (36.9–64.1) | 47.5 | (33.3–60.5) | |
| 1982–1986 | – | – | – | – | – | – | – | |
| 1987–1991 | – | – | – | – | – | – | – | |
| 1992–1996 | 74 | 93.3 | (84.5–97.2) | 82.6 | (71.8–89.6) | 81.3 | (70.3–88.5) | |
| 1997–2001 | 137 | 95.0 | (89.6–97.6) | 89.9 | (83.5–93.9) | 89.2 | (82.6–93.4) | |
| 2002–2006 | 271 | 98.2 | (95.6–99.3) | 93.7 | (90.0–96.1) | – | – | |
| 2007–2011 | 309 | 97.1 | (94.2–98.5) | – | – | – | – | |
| Embryonal tumors | 1973–1976 | 121 | 67.1 | (57.9–74.7) | 41.5 | (32.6–50.1) | 31.5 | (23.4–39.9) |
| 1977–1981 | 158 | 75.4 | (67.9–81.4) | 47.6 | (39.6–55.2) | 42.0 | (34.2–49.6) | |
| 1982–1986 | 155 | 79.5 | (72.2–85.0) | 55.0 | (46.8–62.4) | 49.9 | (41.8–57.5) | |
| 1987–1991 | 175 | 77.2 | (70.2–82.7) | 55.9 | (48.2–62.9) | 51.4 | (43.6–58.5) | |
| 1992–1996 | 296 | 75.8 | (70.4–80.3) | 55.5 | (49.7–61.0) | 50.8 | (44.9–56.3) | |
| 1997–2001 | 508 | 80.9 | (77.2–84.1) | 63.4 | (59.1–67.5) | 57.7 | (53.2–61.9) | |
| 2002–2006 | 606 | 79.5 | (76.1–82.5) | 61.5 | (57.5–65.3) | 53.7 | (48.0–59.1) | |
| 2007–2011 | 677 | 80.3 | (76.9–83.2) | 60.9 | (54.4–66.7) | – | – | |
| Medulloblastoma | 1973–1976 | 100 | 67.0 | (56.9–75.3) | 40.1 | (30.5–49.5) | 28.1 | (19.7–37.2) |
| 1977–1981 | 138 | 77.6 | (69.7–83.7) | 47.2 | (38.7–55.3) | 40.8 | (32.5–48.9) | |
| 1982–1986 | 120 | 82.0 | (73.6–87.6) | 57.6 | (48.3–65.9) | 51.9 | (42.6–60.4) | |
| 1987–1991 | 109 | 82.6 | (74.0–88.5) | 63.2 | (53.3–71.5) | 56.8 | (46.9–65.5) | |
| 1992–1996 | 158 | 78.6 | (71.3–84.2) | 62.1 | (54.1–69.2) | 57.0 | (48.9–64.4) | |
| 1997–2001 | 273 | 86.8 | (82.2–90.3) | 72.1 | (66.3–77.0) | 65.7 | (59.7–71.1) | |
| 2002–2006 | 353 | 86.7 | (82.6–89.8) | 61.5 | (57.5–65.3) | – | – | |
| 2007–2011 | 419 | 88.9 | (85.3–91.7) | 60.9 | (54.4–66.7) | – | – | |
| Primitive neuroectodermal tumor | 1973–1976 | – | – | – | – | – | – | – |
| 1977–1981 | – | – | – | – | – | – | – | |
| 1982–1986 | – | – | – | – | – | – | – | |
| 1987–1991 | – | – | – | – | – | – | – | |
| 1992–1996 | 123 | 72.4 | (63.6–79.5) | 45.6 | (36.6–54.2) | 41.5 | (32.7–50.1) | |
| 1997–2001 | 162 | 75.8 | (68.4–81.7) | 55.2 | (47.1–62.5) | 47.9 | (39.9–55.5) | |
| 2002–2006 | 146 | 79.4 | (71.9–85.2) | 59.1 | (50.6–66.7) | 49.3 | (36.1–61.3) | |
| 2007–2011 | 103 | 74.8 | (64.8–82.3) | – | – | – | – | |
| Atypical teratoid/rhabdoid tumord | 2002–2006 | 69 | 39.8 | (28.2–51.2) | 19.9 | (11.3–30.2) | – | – |
| 2007–2011 | 111 | 52.8 | (42.7–61.9) | – | – | – | – | |
| TOTAL: All Brain and Other Nervous Systemde | 1973–1976 | 467 | 70.5 | (66.1–74.4) | 51.2 | (46.5–55.6) | 45.9 | (41.3–50.4) |
| 1977–1981 | 690 | 76.0 | (72.6–79.0) | 56.3 | (52.5–59.9) | 51.7 | (47.9–55.4) | |
| 1982–1986 | 706 | 78.8 | (75.6–81.6) | 59.8 | (56.1–63.3) | 56.3 | (52.5–59.9) | |
| 1987–1991 | 878 | 81.1 | (78.4–83.6) | 64.2 | (60.9–67.3) | 61.6 | (58.2–64.7) | |
| 1992–1996 | 1,321 | 82.7 | (80.6–84.7) | 69.2 | (66.7–71.7) | 65.4 | (62.7–67.9) | |
| 1997–2001 | 2,048 | 84.5 | (82.8–86.0) | 71.7 | (69.6–73.6) | 68.1 | (66.0–70.1) | |
| 2002–2006 | 2,915 | 85.9 | (84.6–87.1) | 73.3 | (71.6–74.8) | 69.2 | (67.0–71.3) | |
| 2007–2011 | 3,076 | 85.7 | (84.4–87.0) | 71.9 | (69.3–74.3) | – | – | |
The cohort analysis of survival rates was utilized for calculating the survival estimates presented in this table. Long-term cohort-based survival estimates reflect the survival experience of individuals diagnosed over the time period, and they may not necessarily reflect the long-term survival outlook of newly diagnosed cases.
Rates are an estimate of the percentage of patients alive at one, two, three, four, five, and ten year, respectively.
Estimated by CBTRUS using Surveillance, Epidemiology, and End Results (SEER) Program (www.seer.cancer.gov) SEER*Stat Database: Incidence - SEER 18 Regs Research Data + Hurricane Katrina Impacted Louisiana Cases, Nov 2013 Sub (1973–2011 varying) - Linked To County Attributes - Total U.S., 1969–2012 Counties, National Cancer Institute, DCCPS, Surveillance Research Program, Cancer Statistics Branch, released April 2014, based on the November 2013 submission
Atypical teratoid/rhabdoid tumors were first included in the WHO classification of tumors of the central nervous system in the 2000 revision.
Includes histologies not listed in this table.
– Rates are excluded when calculated based on a population of less than 50, when less than 16 remain alive in the survival period, or when not enough follow up time has passed to calculate survival for the listed period.
Abbreviation: CBTRUS, Central Brain Tumor Registry of the United States; SEER, Survival, Epidemiology and End Results; CI, confidence interval; NOS, not otherwise specified.
Relative Survival by Site
Relative survival after diagnosis with a brain and CNS tumor varies by site. One-year, two-year, five-year, and ten-year survival rates by site are presented in Table 10.
Brain stem tumors had lower relative survival than tumors diagnosed at any other location, with one- and ten-year survival of 69.2% and 45.6%, respectively.
Tumors of the cranial nerve had the highest survival rates, with 99.9% one-year and 97.8% ten-year survival.
For most sites, relative survival after diagnosis has improved over time, and these data are presented in Table 11.
For tumors that occur supratentorially (in the cerebrum, frontal lobe, occipital lobe, parietal lobe, and temporal lobe), 1-year survival for tumors diagnosed from 1977–1981 was 77.3%, whereas 1-year survival was 87.8% from 2007–2011. 10-year survival for these tumors was 53.7% from 1977–1981, and 69.8% from 2002–2006.
For tumors that occur in the brain stem, 1-year survival was 51.4% for tumors diagnosed from 1977–1981, as compared to 69.7% for tumors diagnosed from 2007–2011. 10-year survival for these tumors was 23.8% from 1977–1981, and 45.7% from 2002–2006.
Relative Survival by Histologic Group
Relative survival after diagnosis with primary brain and CNS tumor varies by histologic type of tumor, and is presented in Table 12.
ATRT and high grade glioma were the histologic groups with the lowest relative survival after diagnosis. ATRT had one-, five-, and ten-year survival of 48.1%, 27.5%, and 26.0%, respectively. High grade glioma had one-, five-, and ten-year survival of 55.6%, 28.4%, and 25.7%, respectively.
Pilocytic astrocytoma and other low grade glioma had some of the highest survival rates after diagnosis. Ten-year survival with these tumors was 95.9% and 84.6%, respectively.
For most histologies, relative survival after diagnosis has improved over time, and these data are presented in Table 13.
For all malignant brain tumors, 1-year survival was 70.5% from 1973–1976, as compared to 85.7% from 2007–2011. 10-year survival was 45.9% in 1973–1976, as compared to 69.2% in 2002–2006.
Survival after diagnosis with high grade glioma remained relatively stable, with 1-year survival rates of 59.3% from 1982–1986, and 57.1% from 2007–2011. 10-year survival was 30.8% from 1982–1986, and 24.7% from 1997–2001.
Relative Survival by Age Group and Histologic Group
Relative survival rates generally improved with increasing age at diagnosis. One-year, two-year, five-year, and ten-year relative survival rates by histologic group and age groups are presented in Table 14.
Overall, survival was better in older children. Though there was not much difference in relative survival between children ages 1–4 and 5–9 years, differences could be seen in histologies that depend on treatment with radiation such as medulloblastoma and PNET.
Though infants generally had poor survival, the long-term survival of infants with high grade gliomas was higher than children of other ages, with a ten-year survival of 54.1%.
Five-year survival in children 10–14 years was 79.2% for all brain tumors, as compared to infants where five-year survival was 55.3%.
For embryonal tumors, infants (<1 year old) had one-year survival of 52.8%, whereas those 10–14 years had relative survival of 92.2%.
Distribution of Deaths due to Selected Histologic Groups and Site
Between 2007 and 2011, there were 734 total deaths in children ages 0–14 due to primary malignant brain tumors between 1995 and 2011 in the 18 SEER registries. The distribution of these deaths by histology grouping is presented in Figure 13a, and the distribution of these by site is presented in Figure 13b.
High grade gliomas were the cause of the greatest proportion of deaths (43.8%), followed by medulloblastoma (14.3%) and ATRT (9.8%).
Table 14.One-, Two-, Five-, and Ten-Year Relative Survival Ratesa,b for Selected Malignant Brain and Central Nervous System Tumors by Age Groups, CBTRUS Statistical Report: Alex's Lemonade Stand Foundation Infant and Childhood Primary Brain and Central Nervous System Tumors Diagnosed in the United States in 2007–2011c
1-Yr 2-Yr 5-Yr 10-Yr Histology Age Group (years) N % 95% CI % 95% CI % 95% CI % 95% CI Gliomas <1 314 81.7 (76.8–85.7) 78.5 (73.3–82.8) 71.0 (65.1–76.1) 68.2 (61.4–74.0) 1–4 1,833 90.9 (89.5–92.2) 84.5 (82.7–86.2) 80.0 (77.9–81.9) 77.0 (74.6–79.2) 5–9 1,974 81.5 (79.7–83.2) 73.9 (71.8–75.8) 70.4 (68.2–72.5) 68.0 (65.6–70.3) 10–14 1,693 91.0 (89.5–92.3) 84.5 (82.6–86.2) 79.2 (77.0–81.2) 76.5 (74.1–78.8) Pilocytic astrocytoma <1 74 93.4 (83.7–97.4) 91.8 (81.7–96.5) 80.1 (66.7–88.5) 80.1 (66.7–88.5) 1–4 685 99.1 (98.0–99.6) 98.5 (97.1–99.2) 97.5 (95.8–98.5) 95.9 (93.1–97.6) 5–9 717 98.8 (97.7–99.4) 98.8 (97.7–99.4) 98.0 (96.5–98.9) 97.2 (94.9–98.4) 10–14 655 98.9 (97.7–99.5) 98.9 (97.7–99.5) 97.4 (95.5–98.5) 96.3 (93.7–97.8) Other low grade glioma <1 59 90.5 (79.0–95.8) 90.5 (79.0–95.8) 77.1 (62.1–86.7) 70.7 (50.8–83.7) 1–4 254 94.7 (91.0–96.9) 92.4 (88.2–95.2) 88.9 (83.8–92.4) 88.9 (83.8–92.4) 5–9 260 94.8 (91.3–97.0) 91.4 (87.1–94.3) 88.8 (83.9–92.3) 85.8 (79.9–90.1) 10–14 363 97.2 (94.8–98.5) 91.6 (88.1–94.2) 86.7 (82.3–90.0) 82.7 (77.4–86.9) High grade glioma <1 69 57.4 (44.7–68.3) 54.1 (41.4–65.3) 54.1 (41.4–65.3) 54.1 (41.4–65.3) 1–4 308 61.1 (55.4–66.4) 34.7 (29.3–40.3) 27.3 (22.1–32.7) 24.4 (19.1–30.1) 5–9 591 45.6 (41.5–49.6) 25.9 (22.3–29.7) 20.8 (17.4–24.4) 18.4 (15.0–22.1) 10–14 379 66.5 (61.4–71.1) 45.9 (40.5–51.0) 36.9 (31.7–42.1) 33.3 (27.9–38.7) Ependymal tumors <1 51 77.6 (62.8–87.1) 70.6 (55.0–81.6) 60.1 (43.8–73.0) 51.4 (33.4–66.9) 1–4 309 92.8 (89.2–95.3) 85.8 (81.0–89.4) 71.4 (65.1–76.7) 59.4 (51.6–66.4) 5–9 167 95.6 (91.0–97.9) 86.7 (80.1–91.2) 73.9 (65.5–80.5) 67.0 (57.1–75.1) 10–14 128 97.6 (92.6–99.2) 93.1 (86.7–96.5) 79.2 (70.0–85.9) 73.6 (63.2–81.5) Embryonal tumors <1 219 52.8 (45.8–59.3) 41.7 (34.8–48.4) 36.5 (29.7–43.4) 34.0 (27.2–41.0) 1–4 768 74.3 (71.0–77.3) 63.4 (59.7–66.8) 55.8 (51.9–59.5) 51.9 (47.7–55.9) 5–9 602 90.9 (88.3–93.0) 81.7 (78.2–84.6) 73.1 (69.0–76.7) 63.1 (58.1–67.7) 10–14 319 92.2 (88.5–94.7) 85.4 (80.7–88.9) 73.9 (68.0–78.9) 67.4 (60.6–73.2) Medulloblastoma <1 65 55.9 (42.8–67.2) 48.6 (35.5–60.5) 41.6 (28.5–54.2) 38.2 (24.7–51.5) 1–4 388 81.0 (76.6–84.6) 71.4 (66.4–75.7) 62.3 (56.8–67.3) 58.0 (52.0–63.6) 5–9 445 91.9 (88.8–94.1) 84.6 (80.7–87.7) 75.7 (71.0–79.7) 65.3 (59.4–70.5) 10–14 226 95.8 (92.1–97.8) 91.8 (87.0–94.8) 80.7 (73.8–85.9) 74.6 (66.6–81.0) Primitive neuroectodermal tumor <1 – – – – – – – – – 1–4 205 75.6 (69.0–81.0) 62.5 (55.3–68.9) 54.4 (47.1–61.2) 49.4 (41.6–56.7) 5–9 123 89.1 (82.0–93.5) 76.0 (67.1–82.8) 67.4 (57.8–75.2) 57.3 (45.9–67.2) 10–14 71 81.6 (70.4–88.9) 66.9 (54.5–76.6) 55.4 (42.6–66.5) 46.6 (33.3–58.9) Atypical teratoid/rhabdoid tumor <1 67 40.2 (28.3–51.9) 19.7 (10.8–30.5) – – – – 1–4 111 48.6 (38.9–57.7) 36.7 (27.4–46.1) 33.5 (24.1–43.2) 33.5 (24.1–43.2) 5–9 – – – – – – – – – 10–14 – – – – – – – – – Germ cell tumors <1 – – – – – – – – – 1–4 – – – – – – – – – 5–9 95 97.8 (91.3–99.4) 96.5 (89.3–98.9) 90.5 (79.3–95.8) 87.7 (74.7–94.3) 10–14 248 97.1 (94.0–98.6) 94.4 (90.6–96.8) 89.5 (84.4–92.9) 80.8 (72.9–86.6) TOTAL: All Brain and Other Nervous Systemd <1 636 67.7 (63.8–71.3) 61.0 (57.3–65.2) 55.3 (51.1–59.3) 53.2 (48.7–57.4) 1–4 2,758 85.4 (84.0–86.7) 78.0 (75.9–79.1) 71.9 (70.0–73.6) 68.6 (66.5–70.6) 5–9 2,775 84.5 (83.0–85.8) 77.0 (75.0–78.2) 71.5 (69.6–73.3) 67.0 (64.9–69.0) 10–14 2,395 91.5 (90.3–92.6) 85.0 (83.8–86.8) 79.2 (77.4–80.9) 75.1 (72.9–77.1) 1-Yr 2-Yr 5-Yr 10-Yr Histology Age Group (years) N % 95% CI % 95% CI % 95% CI % 95% CI Gliomas <1 314 81.7 (76.8–85.7) 78.5 (73.3–82.8) 71.0 (65.1–76.1) 68.2 (61.4–74.0) 1–4 1,833 90.9 (89.5–92.2) 84.5 (82.7–86.2) 80.0 (77.9–81.9) 77.0 (74.6–79.2) 5–9 1,974 81.5 (79.7–83.2) 73.9 (71.8–75.8) 70.4 (68.2–72.5) 68.0 (65.6–70.3) 10–14 1,693 91.0 (89.5–92.3) 84.5 (82.6–86.2) 79.2 (77.0–81.2) 76.5 (74.1–78.8) Pilocytic astrocytoma <1 74 93.4 (83.7–97.4) 91.8 (81.7–96.5) 80.1 (66.7–88.5) 80.1 (66.7–88.5) 1–4 685 99.1 (98.0–99.6) 98.5 (97.1–99.2) 97.5 (95.8–98.5) 95.9 (93.1–97.6) 5–9 717 98.8 (97.7–99.4) 98.8 (97.7–99.4) 98.0 (96.5–98.9) 97.2 (94.9–98.4) 10–14 655 98.9 (97.7–99.5) 98.9 (97.7–99.5) 97.4 (95.5–98.5) 96.3 (93.7–97.8) Other low grade glioma <1 59 90.5 (79.0–95.8) 90.5 (79.0–95.8) 77.1 (62.1–86.7) 70.7 (50.8–83.7) 1–4 254 94.7 (91.0–96.9) 92.4 (88.2–95.2) 88.9 (83.8–92.4) 88.9 (83.8–92.4) 5–9 260 94.8 (91.3–97.0) 91.4 (87.1–94.3) 88.8 (83.9–92.3) 85.8 (79.9–90.1) 10–14 363 97.2 (94.8–98.5) 91.6 (88.1–94.2) 86.7 (82.3–90.0) 82.7 (77.4–86.9) High grade glioma <1 69 57.4 (44.7–68.3) 54.1 (41.4–65.3) 54.1 (41.4–65.3) 54.1 (41.4–65.3) 1–4 308 61.1 (55.4–66.4) 34.7 (29.3–40.3) 27.3 (22.1–32.7) 24.4 (19.1–30.1) 5–9 591 45.6 (41.5–49.6) 25.9 (22.3–29.7) 20.8 (17.4–24.4) 18.4 (15.0–22.1) 10–14 379 66.5 (61.4–71.1) 45.9 (40.5–51.0) 36.9 (31.7–42.1) 33.3 (27.9–38.7) Ependymal tumors <1 51 77.6 (62.8–87.1) 70.6 (55.0–81.6) 60.1 (43.8–73.0) 51.4 (33.4–66.9) 1–4 309 92.8 (89.2–95.3) 85.8 (81.0–89.4) 71.4 (65.1–76.7) 59.4 (51.6–66.4) 5–9 167 95.6 (91.0–97.9) 86.7 (80.1–91.2) 73.9 (65.5–80.5) 67.0 (57.1–75.1) 10–14 128 97.6 (92.6–99.2) 93.1 (86.7–96.5) 79.2 (70.0–85.9) 73.6 (63.2–81.5) Embryonal tumors <1 219 52.8 (45.8–59.3) 41.7 (34.8–48.4) 36.5 (29.7–43.4) 34.0 (27.2–41.0) 1–4 768 74.3 (71.0–77.3) 63.4 (59.7–66.8) 55.8 (51.9–59.5) 51.9 (47.7–55.9) 5–9 602 90.9 (88.3–93.0) 81.7 (78.2–84.6) 73.1 (69.0–76.7) 63.1 (58.1–67.7) 10–14 319 92.2 (88.5–94.7) 85.4 (80.7–88.9) 73.9 (68.0–78.9) 67.4 (60.6–73.2) Medulloblastoma <1 65 55.9 (42.8–67.2) 48.6 (35.5–60.5) 41.6 (28.5–54.2) 38.2 (24.7–51.5) 1–4 388 81.0 (76.6–84.6) 71.4 (66.4–75.7) 62.3 (56.8–67.3) 58.0 (52.0–63.6) 5–9 445 91.9 (88.8–94.1) 84.6 (80.7–87.7) 75.7 (71.0–79.7) 65.3 (59.4–70.5) 10–14 226 95.8 (92.1–97.8) 91.8 (87.0–94.8) 80.7 (73.8–85.9) 74.6 (66.6–81.0) Primitive neuroectodermal tumor <1 – – – – – – – – – 1–4 205 75.6 (69.0–81.0) 62.5 (55.3–68.9) 54.4 (47.1–61.2) 49.4 (41.6–56.7) 5–9 123 89.1 (82.0–93.5) 76.0 (67.1–82.8) 67.4 (57.8–75.2) 57.3 (45.9–67.2) 10–14 71 81.6 (70.4–88.9) 66.9 (54.5–76.6) 55.4 (42.6–66.5) 46.6 (33.3–58.9) Atypical teratoid/rhabdoid tumor <1 67 40.2 (28.3–51.9) 19.7 (10.8–30.5) – – – – 1–4 111 48.6 (38.9–57.7) 36.7 (27.4–46.1) 33.5 (24.1–43.2) 33.5 (24.1–43.2) 5–9 – – – – – – – – – 10–14 – – – – – – – – – Germ cell tumors <1 – – – – – – – – – 1–4 – – – – – – – – – 5–9 95 97.8 (91.3–99.4) 96.5 (89.3–98.9) 90.5 (79.3–95.8) 87.7 (74.7–94.3) 10–14 248 97.1 (94.0–98.6) 94.4 (90.6–96.8) 89.5 (84.4–92.9) 80.8 (72.9–86.6) TOTAL: All Brain and Other Nervous Systemd <1 636 67.7 (63.8–71.3) 61.0 (57.3–65.2) 55.3 (51.1–59.3) 53.2 (48.7–57.4) 1–4 2,758 85.4 (84.0–86.7) 78.0 (75.9–79.1) 71.9 (70.0–73.6) 68.6 (66.5–70.6) 5–9 2,775 84.5 (83.0–85.8) 77.0 (75.0–78.2) 71.5 (69.6–73.3) 67.0 (64.9–69.0) 10–14 2,395 91.5 (90.3–92.6) 85.0 (83.8–86.8) 79.2 (77.4–80.9) 75.1 (72.9–77.1) aThe cohort analysis of survival rates was utilized for calculating the survival estimates presented in this table. Long-term cohort-based survival estimates reflect the survival experience of individuals diagnosed over the time period, and they may not necessarily reflect the long-term survival outlook of newly diagnosed cases.
bRates are an estimate of the percentage of patients alive at one, two, five, and ten year, respectively. Rates were not presented for categories with 50 or less cases and were suppressed for rates where less than 16 cases were surviving within a category.
cEstimated by CBTRUS using Surveillance, Epidemiology, and End Results (SEER) Program (www.seer.cancer.gov) SEER*Stat Database: Incidence - SEER 18 Regs Research Data + Hurricane Katrina Impacted Louisiana Cases, Nov 2013 Sub (1973–2011 varying) - Linked To County Attributes - Total U.S., 1969–2012 Counties, National Cancer Institute, DCCPS, Surveillance Research Program, Cancer Statistics Branch, released April 2014, based on the November 2013 submission.
dIncludes histologies not listed in this table.
– Rates are excluded when calculated based on a population of less than 50, or when less than 16 remain alive in the survival period.
Abbreviation: CBTRUS, Central Brain Tumor Registry of the United States; SEER, Survival, Epidemiology and End Results; CI, confidence interval; NOS, not otherwise specified.
Brain stem tumors were the cause of the greatest proportion of deaths (37.9%), followed by cerebellar tumors (16.6%).
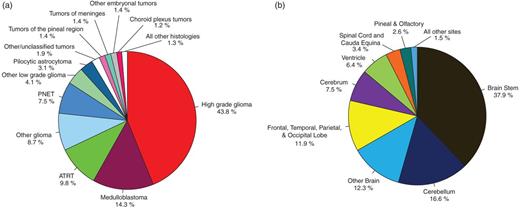
Distribution of Total Deaths Due to Primary Malignant Brain and CNS Tumor in Children 0–14 at Time of Death from 2007–2011 by (a) Histology Groupings (N = 734), and (b) Site (N = 734) (SEER 1995–2011)
Five-Year Conditional Survival after Diagnosis by Selected Histologic Groups
Relative survival provides data on cancer prognosis that is useful at a population level, but these numbers may not be informative for individual patients. In the case of individuals that have already survived a year, or several years after diagnosis with their brain tumor, conditional survival estimates provide information about the likelihood that they will survive into the next period of time. Five-year conditional survival estimates for selected glioma and embryonal sub-types are presented in Figure 14. Five-year conditional survival estimates by age groups for selected brain and CNS tumor subtypes are also presented in Table 15.
At the time of diagnosis with a high grade glioma, there is a 28.1% probability that a child will live five additional years. For children that have already survived two years after diagnosis, there is an 80.0% chance that they will reach five years of survival.
At the time of diagnosis with an ATRT, there is a 27.4% probability that a child will live five additional years. For children that have already survived one year after diagnosis, there is a 54.3% chance that they will reach five years of survival.
Five-Year Conditional Survival Ratesa,b for Selected Malignant Brain and Central Nervous System Tumors by Age Groupsc
| Years of current survival after diagnosis | |||||||||||
|---|---|---|---|---|---|---|---|---|---|---|---|
| At Diagnosis | 1 years | 2 years | 3 years | 4 years | |||||||
| Histology | Age Group (years) | % | 95% CI | % | 95% CI | % | 95% CI | % | 95% CI | % | 95% CI |
| Gliomas | <1 | 71.2 | (65.3–76.3) | 86.6 | (80.9–90.7) | 90.4 | (85.0–94.0) | 93.3 | (88.2–96.3) | 98.6 | (94.4–99.6) |
| 1–4 | 80.0 | (78.0–81.9) | 87.2 | (85.3–88.9) | 94.4 | (92.9–95.6) | 97.9 | (96.8–98.7) | 99.0 | (98.2–99.5) | |
| 5–9 | 70.2 | (68.0–72.3) | 84.2 | (82.2–86.0) | 94.9 | (93.4–96.1) | 97.2 | (96.0–98.1) | 98.9 | (97.9–99.4) | |
| 10–14 | 79.1 | (76.9–81.1) | 86.0 | (84.0–87.8) | 93.3 | (91.7–94.7) | 96.7 | (95.3–97.6) | 98.7 | (97.7–99.3) | |
| 0–14 | 76.0 | (74.7–77.1) | 85.9 | (84.8–86.9) | 94.0 | (93.2–94.8) | 97.1 | (96.4–97.6) | 98.9 | (98.4–99.2) | |
| Pilocytic astrocytoma | <1 | 80.2 | (66.8–88.6) | 85.7 | (72.0–93.0) | 87.1 | (73.4–94.0) | 88.7 | (74.9–95.2) | 97.4 | (82.9–99.6) |
| 1–4 | 97.5 | (95.8–98.5) | 98.4 | (96.8–99.2) | 99.0 | (97.6–99.6) | 99.4 | (98.0–99.8) | 100.0 | # | |
| 5–9 | 98.0 | (96.4–98.9) | 99.2 | (97.7–99.7) | 99.2 | (97.7–99.7) | 99.3 | (97.9–99.8) | 99.3 | (97.9–99.8) | |
| 10–14 | 97.4 | (95.5–98.5) | 98.4 | (96.7–99.3) | 98.4 | (96.7–99.2) | 99.2 | (97.6–99.7) | 99.8 | (98.0–100.0) | |
| 0–14 | 97.1 | (96.1–97.8) | 98.3 | (97.4–98.8) | 98.5 | (97.7–99.0) | 99.0 | (98.3–99.4) | 99.6 | (99.1–99.9) | |
| Other low grade glioma | <1 | 76.7 | (61.6–86.5) | 84.9 | (68.9–93.0) | 84.8 | (68.9–92.9) | 93.5 | (76.2–98.3) | 96.4 | (77.2–99.5) |
| 1–4 | 88.8 | (83.8–92.4) | 93.0 | (88.3–95.8) | 96.1 | (91.8–98.1) | 98.1 | (94.1–99.4) | 98.7 | (94.7–99.7) | |
| 5–9 | 88.9 | (84.1–92.4) | 93.0 | (88.5–95.7) | 97.2 | (93.3–98.8) | 97.7 | (93.8–99.1) | 99.4 | (95.5–99.9) | |
| 10–14 | 86.7 | (82.3–90.0) | 88.4 | (84.2–91.6) | 94.6 | (90.9–96.8) | 97.1 | (93.8–98.6) | 98.7 | (95.8–99.6) | |
| 0–14 | 87.3 | (84.8–89.4) | 90.8 | (88.4–92.7) | 95.2 | (93.2–96.6) | 97.3 | (95.7–98.4) | 98.8 | (97.4–99.4) | |
| High grade glioma | <1 | 54.5 | (41.8–65.6) | 91.9 | (76.7–97.3) | 100.0 | # | 100.0 | # | 100.0 | # |
| 1–4 | 27.1 | (22.0–32.6) | 42.3 | (34.7–49.6) | 78.8 | (68.4–86.1) | 96.8 | (87.5–99.2) | 98.2 | (88.2–99.8) | |
| 5–9 | 20.3 | (16.9–23.9) | 39.7 | (33.7–45.7) | 78.3 | (69.7–84.7) | 92.4 | (84.6–96.3) | 98.7 | (91.0–99.8) | |
| 10–14 | 36.5 | (31.3–41.7) | 52.7 | (45.9–59.0) | 78.3 | (70.5–84.3) | 92.0 | (85.0–95.8) | 97.1 | (91.0–99.1) | |
| 0–14 | 28.1 | (25.6–30.7) | 47.1 | (43.3–50.8) | 80.0 | (75.5–83.7) | 93.8 | (90.3–96.1) | 98.1 | (95.4–99.2) | |
| Ependymal tumors | <1 | 59.9 | (43.5–72.9) | 77.1 | (57.6–88.4) | 84.8 | (64.4–94.0) | 84.8 | (64.4–94.0) | 100.0 | # |
| 1–4 | 71.3 | (65.0–76.7) | 76.1 | (69.7–81.3) | 81.5 | (75.1–86.4) | 91.6 | (85.9–95.0) | 95.7 | (90.7–98.1) | |
| 5–9 | 73.7 | (65.3–80.4) | 76.5 | (68.0–83.0) | 85.1 | (76.7–90.6) | 88.1 | (79.9–93.1) | 94.3 | (86.7–97.6) | |
| 10–14 | 79.2 | (69.9–85.9) | 80.5 | (71.3–87.1) | 85.1 | (75.9–90.9) | 88.6 | (79.6–93.7) | 94.8 | (86.5–98.0) | |
| 0–14 | 72.7 | (68.6–76.3) | 77.3 | (73.2–80.9) | 83.5 | (79.5–86.8) | 89.5 | (85.9–92.2) | 95.4 | (92.4–97.2) | |
| Embryonal tumors | <1 | 36.6 | (29.8–43.4) | 68.3 | (57.8–76.7) | 86.5 | (75.6–92.8) | 90.3 | (79.5–95.5) | 98.1 | (87.1–99.7) |
| 1–4 | 55.8 | (51.9–59.4) | 72.4 | (68.2–76.2) | 87.8 | (84.0–90.8) | 93.7 | (90.3–95.9) | 96.2 | (93.2–97.9) | |
| 5–9 | 73.2 | (69.2–76.8) | 80.2 | (76.2–83.6) | 89.0 | (85.4–91.7) | 94.9 | (91.9–96.8) | 97.4 | (94.9–98.7) | |
| 10–14 | 73.8 | (67.8–78.8) | 79.5 | (73.5–84.3) | 86.1 | (80.2–90.3) | 89.3 | (83.7–93.1) | 93.2 | (88.0–96.2) | |
| 0–14 | 62.1 | (59.7–64.4) | 76.2 | (73.8–78.5) | 87.8 | (85.6–89.7) | 93.0 | (91.1–94.5) | 96.2 | (94.6–97.3) | |
| Medulloblastoma | <1 | 42.0 | (29.0–54.6) | 73.1 | (52.7–85.8) | 86.1 | (62.6–95.3) | 90.1 | (65.9–97.4) | – | – |
| 1–4 | 62.1 | (56.5–67.1) | 74.0 | (68.2–78.9) | 86.8 | (81.2–90.8) | 93.1 | (88.0–96.0) | 96.1 | (91.6–98.3) | |
| 5–9 | 75.8 | (71.2–79.9) | 82.3 | (77.7–86.0) | 88.8 | (84.5–91.9) | 94.9 | (91.3–97.0) | 97.4 | (94.4–98.8) | |
| 10–14 | 80.6 | (73.6–85.9) | 84.1 | (77.2–89.1) | 87.3 | (80.5–91.9) | 90.0 | (83.3–94.1) | 92.6 | (86.2–96.1) | |
| 0–14 | 70.1 | (67.1–72.9) | 79.6 | (76.6–82.3) | 87.8 | (85.0–90.1) | 93.0 | (90.6–94.9) | 96.0 | (93.9–97.4) | |
| Primitive neuroectodermal tumor | <1 | 33.2 | (19.5–47.6) | – | – | – | – | – | – | – | – |
| 1–4 | 54.3 | (46.9–61.1) | 69.7 | (61.4–76.5) | 87.1 | (79.1–92.2) | 93.7 | (86.4–97.1) | 95.6 | (88.6–98.3) | |
| 5–9 | 67.2 | (57.6–75.1) | 75.5 | (65.6–82.9) | 88.5 | (79.0–93.9) | 94.2 | (85.2–97.8) | 96.9 | (88.1–99.2) | |
| 10–14 | 55.5 | (42.7–66.5) | 65.7 | (51.5–76.7) | 83.0 | (67.5–91.6) | 87.0 | (71.5–94.4) | 96.9 | (80.0–99.6) | |
| 0–14 | 56.0 | (51.0–60.7) | 71.4 | (66.0–76.1) | 87.5 | (82.5–91.1) | 93.0 | (88.7–95.8) | 96.5 | (92.7–98.3) | |
| Atypical teratoid/rhabdoid tumor | <1 | 12.2 | (5.0–22.7) | 30.1 | (12.2–50.3) | – | – | – | – | – | – |
| 1–4 | 33.9 | (24.3–43.7) | 66.2 | (49.3–78.6) | 90.9 | (66.9–97.8) | 94.1 | (64.9–99.2) | 94.1 | (65.0–99.2) | |
| 5–9 | – | – | – | – | – | – | – | – | – | – | |
| 10–14 | – | – | – | – | – | – | – | – | – | – | |
| 0–14 | 27.4 | (20.6–34.6) | 54.3 | (42.0–65.1) | 82.5 | (66.1–91.4) | 90.5 | (72.8–96.9) | 95.9 | (74.3–99.4) | |
| Germ cell tumors | <1 | – | – | – | – | – | – | – | – | – | – |
| 1–4 | – | – | – | – | – | – | – | – | – | – | |
| 5–9 | 90.4 | (79.1–95.8) | 92.4 | (80.4–97.1) | 93.7 | (81.3–97.9) | 93.6 | (81.3–97.9) | 97.4 | (83.1–99.6) | |
| 10–14 | 89.6 | (84.6–93.0) | 92.3 | (87.5–95.2) | 94.8 | (90.4–97.2) | 96.7 | (92.6–98.5) | 98.2 | (94.4–99.5) | |
| 0–14 | 86.8 | (82.6–90.1) | 92.9 | (89.1–95.4) | 95.0 | (91.4–97.1) | 96.3 | (92.9–98.1) | 98.2 | (95.2–99.3) | |
| TOTAL: All Brain and Other Nervous Systemd | <1 | 55.5 | (51.2–59.5) | 81.1 | (76.5–84.9) | 89.5 | (85.2–92.6) | 93.1 | (89.2–95.6) | 98.2 | (95.2–99.3) |
| 1–4 | 71.9 | (70.1–73.7) | 82.9 | (81.1–84.5) | 92.4 | (91.0–93.6) | 96.8 | (95.7–97.6) | 98.4 | (97.5–98.9) | |
| 5–9 | 71.5 | (69.6–73.2) | 83.1 | (81.4–84.7) | 92.9 | (91.5–94.1) | 96.2 | (95.1–97.1) | 98.3 | (97.4–98.9) | |
| 10–14 | 79.2 | (77.4–80.9) | 85.9 | (84.2–87.4) | 92.6 | (91.1–93.8) | 95.8 | (94.5–96.7) | 97.9 | (97.0–98.6) | |
| 0–14 | 72.6 | (71.6–73.6) | 83.7 | (82.8–84.7) | 92.4 | (91.7–93.1) | 96.1 | (95.5–96.6) | 98.2 | (97.7–98.6) | |
The cohort analysis of survival rates was utilized for calculating the survival estimates presented in this table. Long-term cohort-based survival estimates reflect the survival experience of individuals diagnosed over the time period, and they may not necessarily reflect the long-term survival outlook of newly diagnosed cases.
Rates are an estimate of the percentage of patients alive at one, two, five, and ten year, respectively. Rates were not presented for categories with 50 or less cases and were suppressed for rates where less than 16 cases were surviving within a category.
Estimated by CBTRUS using Surveillance, Epidemiology, and End Results (SEER) Program (www.seer.cancer.gov) SEER*Stat Database: Incidence - SEER 18 Regs Research Data + Hurricane Katrina Impacted Louisiana Cases, Nov 2013 Sub (1973–2011 varying) - Linked To County Attributes - Total U.S., 1969–2012 Counties, National Cancer Institute, DCCPS, Surveillance Research Program, Cancer Statistics Branch, released April 2014, based on the November 2013 submission.
Includes histologies not listed in this table.
– Rates are excluded when calculated based on a population of less than 50, or when less than 16 remain alive in the survival period.
# Statistic could not be calcualted
Abbreviation: CBTRUS, Central Brain Tumor Registry of the United States; SEER, Survival, Epidemiology and End Results; CI, confidence interval; NOS, not otherwise specified.
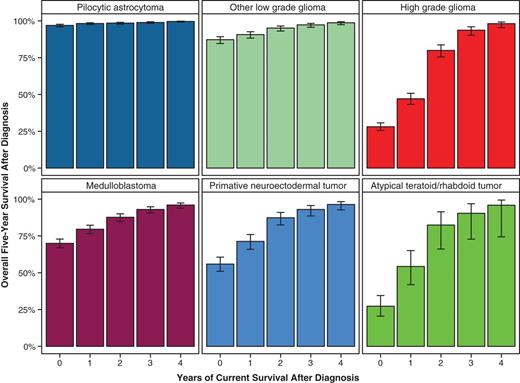
Five-Year Conditional Survival by Age Groups and Selected Glioma and Embryonal Histology Groupings (SEER 1995–2011)
Descriptive Summary of Gliomas, and Embryonal Tumors
The data in the CBTRUS Statistical Report: Alex's Lemonade Stand Foundation Infant and Childhood Primary Brain and Central Nervous System Tumors Diagnosed in the United States in 2007–2011 are synthesized to describe the two most common histology groups in infants and children: gliomas and embryonal tumors.
Gliomas
Gliomas are the most common histology group of primary brain and CNS tumor in children 0–14 years (Table 3).
Gliomas account for 52.9% of all primary brain and CNS tumors in children 0–14 years (Figure 9).
Pilocytic astrocytoma represent 33.2% of gliomas, followed by other low grade gliomas (27.1%), high grade gliomas (21.0%), and ependymal tumors (10.4%) (Figure 9).
Incidence of gliomas is highest in New England (3.19 per 100,000), and Middle Atlantic (3.06 per 100,000) (Figure 15).
Site of tumor varies by age and specific glioma histology. For infants, other low grade gliomas occur most frequently supratentorially (cerebrum, frontal, occipital, temporal, parietal and occipital lobes) and in other nervous system (including the optic nerve). In children 1–4 years, high grade gliomas occur more often in the brain stem (Figure 16).
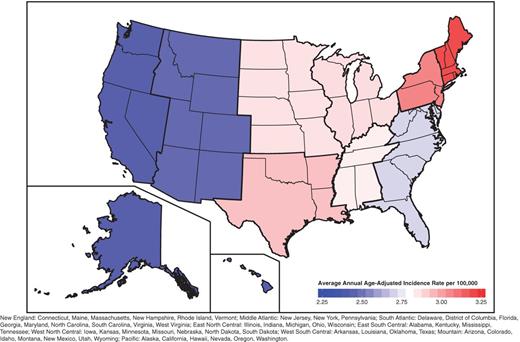
Average Annual Age-Adjusted Incidence Rates of All Gliomas by Region of the United States (0–14 Years) (N = 8,487) (CBTRUS 2007–2011)
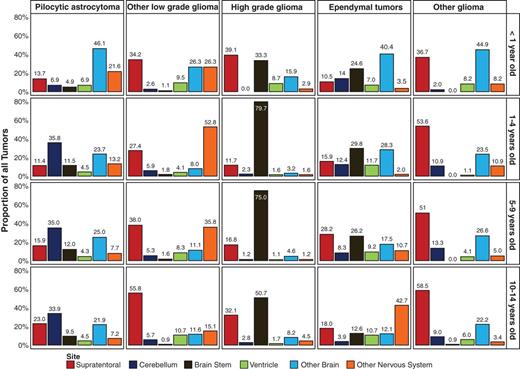
Number and Distribution of Sites by Specific Glioma Histology Groupings and Age Groups (N = 8,487) (CBTRUS 2007–2011)
Embryonal Tumors
Embryonal tumors are the 2nd most common type of primary brain and CNS tumor in children 0–14 years (Table 3).
Embryonal tumors account for 15.0% of all primary brain and CNS tumors in children 0–14 years (Figure 9).
Medulloblastomas represent 61.9% of all embryonal tumors, followed by atypical teratoid/rhabdoid tumors (ATRT) (15.0%), primitive neuroectodermal tumors (PNET) (14.9%) (Figure 9).
Incidence of embryonal tumors is highest in New England (0.85 per 100,000), South Atlantic (0.84 per 100,000), and East North Central (0.81 pre 100,000) (Figure 17).
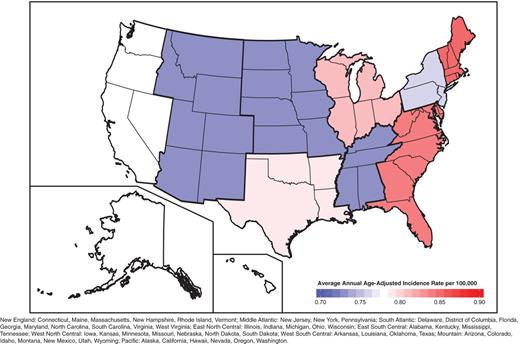
Average Annual Age-Adjusted Incidence Rates of All Embryonal Tumors by Region of the United States (0–14 Years) (N = 2,413) (CBTRUS 2007–2011)
Strengths and Limitations
CBTRUS is the largest population-based registry of primary brain and CNS tumors in the US and covers 99.8% of the U.S. population (for 2011 only, data was available for 50 out of 51 registries). The CBTRUS Statistical Report: Alex's Lemonade Stand Foundation Infant and Childhood Primary Brain and Central Nervous System Tumors Diagnosed in the United States in 2007–2011 contains the most up-to-date population-based data on primary childhood brain tumor and CNS tumors available through the surveillance system in the United States.
The histologic grouping scheme used in this report represents a re-organization from that used in the CBTRUS Statistical Report: Primary Brain and Central Nervous System Tumors Diagnosed in the United States in 2007–20112 in order to better reflect the histologies that are particularly relevant to infant and childhood brain tumors. Comparison of the statistics presented in this report to those included in the overall CBTRUS Report has been affected and may be difficult. Furthermore, the grouping scheme and definition of primary brain tumors used in this report differs from those used by other cancer surveillance organizations. This report includes both malignant and non-malignant tumors, and hematopoietic tumors of the CNS. Other reporting agencies may chose not to include hematopoietic neoplasms, and non-malignant brain and CNS tumors. Additionally many other organizations use the ICCC grouping scheme to report on childhood brain tumor incidence and mortality. In light of these differences, caution should be used if attempting to compare the statistics included in this report to those presented by other organizations. All analyses were undertaken with the overall intention to present meaningful and relevant statistical information to the communities working with infant and childhood brain and CNS tumors.
Registration of individual cases is conducted by cancer registrars at the institution where diagnosis occurs and is then transmitted to the central registry, which further transmits this information to NPCR or SEER. Central cancer registries (both NPCR and SEER) only report cases to the CDC and NCI for persons that are residents of that particular state, so duplicate records should not occur for persons that may have traveled across state lines for treatment. No mechanism exists for central pathology review of cases, and registration is based on histology information contained in the patient's medical record.
The SEER 18 population dataset used for the survival analyses is a subset of the larger CBTRUS dataset and only covers approximately 26% of the US population as compared to the 99.8% population coverage of the larger dataset.4 Survival estimates obtained from this dataset may be less reliable as representations of ‘real’ relative survival rates for the US than if they were based on data from a larger portion of the population.
Concluding Comment
The CBTRUS Statistical Report: Alex's Lemonade Stand Foundation Infant and Childhood Primary Brain and Central Nervous System Tumors Diagnosed in the United States in 2007–2011 comprehensively describes the current population-based incidence of primary malignant and non-malignant brain and CNS tumors in children ages 0–14 years, collected and reported by central cancer registries covering approximately 99.8% of the United States population (for 2011 only, data were available for 50 out of 51 registries). Overall, brain and CNS tumors are the most common solid tumor, the most common cancer, and the most common cause of cancer death in infants and children 0–14 years. This report aims to serve as a useful resource for researchers, clinicians, patients, and families.
Abbreviations
- AIAN
– American Indian/Alaskan Native
- API
– Asian/Pacific Islander
- AYA
– Adolescents and Young Adults
- ATRT
– Atypical Teratoid/Rhabdoid Tumor
- CBTRUS
– Central Brain Tumor Registry of the United States
- CDC
– Centers for Disease Control and Prevention
- CSS
– Cancer Surveillance System
- CI
– Confidence interval
- CNS
– Central nervous system
- ICD–O–3
– International Classification of Diseases for Oncology, Third Edition
- ICCC
– International Classification of Childhood Cancer
- NAACCR
– North American Association of Central Cancer Registries
- NCDB
– National Cancer Data Base
- NCHS
– National Center for Health Statistics
- NCI
– National Cancer Institute
- NOS
– Not otherwise specified
- NPCR
– National Program of Cancer Registries
- PNET
– Primitive Neuroectodermal Tumor
- SEER
– Surveillance, Epidemiology and End Results
- USCS
– United States Cancer Statistics
- WHO
– World Health Organization
Acknowledgments
This report was prepared by the Central Brain Tumor Registry of the United States (CBTRUS) executive team and the research staff affiliated with the Case Comprehensive Cancer Center, Case Western Reserve University School of Medicine and funded by a grant from Alex's Lemonade Stand Foundation.
References
Average Annual Populationsa for 2007–2011, By Age, Gender and Race
| Age Group | White | Black | AIAN | API | Total |
|---|---|---|---|---|---|
| Male | |||||
| <1 year | 1,554,737 | 348,286 | 38,661 | 119,032 | 2,060,715 |
| 1–4 years | 6,256,217 | 1,358,815 | 150,358 | 470,874 | 8,236,265 |
| 5–9 years | 7,849,153 | 1,655,085 | 180,670 | 562,182 | 10,247,090 |
| 10–14 years | 8,107,511 | 1,744,870 | 183,262 | 547,649 | 10,583,292 |
| Total | 23,767,618 | 5,107,057 | 552,951 | 1,699,737 | 31,127,362 |
| Female | |||||
| <1 year | 1,484,983 | 336,915 | 37,926 | 112,585 | 1,972,409 |
| 1–4 years | 5,970,115 | 1,313,813 | 145,785 | 455,644 | 7,885,358 |
| 5–9 years | 7,478,677 | 1,601,608 | 175,695 | 559,237 | 9,815,218 |
| 10–14 years | 7,701,865 | 1,684,402 | 179,050 | 534,779 | 10,100,096 |
| Total | 22,635,640 | 4,936,739 | 538,457 | 1,662,246 | 29,773,081 |
Population data source for 51 population-based geographic regions: Estimates from the United States. Bureau of the Census http://seer.cancer.gov/popdata/index.html.
Abbreviations: AIAN, American Indian Alaskan Native; API, Asian Pacific Islander.
Average Annual Populationsa for 2007–2011, by Age, Gender, and Hispanic Ethnicity
| Age Group | Non-Hispanic | Hispanic | Total |
|---|---|---|---|
| Male | |||
| <1 year | 1,531,632 | 529,084 | 2,060,715 |
| 1–4 years | 6,190,889 | 2,045,376 | 8,236,265 |
| 5–9 years | 7,902,989 | 2,344,101 | 10,247,090 |
| 10–14 years | 8,331,023 | 2,252,269 | 10,583,292 |
| Total | 23,956,533 | 7,170,829 | 31,127,362 |
| Female | |||
| <1 year | 1,462,286 | 510,124 | 1,972,409 |
| 1–4 years | 5,923,047 | 1,962,311 | 7,885,358 |
| 5–9 years | 7,565,538 | 2,249,680 | 9,815,218 |
| 10–14 years | 7,942,964 | 2,157,132 | 10,100,096 |
| Total | 22,893,835 | 6,879,246 | 29,773,081 |
Population data source for 51 population-based geographic regions: Estimates from the U.S. Census Bureau http://seer.cancer.gov/popdata/index.html.


