


Abstract
Objectives. The aim of the study was to examine the validity of a translated and culturally adapted version of the Arthritis Impact Measurement Scales 2, Short Form (AIMS2-SF) in patients suffering from osteoarthritis (OA) in primary care.
Methods. A structured procedure was used for the translation and cultural adaptation of the AIMS2-SF into German. The questionnaire was administered to 220 primary care patients with OA of the knee or hip. Test–retest reliability was tested in 35 randomly selected patients, who received the questionnaire a second time after 1 week. The physical scale of the original AIMS2-SF was divided into an ‘upper body limitations’ scale and a ‘lower body limitations’ scale.
Results. With values ranging from 0.52 to 0.97 for Pearson's r, item-scale correlations were reasonably good. The discriminative power of separate scales was also good, reflected in low values for correlation between different scales, indicating little redundancy. Only two items (13 and 15) referring to the symptom scale showed item-scale correlation of r = 0.72 and r = 0.67, respectively with the lower body limitation scale. The assessment of internal consistency reliability also revealed satisfactory values: Cronbach's α was ≥0.83 for all scales, except for the social interaction scale (0.66). The test–retest reliability, estimated as the intraclass correlation coefficient (ICC), exceeded 0.85 except for the affect scale (0.72). Substantial floor effects occurred in the upper limb scale (33.8%). Principal factor analysis confirmed the postulated three-factor structure with physical, physiological and social dimensions, explaining 49.8, 14.1 and 6.4% of the variation, respectively. The assessment of external validity revealed satisfactory correlations with the corresponding WOMAC (Western Ontario and McMaster Universities Arthrosis Index) scales. As expected, correlations with radiological grading were moderate to low. The correlation with the physician's assessment was high in the scales that were dominated by physical factors, but rather low in the areas of health, which were found to be dominated by psychological or social factors.
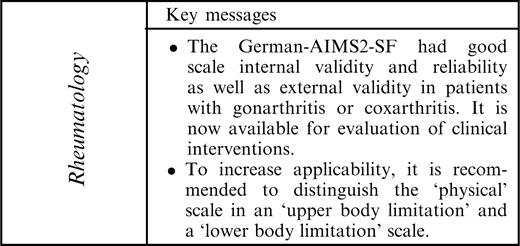
Conclusion. The German AIMS2-SF is a reliable and valid instrument to assess the quality of life in primary care patients suffering from OA. When addressing the different impacts of OA, the physical scale should be divided into an upper body scale and a lower body scale. The floor and ceiling effects revealed are in accordance with the disease characteristics of the study sample and do not limit the significance of the questionnaire.
Health-related quality of life is an important outcome measure in many clinical areas, including osteoarthritis (OA) of the knee or hip. Validated measuring instruments are needed to assess functional status and health-related quality of life in research and clinical practice. The AIMS questionnaire, originally developed by Meenan et al. in 1980 for rheumatoid arthritis, and the HAQ (Health Assessment Questionnaire) of James Fries were the first self-administered arthritis questionnaires [1, 2]. Several validation studies confirmed that AIMS is a practical, reliable and valid instrument for health-related quality of life. In 1992 the AIMS2, a revised version of the original, long version of AIMS, was released and validated in many countries [3–5]. A short version of the AIMS2, the AIMS2-SF, was developed by Guillemin et al. and reduced to 26 items in order to reduce time and effort and to increase acceptance among patients in clinical trials. It was validated in France, Norway and the Netherlands for RA and in the USA for patients with OA [6–8]. In several comparison studies, performed by Guillemin, Haarvardsholm and Taal, it proved to be just as reliable and valid as the long version, but without achieving perfect agreement [6, 8, 9]. In covering the five components of physical, affect, symptom, social interaction and role, the AIMS2-SF is more comprehensive than the frequently used instruments WOMAC (Western Ontario and McMaster Universities Arthrosis Index) [10] and the Lequesne index [11]. This comprehensiveness makes AIMS particularly useful for studies and interventions that use a multimodal rather than a pharmacologically oriented approach, such as self-management education [12–14]. So far, a German version of the AIMS2-SF has not been available. The aim of our study was to examine the validity of a translated and culturally adapted version of the AIMS-SF2 in primary care patients with OA of the knee or hip.
Subjects and methods
Recruitment of patients
Between April and July 2004, 220 patients were recruited in 21 primary care practices in Germany. The University of Heidelberg has 210 associated teaching practices; the practices were randomly selected from a list of these practices. Inclusion criteria were: over 18 yr of age; meeting criteria for OA according to the American College of Rheumatology [15, 16]; and sufficient German language skills to understand and answer the questionnaire. In addition, the availability of a diagnosis-specific radiograph, not older than 6 months at the date of questionnaire completion, was required. Patients were recruited in two regions with completely different dialects. All eligible patients gave their informed consent to the study, which was approved by the ethics committee of the University of Heidelberg. Patients were handed a questionnaire together with a small amount of information about the aim of the study and were asked to complete the questionnaire personally. After 1 week, follow-up questionnaires were handed to a subset of 35 patients together with an explanatory note, saying that the follow-up was not meant to remember the initial replies (but complete the questionnaire according to the current situation). Only two patients of the 222 initially approached refused to complete the questionnaire, because of the time and/or effort needed.
Translation and cultural adaptation
The German version of AIMS2-SF was translated and retranslated according to guidelines for cultural adaptation in order to address content validity [17]. Slight adaptations were necessary for item 7 (‘Did you have problems either walking several blocks or climbing a few flights of stairs?’. The expression ‘blocks’ is not commonly understood in German as a measure for distance and was replaced by ‘a few hundred metres’. Item 49 contains the expression ‘bothered by nervousness or your nerves’, which sparked intense discussion among the translators because there are various potential translations in German. The case was settled for a more understandable translation capturing the original idea of the item rather than the more direct translation.
The draft translation was piloted with 15 patients. In accordance with Taal et al., we replaced item 33 of the original AIMS2, ‘How often did you go to a meeting of a church, club, team or other group?’, with item 31, ‘How often did you visit friends or relatives at their homes?’, because this is to be expected to increase the internal consistency of the social interaction component [8, 18]. On the other hand we did not follow the Bland–Altman approach, unlike Taal and Havaardsholm, who replaced item 42 of the original AIMS version, ‘How often did your pain make it difficult for you to sleep?’, with item 38, ‘How would you describe the arthritis pain you usually had’ [9, 18]. Like Ren and colleagues [7], who validated the AIMS2-SF in the USA among patients with OA, we divided the German AIMS2-SF component ‘physical’ into the two components ‘upper body limitation’ and ‘lower body limitation’. Ren et al. discussed some possible limitations due to ceiling and floor effects, especially in patients suffering from OA to the knee or hip. As they did, we included item 1 (drive a car or use public transport), item 11 (need help to get dressed) and item 12 (need help to get out of bed) in the lower body limitation scale. We also followed their approach in including item 24 of the AIMS2-SF, ‘family and friends sensitive to personal needs’, and item 19, ‘enjoy the things you do’, in the affect scale and not in the social interaction scale. Contrary to Ren et al. and in agreement with some previous validation studies, we did not exclude the role component, even if this scale is usually only answered by half of the participants addressing only those who are still involved in the working process.
Other measures
In order to assess the external validity of the scales, additional data were retrieved.
The patient's general practitioner (GP) was asked to evaluate the severity of arthritis based on available radiographs, the patient's history and clinical examination based on the classification criteria of the American College of Rheumatology [15, 16]. The GP's evaluation was scored on a 0–10 scale, 10 representing no limitation of quality of life by arthritis and 0 representing massive limitation of quality of life. All patients were also given the validated German version of the WOMAC questionnaire [19], containing five-point Likert scales similar to the German AIMS2-SF questionnaire. For inclusion in the study, an X-ray of the affected joint, not older than 6 months, was required. The X-rays were scored according to the criteria of Kellgren and Lawrence [20]: grade 0 = normal; grade 4 = massive alterations with complete collapse of the joint space.
Statistical analysis
Data were entered in Microsoft Excel spreadsheets and analysed with the SPSS statistical package (version 11.0). When necessary, items were (according to the recommendations of Meenan et al. [1, 3]) recoded and transformed from graduated 10-point scales, Likert scales of the German AIMS2-SF and WOMAC and patient self-assessments, so that results for all items lay between 0 and 10, 0 representing the best and 10 the worst health status. Descriptive analysis included mean and standard deviation, and in order to assess floor and ceiling effects the percentage of participants achieving the lowest and highest possible score was calculated.
Internal consistency reliability
As an indicator of internal consistency reliability, we calculated Cronbach's α to estimate whether each item of a scale is appropriate for assessing the underlying concept of its scale [21, 22]. Achievable values for Cronbach's α range from 0, signifying no internal consistency, to 1, signifying identical results. We considered high internal consistency to be represented by values of 0.50–0.70 for group comparisons and by values of over 0.90 for individual patients' results.
Test–retest reliability
We used the intraclass correlation coefficient (ICC) as an estimate of test–retest reliability. In order to assess the test–retest reliability of the individual scales, we computed the ICC based on Ren et al.'s six-component model of the AIMS2-SF: upper body limitation; lower body limitation; affect; symptom; social interaction; and role. A random sample of 35 patients from the initial sample of 220 was asked to complete the questionnaire again after 7 days. All of the 35 patients selected for the retest returned their questionnaires. In order to be eligible for retest, patients had to have no change in therapeutic regimen, lifestyle or medication during these 7 days.
Scale internal validity
Scale internal validity was assessed by computing the correlation (Pearson's r) of the items with the respective scale corrected for overlap to avoid bias from self-correlation. A correlation of at least 0.4 was assumed as the standard for supporting scale internal consistency [7, 23]. Item-discriminant validity shows the extent to which an item measures what it is not supposed to measure: the degree of discriminatory power. It was assessed by computing the correlation (Pearson's r) of the items with the other scales. Cut-off values have not been defined, but in order to support the high discriminatory power of scales there should not be a high correlation for item discriminance.
Convergent validity
Convergent validity was assessed using external and internal criteria. In using external criteria to estimate convergent validity, different systems are usually compared and a linear relationship cannot be assumed. Therefore, Spearman rank correlation tests are most commonly used, e.g. in the validation studies of Stucki et al. (WOMAC) [19], Roos et al. (WOMAC) [24], Ludwig et al. (Lequesne) [25] and Salaffi et al. (AIMS) [23]. This study challenged the hypothesis that AIMS2-SF scales correlate with corresponding scales of the previously validated WOMAC questionnaire. In addition, the correlations of the AIMS2-SF with the Kellgren score and the physician assessment were estimated by computing the Spearman rank test. As Roos et al. have discussed in this context [24], correlations usually range between 0.2 and 0.6: correlations between 0.40 and 0.60 are regarded as good correlations and values above 0.6 as very high correlations. P-values are provided in order to show levels of statistical significance.
In addition to external criteria, convergent validity was also assessed by analysing demographic subgroups by age, gender and level of education. A low level of education was defined as education only as far as secondary school. Education more advanced than this was considered a high level of education. To compare the different groups we used Student's t-test for independent samples.
Construct validity
To explore construct validity we conducted a principal components factor analysis with varimax rotation analysis. The criterion for factor extraction was an eigenvalue >1.0.
Results
Table 1 displays the baseline characteristics of the study sample. Women were slightly under-represented in the patient group with coxarthritis. This is in line with the epidemiology of arthritis, which shows that women suffer more from gonarthritis and men more from coxarthritis. Mean duration of disease was 11.3 yr among women and 8.8 yr among men. For subgroup analysis, data on school and professional education and present occupation were retrieved.
Baseline characteristics of patients
| Main manifestation of OA | ||||||||||
|---|---|---|---|---|---|---|---|---|---|---|
| Sex | Hip | Knee | n | Kellgren score (mean) | s.d. | Duration (mean) | s.d. | Age (yr) | s.d. | |
| Female | 37 | 60 | 97 | 2.85 | 0.96 | 11.34 | 6.29 | 43.76 | 23.58 | |
| Male | 78 | 45 | 123 | 2.55 | 0.74 | 8.78 | 5.11 | 49.86 | 13.30 | |
| Total | 115 | 105 | 220 | 2.68 | 0.85 | 9.90 | 5.79 | 47.17 | 18.75 | |
Table 2 shows the descriptive statistics of the individual scales: mean, standard deviation, percentage of people achieving the lowest scores (indicating best health) and patients achieving the highest scores (indicating worst health status). As expected in a sample of patients suffering from OA of the knee or hip, the mean score on the lower body limitation scale was 3.37, clearly higher than the mean score on the upper body limitation scale (2.32). The difference in means (Student's t-test) was statistically significant (P<0.01). Substantial floor effects occurred in the upper body limitation scale, indicating that one-third (33.8%) of the patients had no limitation of the upper limb. Ceiling effects, representing the patients achieving the highest possible score and indicating the worst health status, were below 2.5%, except for the component lower limb function (3.9%). Substantial floor effects occurred in our study sample in the component upper body limitation (33.8%), and moderate floor effects in the role scale.
Descriptive statistics and score distributions for German AIMS2-SF
| n | Mean (range 0–10) | Median | s.d. | Ceiling (%) | Floor (%) | |
|---|---|---|---|---|---|---|
| Upper body limitation | 219 | 2.32 | 2.02 | 1.71 | 0.0 | 33.8 |
| Lower body limitation | 216 | 3.37 | 2.75 | 2.06 | 3.9 | 0.0 |
| Symptom | 220 | 3.32 | 2.49 | 2.74 | 1.8 | 1.8 |
| Affect | 219 | 4.27 | 4.10 | 1.29 | 2.4 | 0.0 |
| Social interaction | 218 | 5.11 | 5.01 | 1.94 | 2.3 | 0.1 |
| Role | 109 | 2.05 | 3.79 | 3.04 | 0.9 | 8.3 |
Assessing scale internal validity and reliability
Table 3 shows the statistical calculations of scale internal validity and reliability of the German AIMS-SF. Regarding the internal consistency scale, the correlations of single items with the referring scale ranged from 0.56 to 0.98, representing excellent consistency for the scales upper limb function, lower limb function, symptom and affect. Interestingly, the item-scale correlation achieved the highest values in the role scale. All scales achieved values above the minimum demanded threshold of 0.40, and therefore all values indicated high scale internal validity.
Parameters of scale internal validity and reliability
| Item-scale correlation | Item-discriminant validity | Reliability (Cronbach's α) | Test–retest correlation (ICC) | |
|---|---|---|---|---|
| Upper body limitation | 0.67–0.92 | 0.04–0.48 | 0.89 | 0.97 |
| Lower body limitation | 0.56–0.97 | 0.04–0.65 | 0.83 | 0.93 |
| Symptom | 0.69–0.94 | 0.13–0.72 | 0.83 | 0.95 |
| Affect | 0.58–0.98 | 0.13–0.35 | 0.82 | 0.72 |
| Social interaction | 0.52–0.90 | 0.06–0.64 | 0.66 | 0.77 |
| Role | 0.80–0.95 | 0.05–0.07 | 0.89 | 0.85 |
Regarding discriminatory power, Pearson's r for correlations between the items of a scale and the other scales were less than 0.48, excepting a few cases. Item 13, ‘How often did you have severe pain from your OA?’, and item 15, ‘How often did your pain make it difficult for you to sleep?’, of the symptom scale achieved a correlation of 0.72 and 0.67, respectively, with the ‘lower body function’ scale. Item 21, ‘How often did you meet with friends or relatives’, showed a correlation of r = 0.64 with the affect scale. Overall, the values achieved indicate high discriminatory power of the scales and little redundancy.
Computing Cronbach's α values revealed excellent values: all scales achieved values equal to or above 0.82, except for the social scale (0.66). In meeting and exceeding the recommended range of 0.5–0.7, the results indicated high internal consistency of the scales.
Generally high values for test–retest reliability were found for all scales except for the affect scale, for which the ICC was only 0.72, and the social interaction scale (ICC 0.77). With values above 0.81, the areas dominated by physical factors and the role scale showed slightly higher test–retest reliability.
Table 4 shows the results of the varimax rotation analysis with the three latent factors that could be extracted. The factor ‘physical’ explained 49.8% of the cumulated variation, the factor ‘psychological’ 14.1% and the factor ‘social’ 6.4%. The high loading of these three factors in certain items confirms that the dimensions are clearly distinguished. All items referring to the symptom component (item 13, severe arthritis pain; item 14, morning stiffness >1 h; and item 15, pain influencing sleep) are loaded on two factors, physical as well as psychological, reflecting the complex nature of these areas of health.
Principal components factor analysis with varimax rotation analysis (eigenvalue >1)
| Physical | Psychological | Social | |
|---|---|---|---|
| Percentage of variance explained | 49.8 | 14.1 | 6.4 |
| Usage of car or public transport | 0.56 | ||
| Staying in bed most of the day | 0.57 | 0.47 | |
| Trouble during vigorous activities | 0.51 | ||
| Trouble walking a few hundred metres/climbing | 0.43 | ||
| Unable to walk without assistance | 0.46 | ||
| Writing with a pencil | 0.92 | ||
| Buttoning a shirt | 0.91 | ||
| Turning a key | 0.90 | ||
| Combing or brushing hair | 0.70 | ||
| Reaching something above the head | 0.69 | ||
| Needing help to get dressed | 0.26 | 0.30 | |
| Needing help to get out of bed | 0.39 | ||
| Severe arthritis pain | 0.31 | 0.81 | |
| Morning stiffness >1 h | 0.37 | 0.75 | |
| Pain influences sleep | 0.38 | 0.70 | |
| Feeling tense | 0.48 | ||
| Bothered by nerves | 0.50 | ||
| In low or very low spirits | 0.64 | ||
| Enjoying things | 0.58 | ||
| Feeling to be a burden on others | 0.30 | ||
| Getting together with friends | 0.84 | ||
| Phoning close friends or relatives | 0.78 | ||
| Visiting friends or relatives | 0.65 | ||
| Family or friends sensitive to your needs | 0.77 |
Factor loadings >0.30 are reported.
Assessing external validity
Table 5 shows the correlations between German AIMS2-SF scores and the data that were collected to estimate external validity. To compare different systems without linear relationship, we computed Spearman's rank correlation coefficient ρ. The highest correlation of the German AIMS2-SF was found between the symptom scale and the WOMAC scale for pain (ρ = 0.83). The WOMAC questionnaire addresses only the knee and hip; therefore correlations of the German AIMS2-SF lower limb function scale with the WOMAC scales ranging from 0.52 to 0.78 are higher than for the upper limb function scale, where Spearman's ρ ranges from 0.28 to 0.47. In accordance with previous studies, the correlations between the German AIMS2-SF and the radiological Kellgren and Lawrence scores were low, achieving the highest values in the symptom scale (ρ = 0.42) and the lower body limitation scale (ρ = 0.36).
Convergent validity results: correlations between AIMS2-SF scales and external assessments (Spearman rank coefficient ρ)
| WOMAC | |||||||||
|---|---|---|---|---|---|---|---|---|---|
| AIMS scale | Function | Stiffness | Pain | Global | Kellgren score | Physician assessment | |||
| Upper body limitation | 0.28** | 0.36** | 0.47** | 0.32** | 0.27** | 0.42** | |||
| Lower body limitation | 0.54** | 0.52** | 0.78** | 0.46** | 0.36** | 0.55** | |||
| Symptom | 0.52** | 0.56** | 0.83** | 0.57** | 0.42** | 0.60** | |||
| Affect | 0.36** | 0.45** | 0.58** | 0.41** | 0.25 | 0.35** | |||
| Social interaction | 0.29** | 0.28** | 0.41** | 0.29** | 0.12 | 0.23** | |||
| Role | −0.21* | −0.12 | −0.17 | 0.21* | 0.21* | 0.17 | |||
*P<0.05; **P<0.01.
Correlations between AIMS2-SF and the physician's assessment ranged from low values for the role and social interaction scales (ρ = 0.17 and ρ = 0.23, respectively) to good values for the lower body limitation scale (ρ = 0.55) and the symptom scale (ρ = 0.60).
Relationship with demographic subgroups
The use of demographic and socioeconomic subgroups is an additional approach to the assessment of convergent validity. Table 6 displays the results of these analyses. The differences were assessed with Student's t-test for independent samples. Women obtained significantly higher average scores in the physical and symptom scales, indicating worse health status and more burden due to OA. Women also had higher average scores for social interactions (5.69) and affect (4.81), with a statistically significant difference in the variance of the means (P<0.05 and P<0.01, respectively). This is in line with previous studies from Salaffi et al. and may be due to the fact that female study participants on average suffered longer from arthritis than male participants (11.3 vs 8.8 yr) [23].
Mean scores for demographic subgroups: Student's t-test
| Sex | Age | Education | |||||||||||||
|---|---|---|---|---|---|---|---|---|---|---|---|---|---|---|---|
| Female | Male | P | <65 | >65 | P | Low | High | P | |||||||
| n | 97 | 123 | 159 | 60 | 125 | 95 | |||||||||
| Upper body limitation | 3.62 | 2.55 | 0.61 | 2.31 | 4.11 | ** | 3.50 | 2.03 | ** | ||||||
| Lower Body limitation | 4.37 | 2.62 | ** | 2.63 | 5.45 | ** | 4.12 | 2.39 | ** | ||||||
| Symptom | 4.69 | 3.09 | ** | 2.50 | 5.98 | ** | 4.49 | 1.88 | ** | ||||||
| Affect | 4.81 | 3.83 | * | 4.01 | 4.95 | 0.47 | 4.55 | 3.90 | 0.64 | ||||||
| Social interaction | 5.69 | 4.64 | ** | 4.82 | 5.88 | 0.43 | 5.44 | 4.66 | 0.71 | ||||||
| Role | 3.11 (n = 35) | 2.72 (n = 74) | 0.55 | – | – | – | 3.33 (n = 46) | 2.61 (n = 63) | 0.07 | ||||||
*P<0.05; **P<0.01.
As expected, the scores for the patients aged over 65 yr indicated a greater effect of OA in all scales, especially in the scales referring to physical aspects and pain. Similar differences could be found between the participants with a low vs high educational level. A higher educational level is associated with lesser burden from reduced physical capacity and pain, as represented in the symptom scale.
Discussion
In research and practice, valid measurement instruments are needed to assess quality of life in patients with OA of the knee or hip. The internationally well-known AIMS2-SF was not yet available in the German language. Therefore we translated the instrument into German and tested it in a sample of primary care patients. Our findings showed that the instrument had reasonably good scale internal validity, reliability and external validity in the primary setting. It is easy to use for patients and it covers most important areas of quality of life that are influenced by degenerative joint processes. We conclude that the German AIMS2-SF is well suited for quality of life assessment in patients suffering from OA of the knee or hip in a primary care setting.
The results of the assessment of scale internal validity, internal consistency and item-discriminant validity indicated that the German AIMS2-SF questionnaire appears to measure what it is supposed to measure and that its items are selective and non-redundant.
Cronbach's α showed very satisfactory results and by following the approach of Ren et al. in including item 19 (which asked the patients whether they enjoyed the things they did) in the affect scale, even the value for the social scale reached 0.66, results quite similar to those of the validation study of Ren (0.67) and much better than in the study of Guillemin et al. (0.32) [6, 7]. The ICC values (assessing test–retest reliability) indicated good reproducibility. The lowest ICC value was found for the affect scale and the social interaction scale, an area that largely depends on external factors, such as telephone calls and visits from friends and family. These scales have performed similarly in validation studies in other languages [8, 23].
Correlations of the German AIMS2-SF scales with corresponding scales from the already validated German WOMAC were very satisfactory. In achieving quite different values for the upper body limitation and lower body limitation scales, the correlations with the WOMAC questionnaire substantiate the approach of Ren et al. [7] in dividing the physical scale into scales addressing upper and lower limb functioning. Ren et al. [7] (using a different coding, 0 representing worst and 10 representing best health status) found substantial ceiling effects in their validation study among patients with OA. They discussed possible limitations of the AIMS2-SF in applying it to patients with OA of the lower limb section. In our inclusion of patients suffering from OA to knee or hip we found no substantial ceiling effects in the lower limb scale but quite large floor effects in the upper limb section. Our results are in line with the findings of Taal et al. [8], who reported moderate floor effects (1.6) and no ceiling effects (0.0) in the physical scale, and Salaffi et al. [26], who also found only moderate ceiling (0.6–4.1) effects in the scales representing lower limb function but substantial floor effects (43.9–67.1) in the scales representing upper limb function. Like Salaffi et al., we regard the disease characteristics of the study sample as responsible for these results. To summarize, we did not find any possible limitations due to ceiling or floor effects of the German AIMS2-SF in patients suffering from OA of the knee or hip.
As expected, and supported by clinical experience, the correlation between the AIMS2-SF and radiological scores were low to moderate in the symptom and lower body limitation scales [19, 27, 28]. It is known that self-reported functional ability assessed by instruments such as the AIMS reflects physical impairment due to the arthritic joint disease quite well [29]. Therefore, it is not surprising that the correlation was high between physician assessment and physical aspects of the AIMS. The fact that the correlation was much lower for items reflecting social interaction may indicate that these areas are outside the scope of physicians' assessment of their patients' quality of life, even for GPs who are well acquainted with their patients, as was the case in this study. Therefore, these results reflect the potential benefit of AIMS in OA-related quality of life assessment in primary care.
As in previous validation studies, the principal factor analysis indicated high construct validity by revealing three latent factors: physical, psychological and social; these explained 70.4% of the variance of the entire questionnaire [5, 23]. Comparison of demographic subgroups consistently showed plausible results: impairment increased with age [28]. In line with previous studies, educational level affected quality of life. Salaffi et al. [26] also found higher levels of education to be related to higher quality of life in the validation study of the Italian AIMS questionnaire. Therefore, the results for the demographic subgroups substantiate the convergent validity of the German AIMS2-SF.
Especially due to demographic trends, the incidence and prevalence of OA are increasing in most western industrialized nations. They cause a substantial burden of disease, as well as high direct and indirect costs. OA has a massive impact on patients' quality of life, which poses a challenge to reliable and valid measurement instruments for the assessment of potential interventions. The well-established WOMAC and Lequesne questionnaires can be used to assess medical and surgical interventions in OA. In addition to these two instruments, the AIMS2-SF questionnaire also addresses aspects of life that are less directly related to joint diseases. The AIMS2-SF is therefore suitable for use in the evaluation of multimodal interventions, such as self-management programmes [30]. Results from hospital-based studies cannot easily be generalized to primary care. The present validation study underlines that the German culturally adapted AIMS2 short version promises to have these qualities. The instrument could be used in different German regions with distinct dialects. As in previous studies, willingness to participate was high among OA patients. This was reflected by high response rates, both in the test and the retest, and in the low rate of unanswered items.
The results presented are particularly interesting because results of hospital- or treatment centre-based studies cannot easily be transferred to a primary care setting. The results of this validation study indicate that the German AIMS2-SF is a valid and reliable instrument for assessing the quality of life of patients with OA and it provides us with an important instrument to assess the effects of complex interventions in primary care.
This study was part of the PRAXARTH project, which aims to improve the quality of life of patients with OA. The project is financed by the German Ministry of Education and Research (BMBF), grant 01GK0301. The authors wish to thank all the participating doctors, especially R. F. Meenan and F. Guillemin.
All authors declare that there is no conflict of interest.
References
Meenan RF, Gertman PM, Mason JH. Measuring health status in arthritis. The arthritis impact measurement scales.
Fries JF, Spitz P, Kraines RG, Holman HR. Measurement of patient outcome in arthritis.
Meenan RF, Mason JH, Anderson JJ, Guccione AA, Kazis LE. AIMS2. The content and properties of a revised and expanded Arthritis Impact Measurement Scales Health Status Questionnaire.
Chu EM, Chiu KY, Wong RW, Tang WM, Lau CS. Translation and validation of Arthritis Impact Measurement Scales 2 into Chinese: CAIMS2.
Riemsma RP, Taal E, Rasker JJ, Houtman PM, Van Paassen HC, Wiegman O. Evaluation of a Dutch version of the AIMS2 for patients with rheumatoid arthritis.
Guillemin F, Coste J, Pouchot J, Ghezail M, Bregeon C, Sany J. The AIMS2-SF: a short form of the Arthritis Impact Measurement Scales 2. French Quality of Life in Rheumatology Group.
Ren XS, Kazis L, Meenan RF. Short-form Arthritis Impact Measurement Scales 2: tests of reliability and validity among patients with osteoarthritis.
Taal E, Rasker JJ, Riemsma RP. Psychometric properties of a Dutch short form of the Arthritis Impact Measurement Scales 2 (Dutch-AIMS2-SF).
Haavardsholm EA, Kvien TK, Uhlig T, Smedstad LM, Guillemin F. A comparison of agreement and sensitivity to change between AIMS2 and a short form of AIMS2 (AIMS2-SF) in more than 1,000 rheumatoid arthritis patients.
Bellamy N, Buchanan WW, Goldsmith CH, Campbell J, Stitt LW. Validation study of WOMAC: a health status instrument for measuring clinically important patient relevant outcomes to antirheumatic drug therapy in patients with osteoarthritis of the hip or knee.
Lequesne MG, Mery C, Samson M, Gerard P. Indexes of severity for osteoarthritis of the hip and knee. Validation—value in comparison with other assessment tests.
Dieppe PA. Relationship between symptoms and structural change in osteoarthritis. what are the important targets for osteoarthritis therapy?
Lorig KR, Ritter P, Stewart AL et al. Chronic disease self-management program: 2-year health status and health care utilization outcomes.
Altman R, Asch E, Bloch D et al. Development of criteria for the classification and reporting of osteoarthritis. Classification of osteoarthritis of the knee. Diagnostic and Therapeutic Criteria Committee of the American Rheumatism Association.
Altman R, Alarcon G, Appelrouth D et al. The American College of Rheumatology criteria for the classification and reporting of osteoarthritis of the hip.
Guillemin F, Bombardier C, Beaton D. Cross-cultural adaptation of health-related quality of life measures: literature review and proposed guidelines.
Bland JM, Altman DG. Statistical methods for assessing agreement between two methods of clinical measurement.
Stucki G, Meier D, Stucki S et al. [Evaluation of a German version of WOMAC (Western Ontario and McMaster Universities) Arthrosis Index].
Kellgren JH, Lawrence JS. Radiological assessment of osteo-arthrosis.
Salaffi F, Ferraccioli GF, Troise RW, Carotti M, Sacchini G, Cervini C. [The validity and reliability of the Italian version of the Arthritis Impact Measurement Scales in patients with rheumatoid arthritis].
Roos EM, Klassbo M, Lohmander LS. WOMAC osteoarthritis index. Reliability, validity, and responsiveness in patients with arthroscopically assessed osteoarthritis. Western Ontario and MacMaster Universities.
Ludwig FJ, Melzer C, Grimmig H, Daalmann HH [Cross cultural adaptation of the Lequesne algofunctional indices for German speaking patients with osteoarthritis of the hip and the knee].
Salaffi F, Piva S, Barreca C et al. Validation of an Italian version of the arthritis impact measurement scales 2 (ITALIAN-AIMS2) for patients with osteoarthritis of the knee. Gonarthrosis and Quality of Life Assessment (GOQOLA) Study Group.
Felson DT, Naimark A, Anderson J, Kazis L, Castelli W, Meenan RF. The prevalence of knee osteoarthritis in the elderly. The Framingham Osteoarthritis Study.
Evers AW, Taal E, Kraaimaat FW et al. A comparison of two recently developed health status instruments for patients with arthritis: Dutch-AIMS2 and IRGL. Arthritis Impact Measurement Scales. Impact of Rheumatic diseases on General health and Lifestyle.
Hakala M, Nieminen P, Manelius J. Joint impairment is strongly correlated with disability measured by self-report questionnaires. Functional status assessment of individuals with rheumatoid arthritis in a population based series.
Author notes
Department of General Practice and Health Services Research, University of Heidelberg, Heidelberg, Germany and 1Centre for Quality of Care Research, Radboud University Medical Centre Nijmegen, Nijmegen, The Netherlands.

Comments